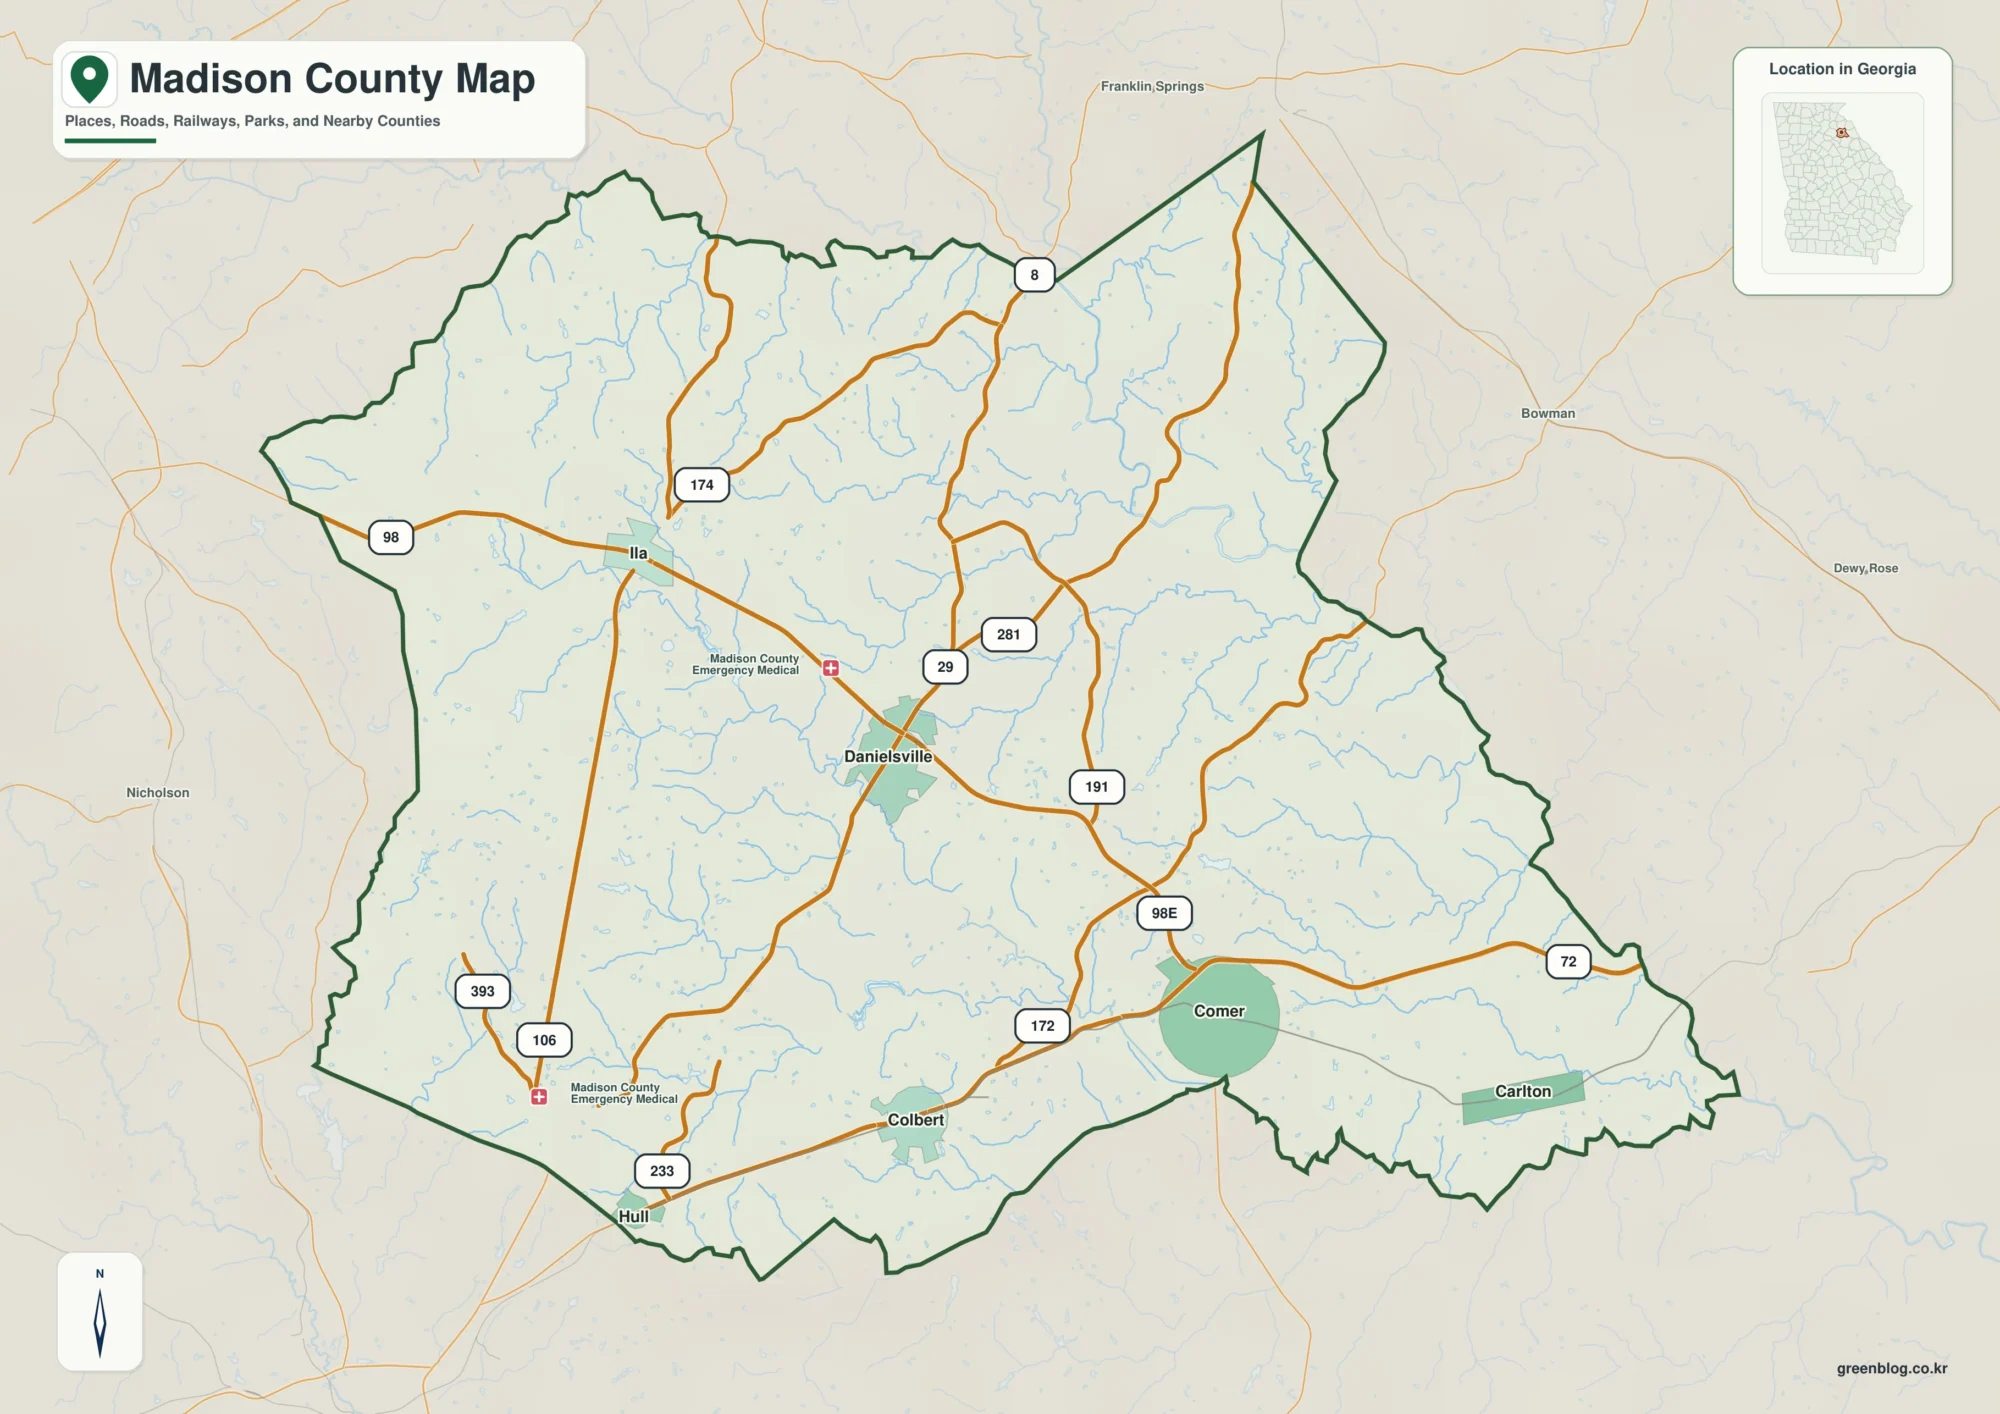
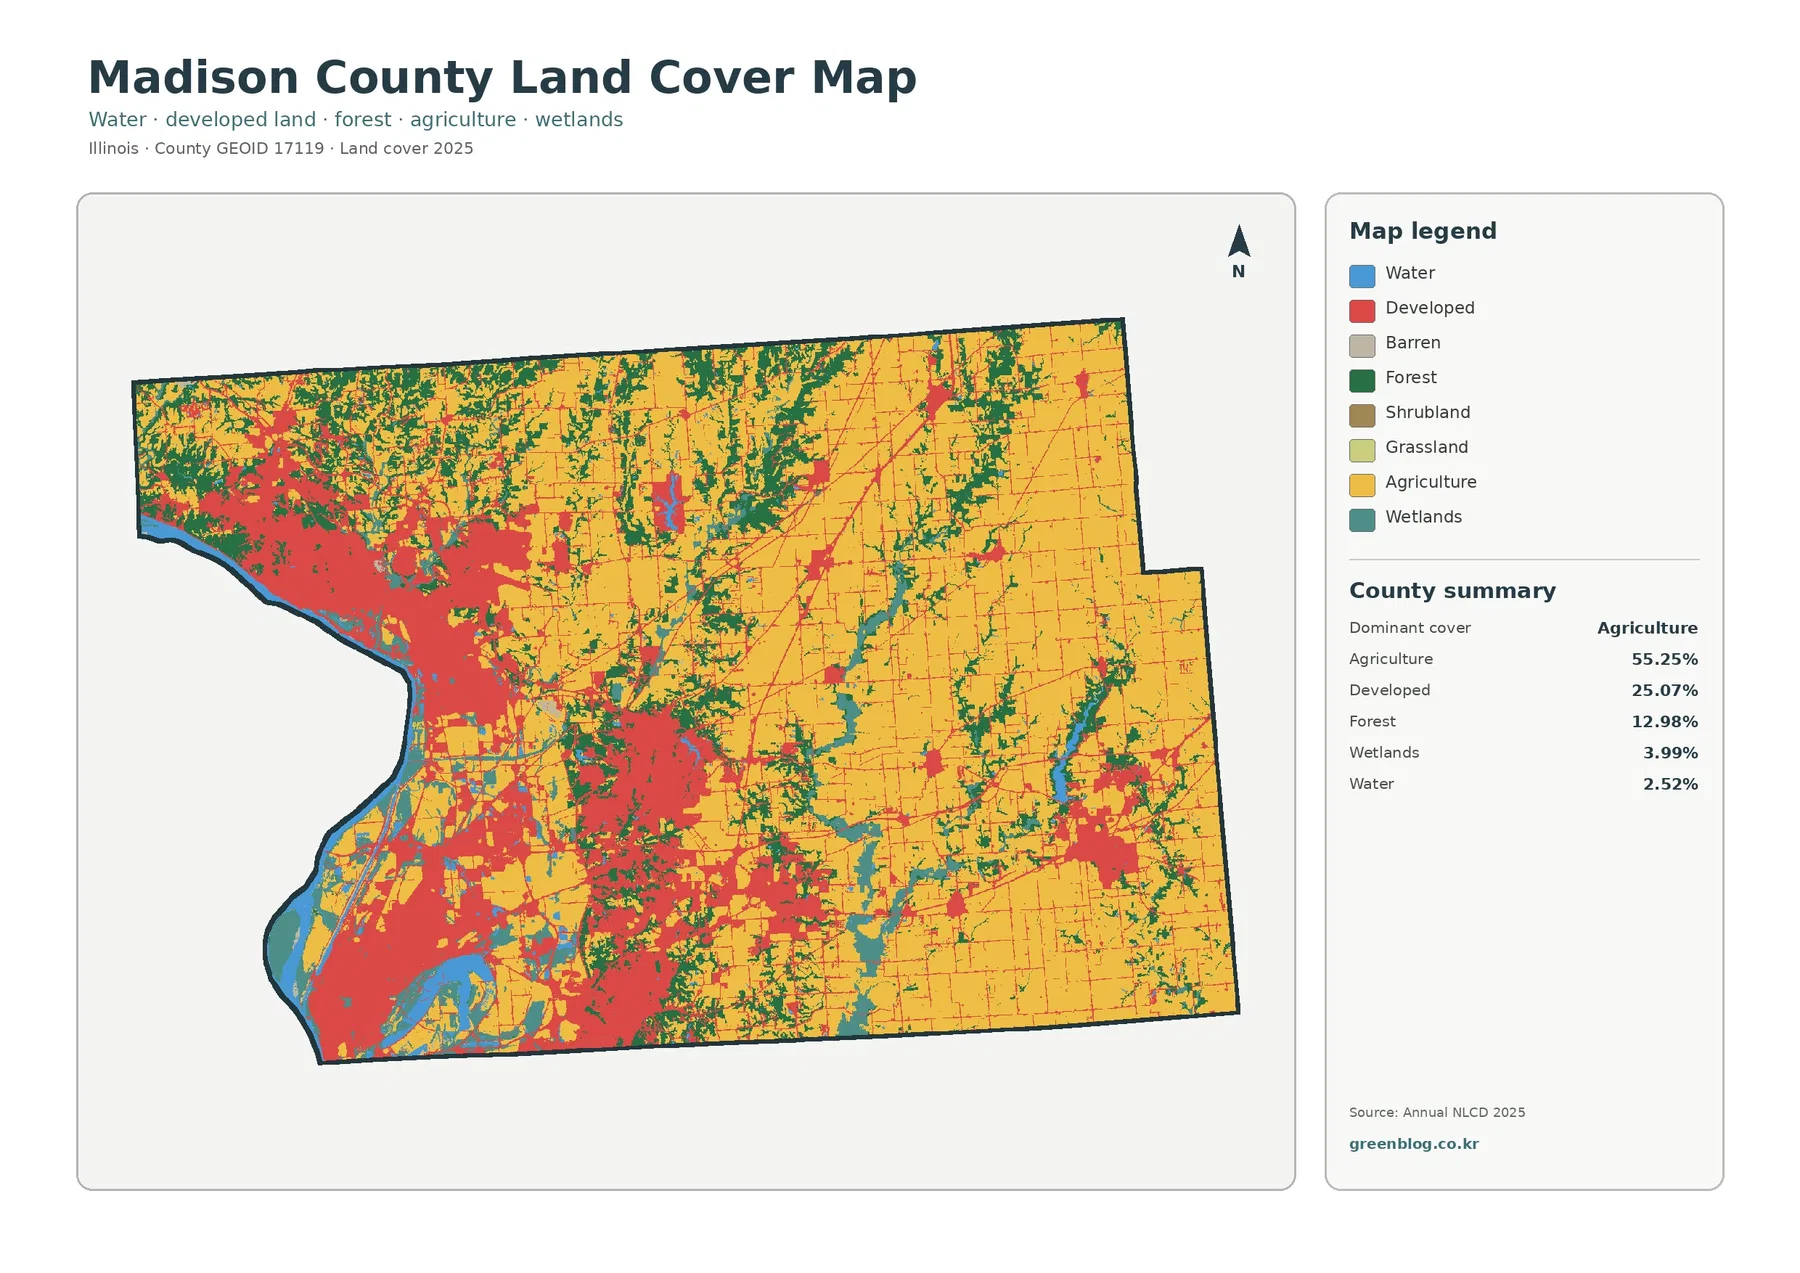
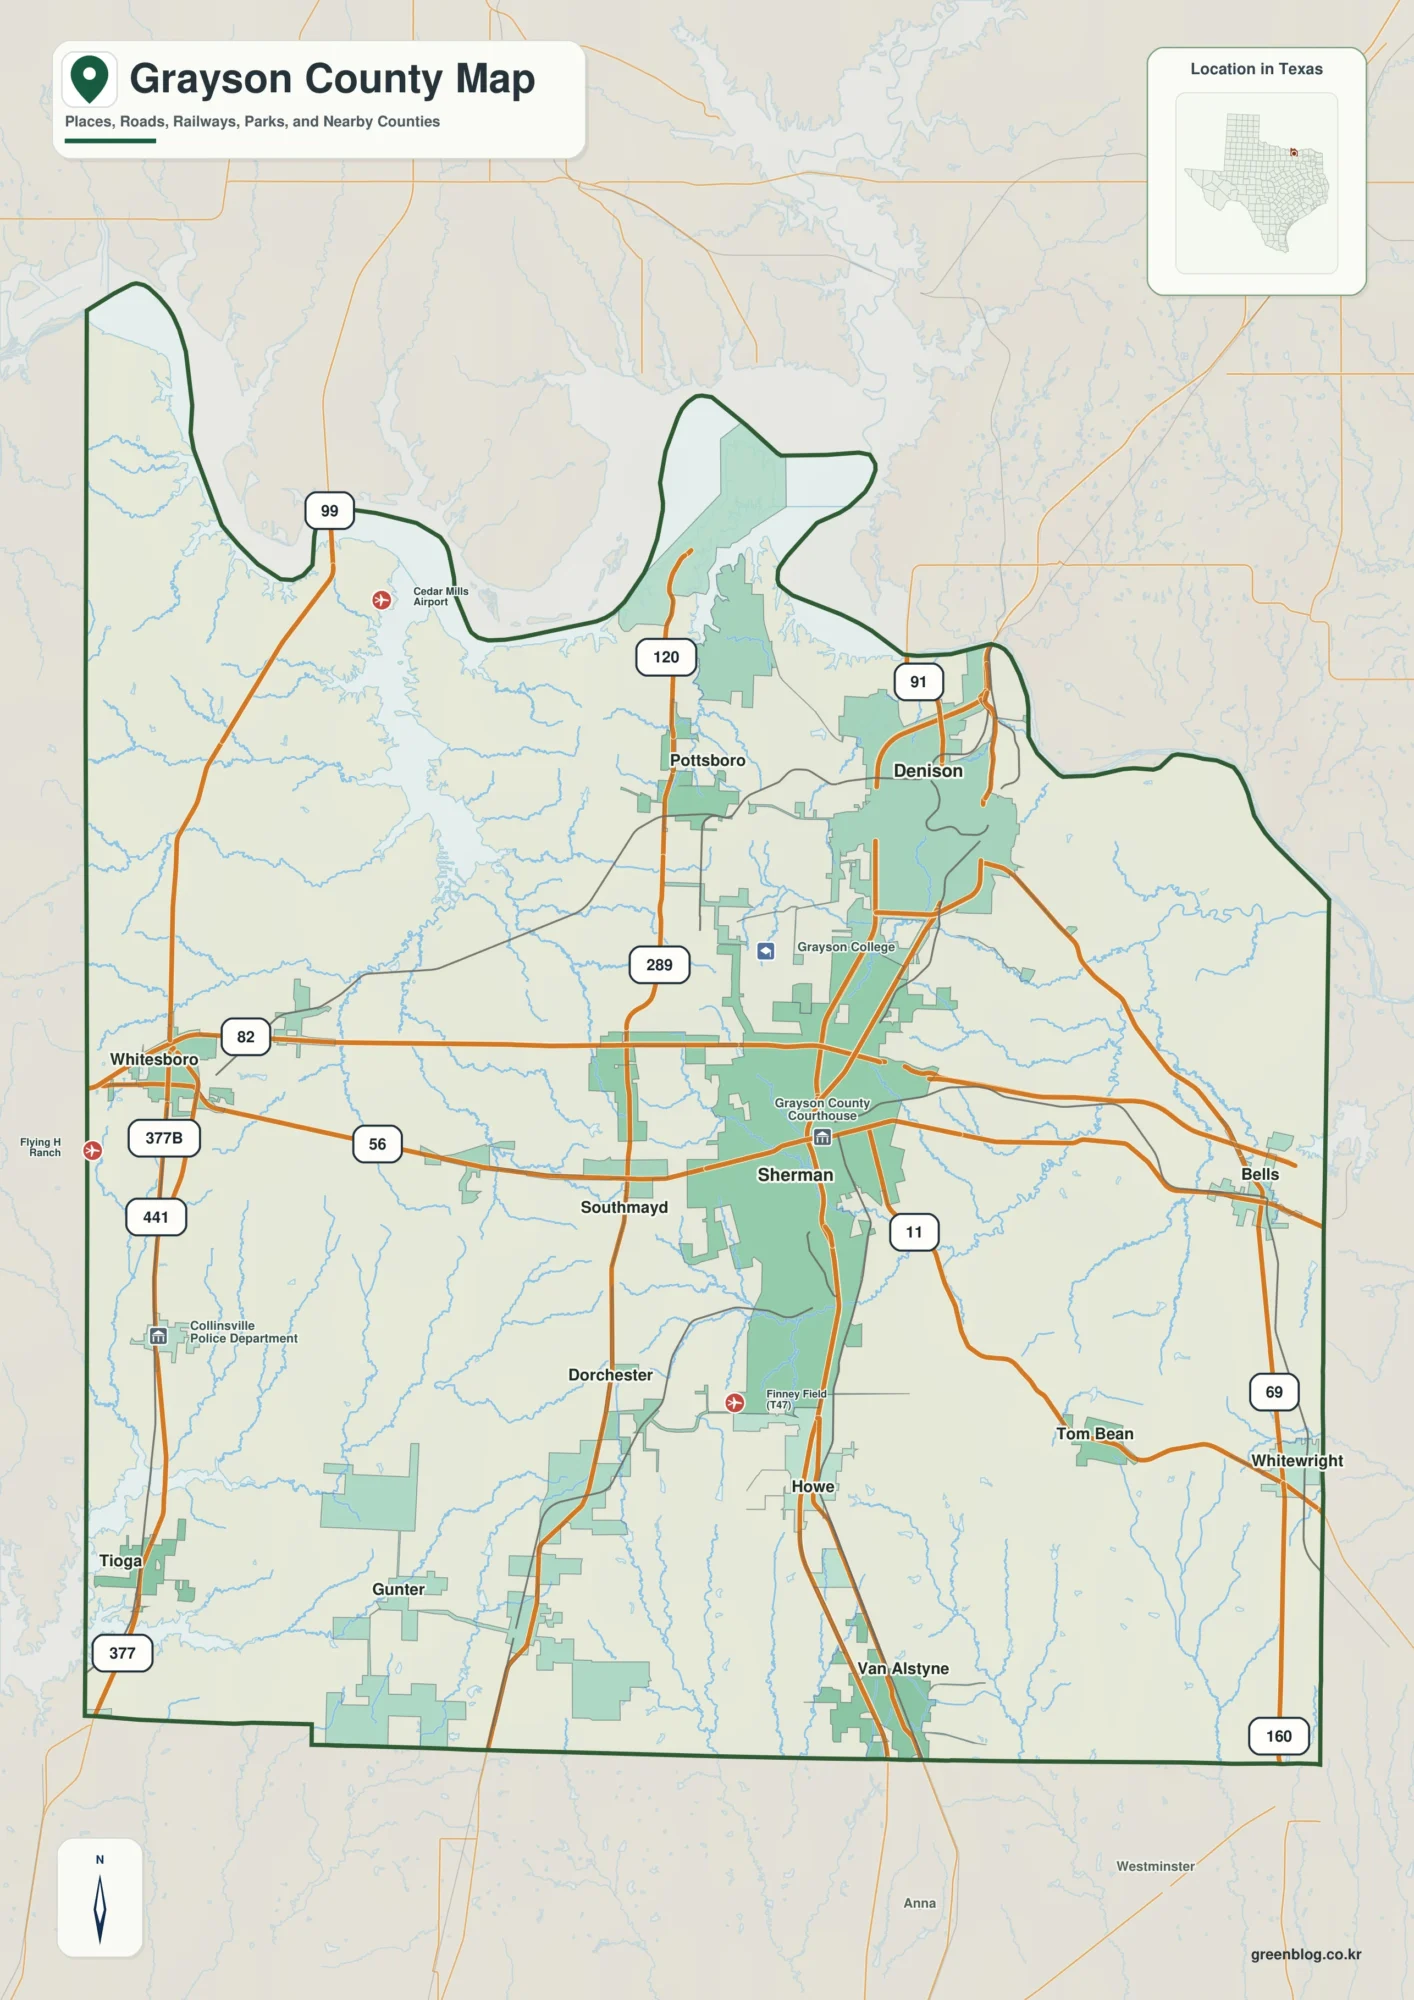
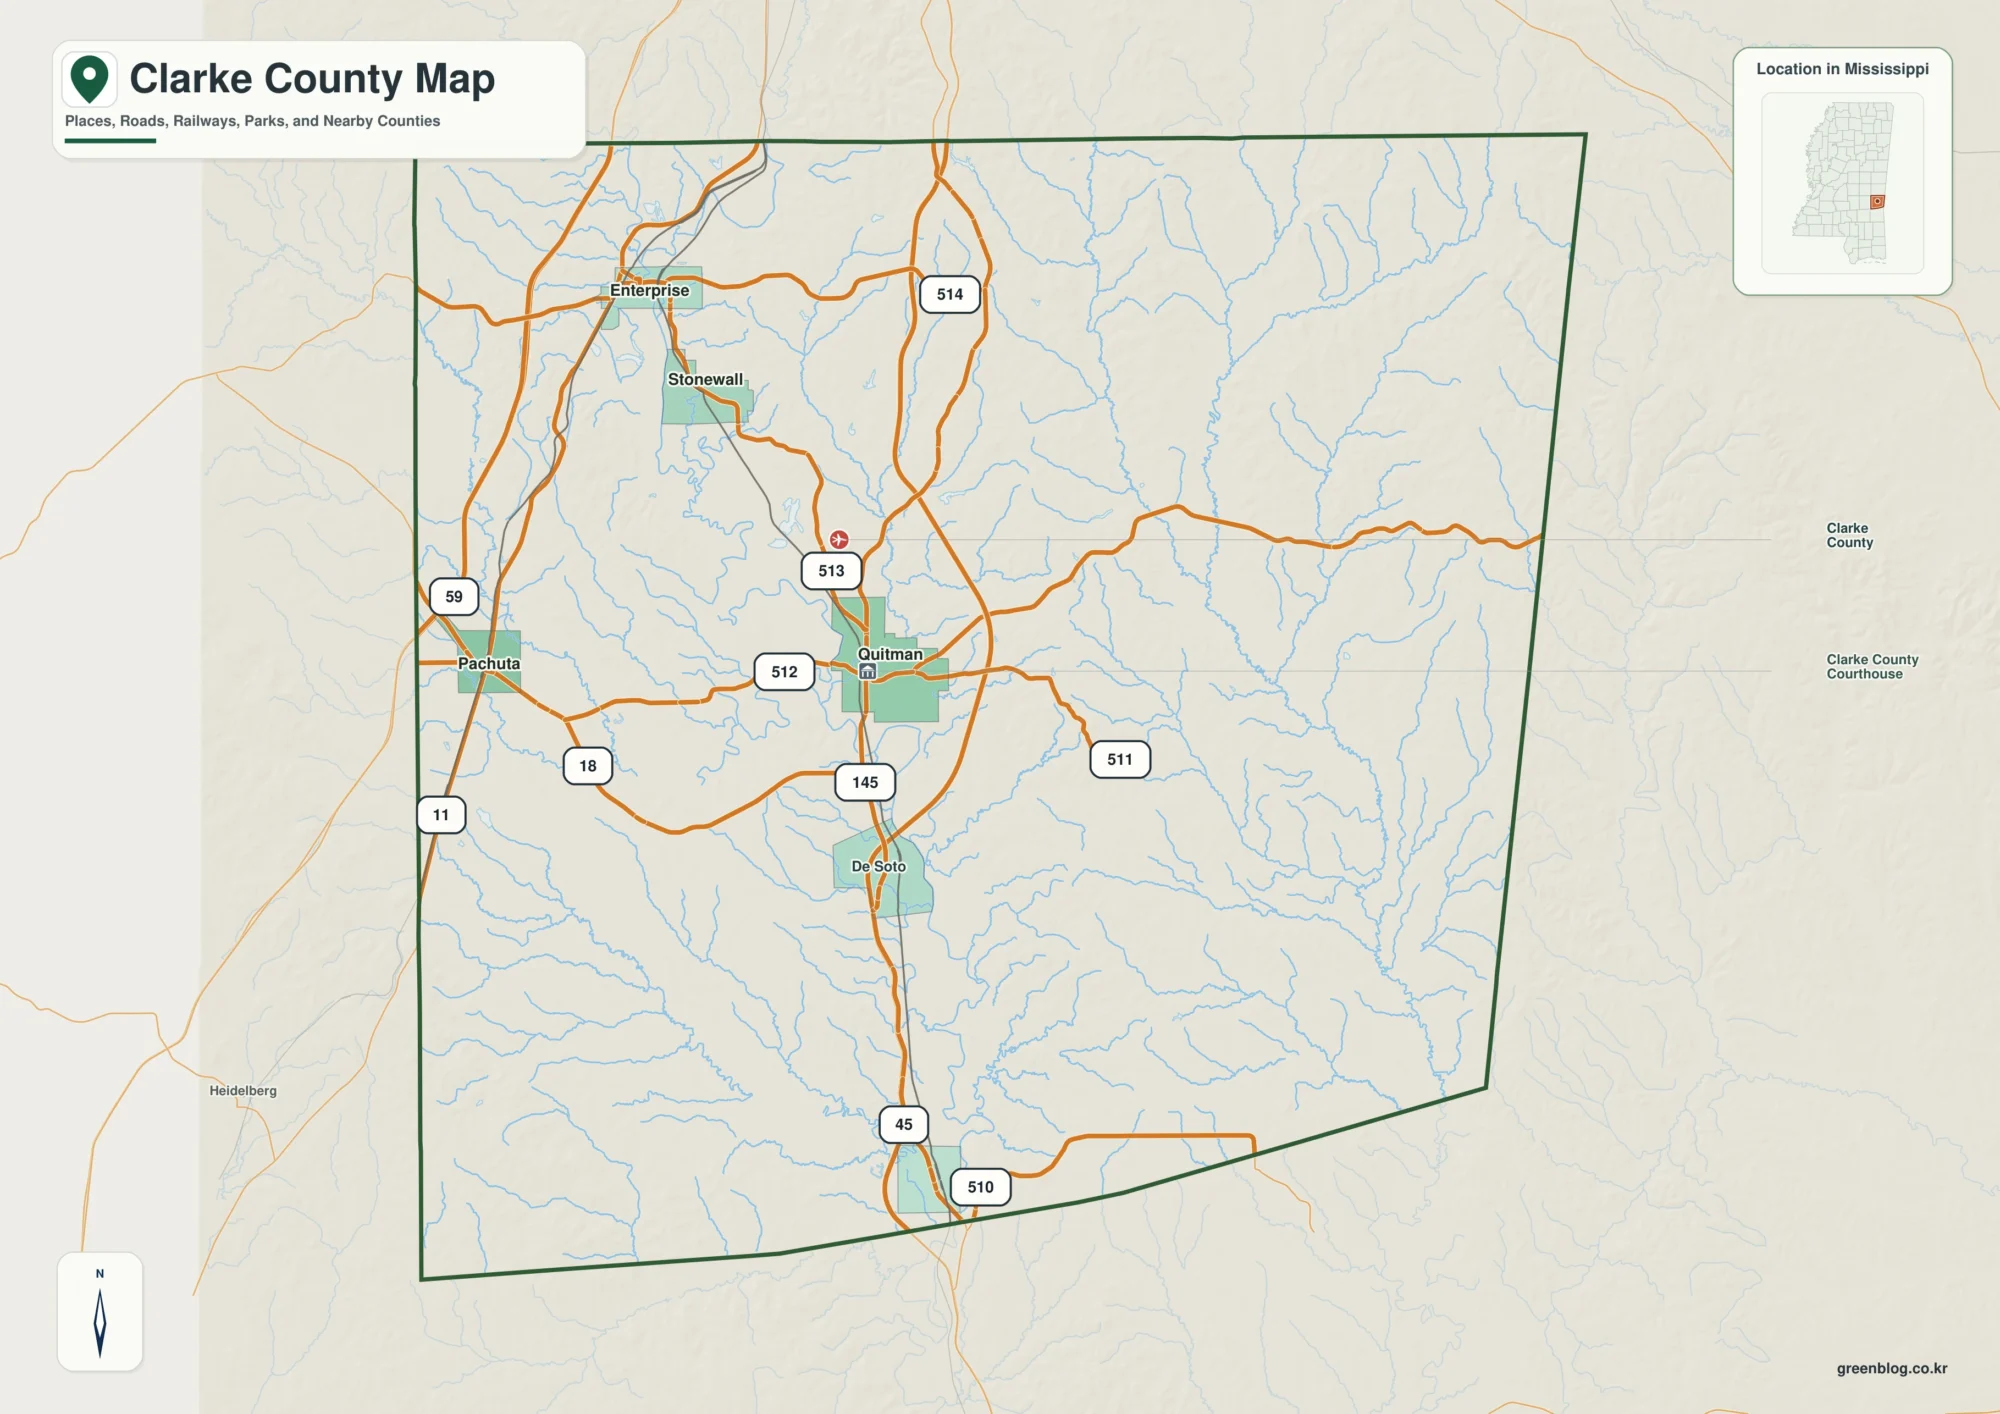
The Hardin County Illinois Map on this page is designed for readers who want to understand a small but unusually rugged Ohio River county before opening the full-size files. The browser previews show the county boundary and roads, the three mapped communities, a dense network of creeks and rivers, and a shaded elevation surface. A downloadable ZIP near the end of the article contains the same four views as original high-resolution JPG images, which are better suited to printing, enlarging labels, and comparing terrain details.
Hardin County sits at the southeastern tip of Illinois, where the county outline is strongly shaped by the Ohio River. Census QuickFacts reports 177.39 square miles of land area for 2020, and the supplied maps make that compact scale easy to see: Rosiclare, Elizabethtown, and Cave-in-Rock all sit along the southern river side, while much of the interior is filled with ridges, short valleys, and branching streams rather than a large urban street grid. The result is a county where water and relief are more useful orientation clues than city blocks.
A practical way to use the set is to begin with the road-and-boundary map, locate the three river communities, and then switch to the city-connections view to compare their spacing. The terrain-and-water map explains why the interior looks so dissected, while the elevation surface shows the contrast between the low river margins and the much higher ridges inland. Read in that order, the four images tell one connected geographic story rather than four separate versions of the same outline.
Table of Contents
An Ohio River County from Rosiclare to Cave-in-Rock
The general county map is dominated by the Ohio River along the south and east. The western boundary is comparatively straight, but the southern edge bends with the river below Rosiclare and Elizabethtown before turning toward Cave-in-Rock. Farther east, the boundary follows another long river curve and then rises northward. This makes Hardin County easy to recognize by shape alone: instead of a simple rectangular county outline, it has a broad river-facing arc with a narrow southwestern projection around Rosiclare.
The three strongest settlement labels are also concentrated near that river edge. Rosiclare lies in the southwest, Elizabethtown sits a short distance east along the Ohio, and Cave-in-Rock appears farther east near the lower end of Illinois Route 1. The large northern interior has far fewer prominent place labels. On the map, that empty-looking space is not featureless; it is crossed by many small waterways and ridges that become much clearer on the terrain-and-water and elevation views.
Road labels help tie the communities together. Route 146 runs east from the Elizabethtown area toward Route 1 and Cave-in-Rock, while Route 1 runs north-south through the eastern part of the county. Shields for 34, 350, and 550 appear farther west and southwest. These labels are useful for orientation, but the map is not a live traffic product, so current closures, construction, or travel times should be checked with current transportation sources before a trip.
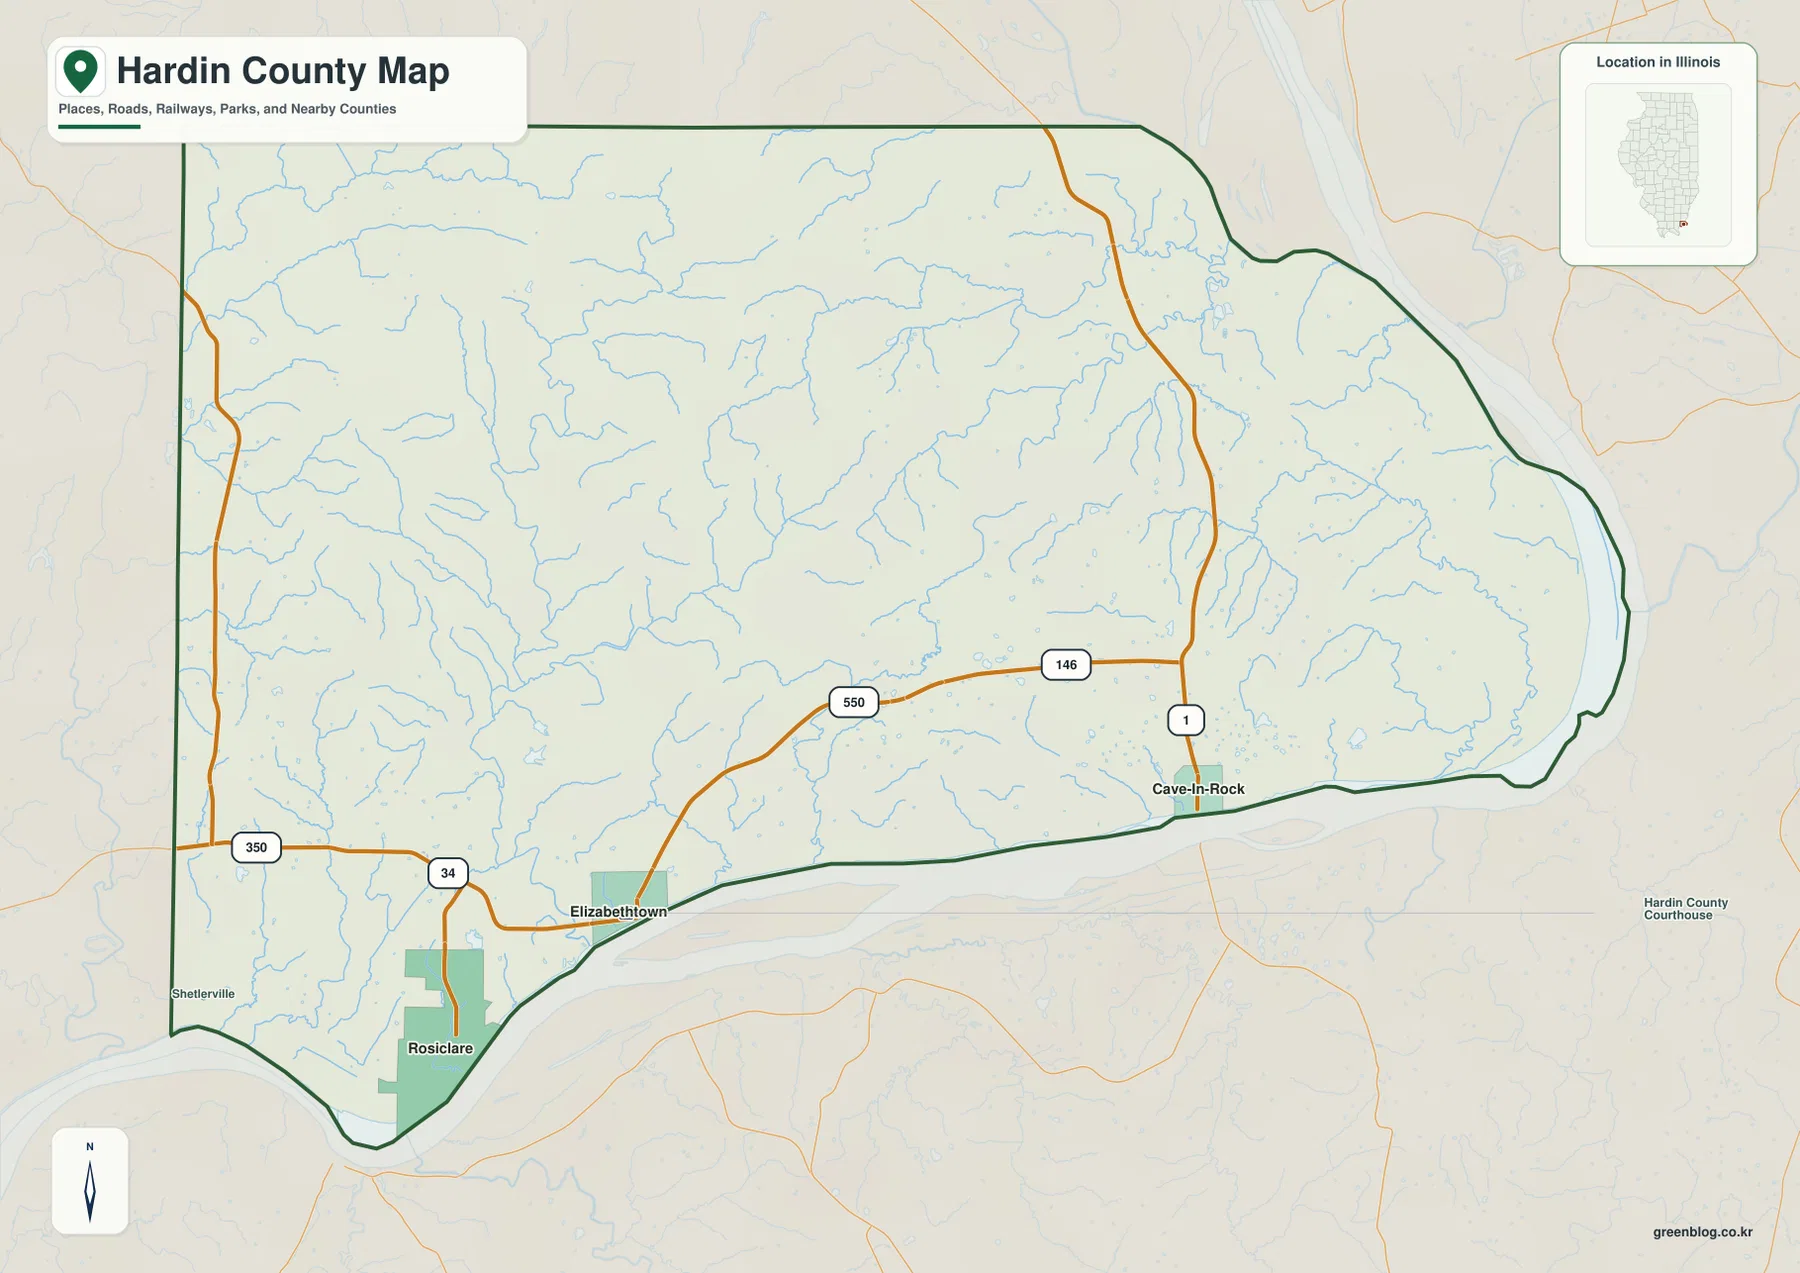
Cave-in-Rock adds a strong landscape reference to the eastern end. The Illinois Department of Natural Resources describes Cave-in-Rock State Park as a wooded bluff above the Ohio River, named for a large limestone cave carved by water. That official description matches what the map set suggests visually: the river edge is not simply a flat floodplain. Bluffs, steep slopes, and short creek valleys rise close behind the river, especially when the general map is compared with the relief images.
Three River Communities and Straight-Line Spacing
The city-connections map strips away most of the road detail and uses Rosiclare as the hub. Elizabethtown is the second point and Cave-in-Rock the third. The graphic prints values of 961 for Rosiclare, 396 for Elizabethtown, and 210 for Cave-in-Rock, but those figures should be treated as values printed on this supplied map rather than as a claim about the newest official population estimates. Readers who need current population data should use the Census Bureau rather than infer it from a static image.
More useful for map reading are the direct-distance labels. Elizabethtown is shown about 3 miles from Rosiclare, while Cave-in-Rock is about 11 miles from the Rosiclare hub. The map explicitly identifies these as direct distances, meaning straight-line separation rather than driving mileage. Road travel can be longer because the routes follow the river margin and uneven terrain. Even so, the labels clearly show how closely Rosiclare and Elizabethtown sit together compared with the longer eastward stretch to Cave-in-Rock.
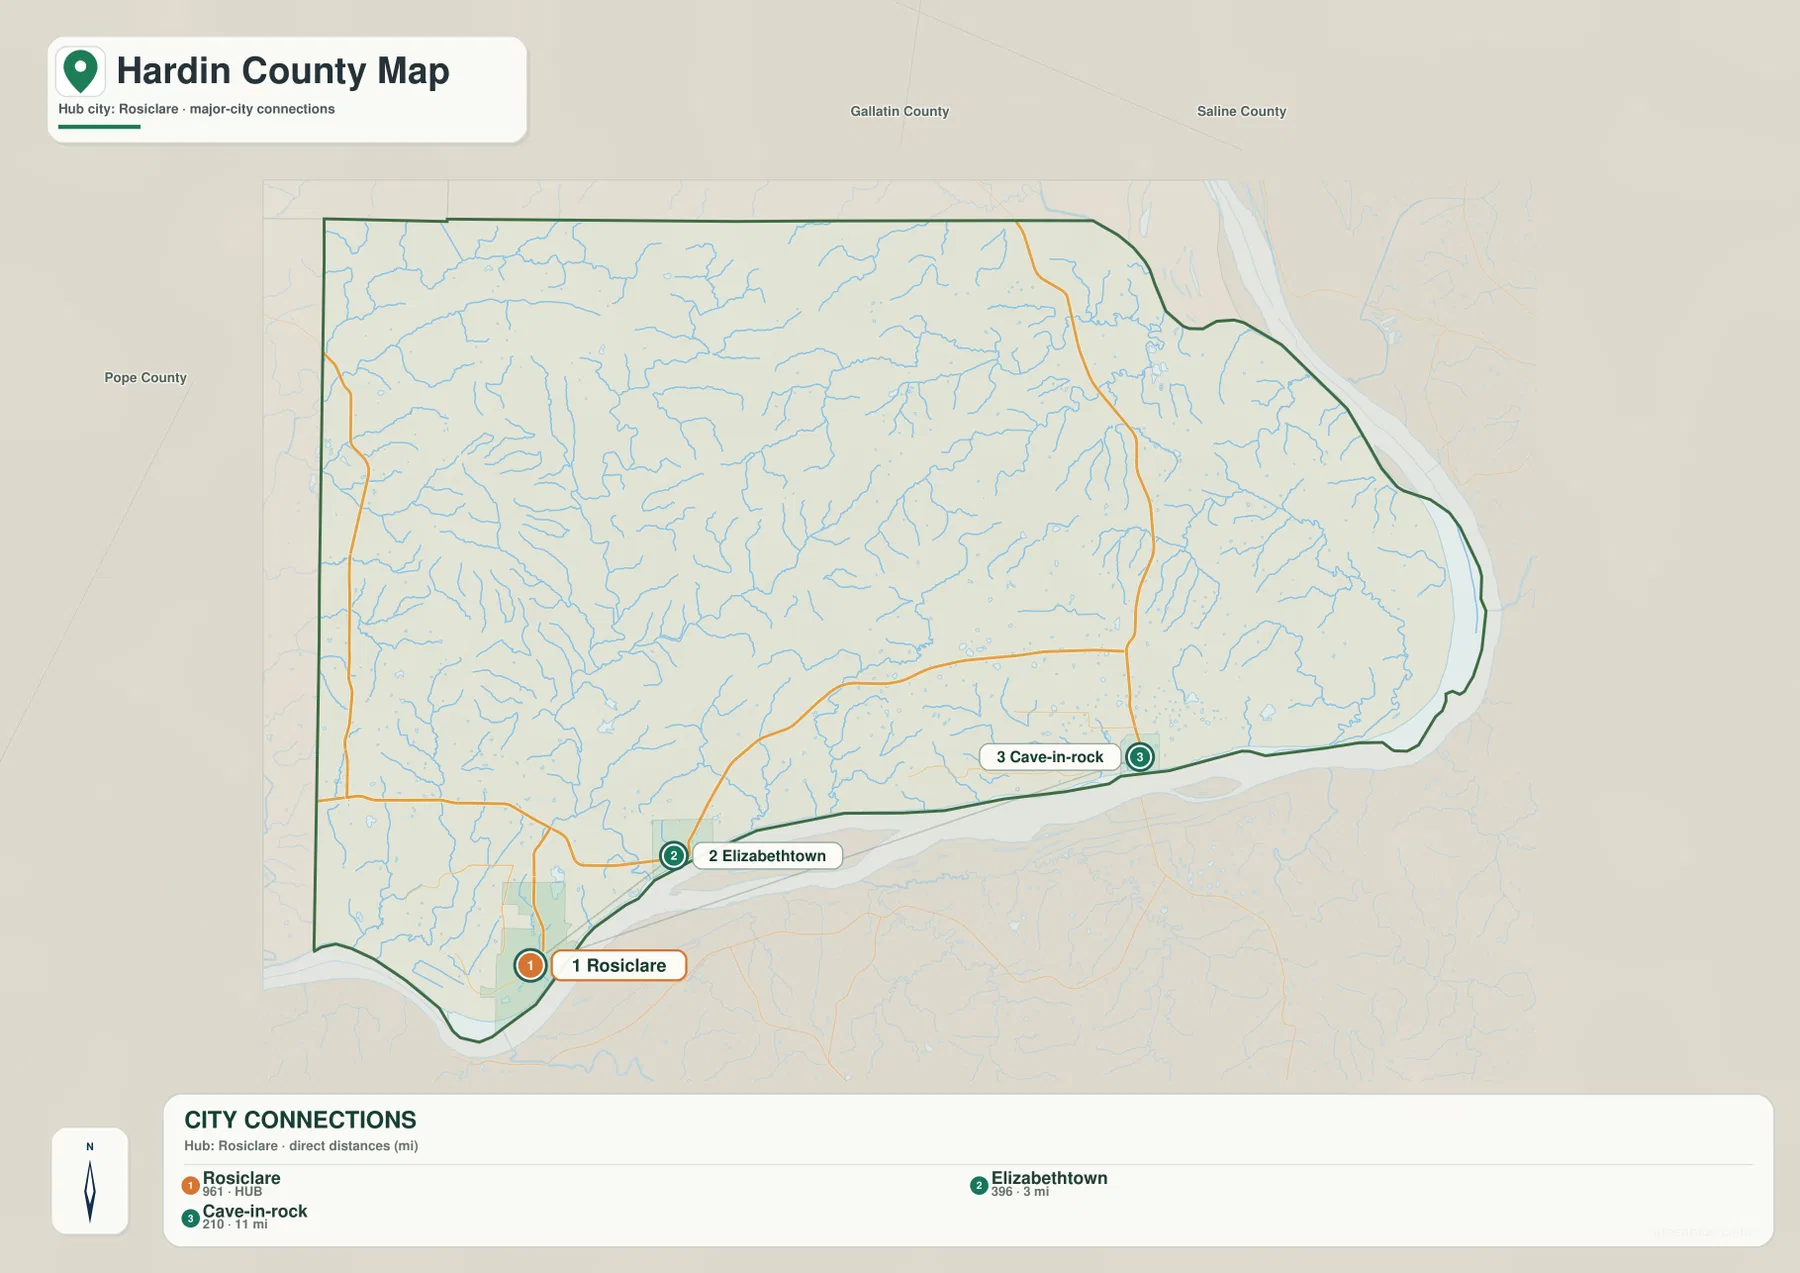
The surrounding labels add regional context without crowding the map. Pope County appears to the west, and Gallatin and Saline counties are labeled to the north. The Census Bureau county profile also identifies Kentucky counties across the Ohio River as neighbors, but the supplied city map keeps its emphasis on the Illinois side and on the three Hardin County points. That narrow focus is useful when the goal is to compare settlement spacing rather than to show every nearby town on both sides of the state line.
For classroom or presentation use, this view works best after the general county map. The general map provides the roads and river edge; the city view then reduces the scene to three points and their separation. That makes it easy to explain that Hardin County does not have a dense chain of similarly sized towns. Instead, the mapped communities form a simple west-to-east sequence along the southern Ohio River side of the county.
Creeks Cut the Interior between the Saline and Ohio Rivers
The terrain-and-water map changes the emphasis completely. The Ohio River forms the broad water boundary on the south and east, while the Saline River appears near the northeastern edge. Between those two large references, the interior is divided by many shorter creeks. Harris Creek and Rock Creek stand out in the northeast; Peters Creek runs through the south-central interior; Big Creek, Goose Creek, Pinhook Creek, and Rose Creek help organize the western half. Hamp Creek and Anthony Creek provide useful names close to the eastern river side.
The shaded relief behind the blue lines is just as important as the labels. Many streams occupy narrow valleys separated by ridges, so the drainage network looks branched rather than simple. In the west and center, several creeks descend through closely spaced folds in the terrain before reaching larger low areas. That pattern helps explain why the county map contains relatively few long, perfectly straight routes through the interior. Roads and settlements have to fit a landscape where slopes and creek crossings change over short distances.
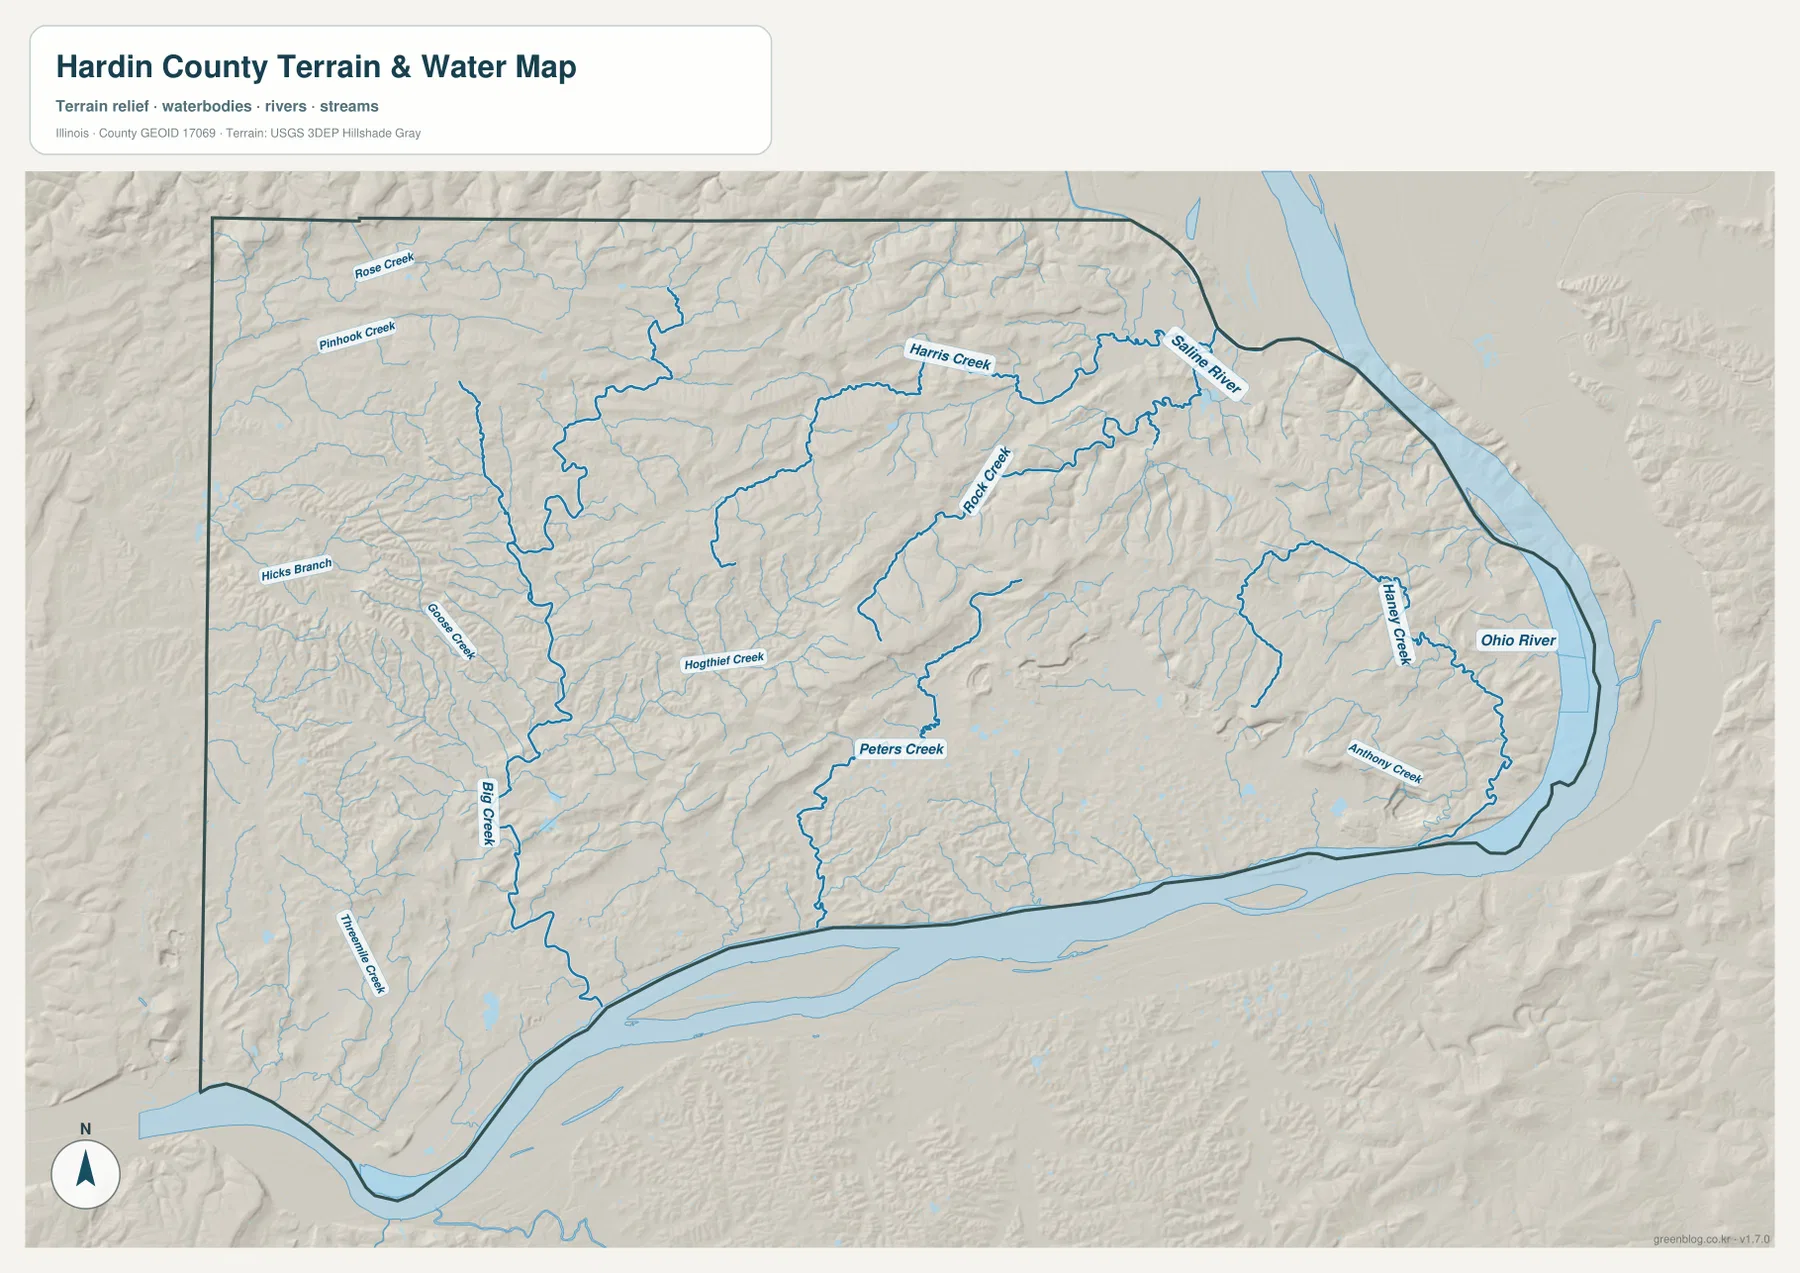
The river side and the interior should not be treated as the same landscape. Along the Ohio River, broad low areas and the river channel create a strong edge to the county. Move inland and the surface becomes much more broken, with creek valleys cutting between higher ground. Cave-in-Rock is a good eastern example because the river, bluffs, and short tributaries occur close together. Rosiclare and Elizabethtown also sit near the low river margin, while higher ground rises behind them.
This file is a location and terrain reference, not a flood or navigation product. It does not show flood probabilities, current river stages, safe boat routes, water quality, access rights, or parcel boundaries. For those questions, current agency data is required. The map is most useful for seeing where named waterways sit relative to the county outline and for comparing the river corridor with the creek-cut interior.
From 25 Meters at the River Margin to 270 Meters on the Ridges
The elevation map reports an actual range of about 25 to 270 meters and a mean near 145 meters. Those figures describe a much larger vertical spread than a quick glance at the county outline might suggest. The lowest green areas lie mainly along the Ohio River and other valley bottoms, while yellow, orange, and brown colors mark higher ridges across the north, northwest, and central interior. The eastern river bend also shows a narrow low strip backed by higher terrain.
The northwest contains a complicated set of ridges and valleys rather than one broad plateau. In the center, a darker high ridge stands out clearly and is bordered by lower drainage lines. The northeast repeats the same relationship at a smaller scale, with higher ground broken by stream valleys that descend toward the Saline and Ohio river system. This is why the water map and elevation map work so well together: creek names identify the valleys, while the color surface shows how much higher the ground rises between them.
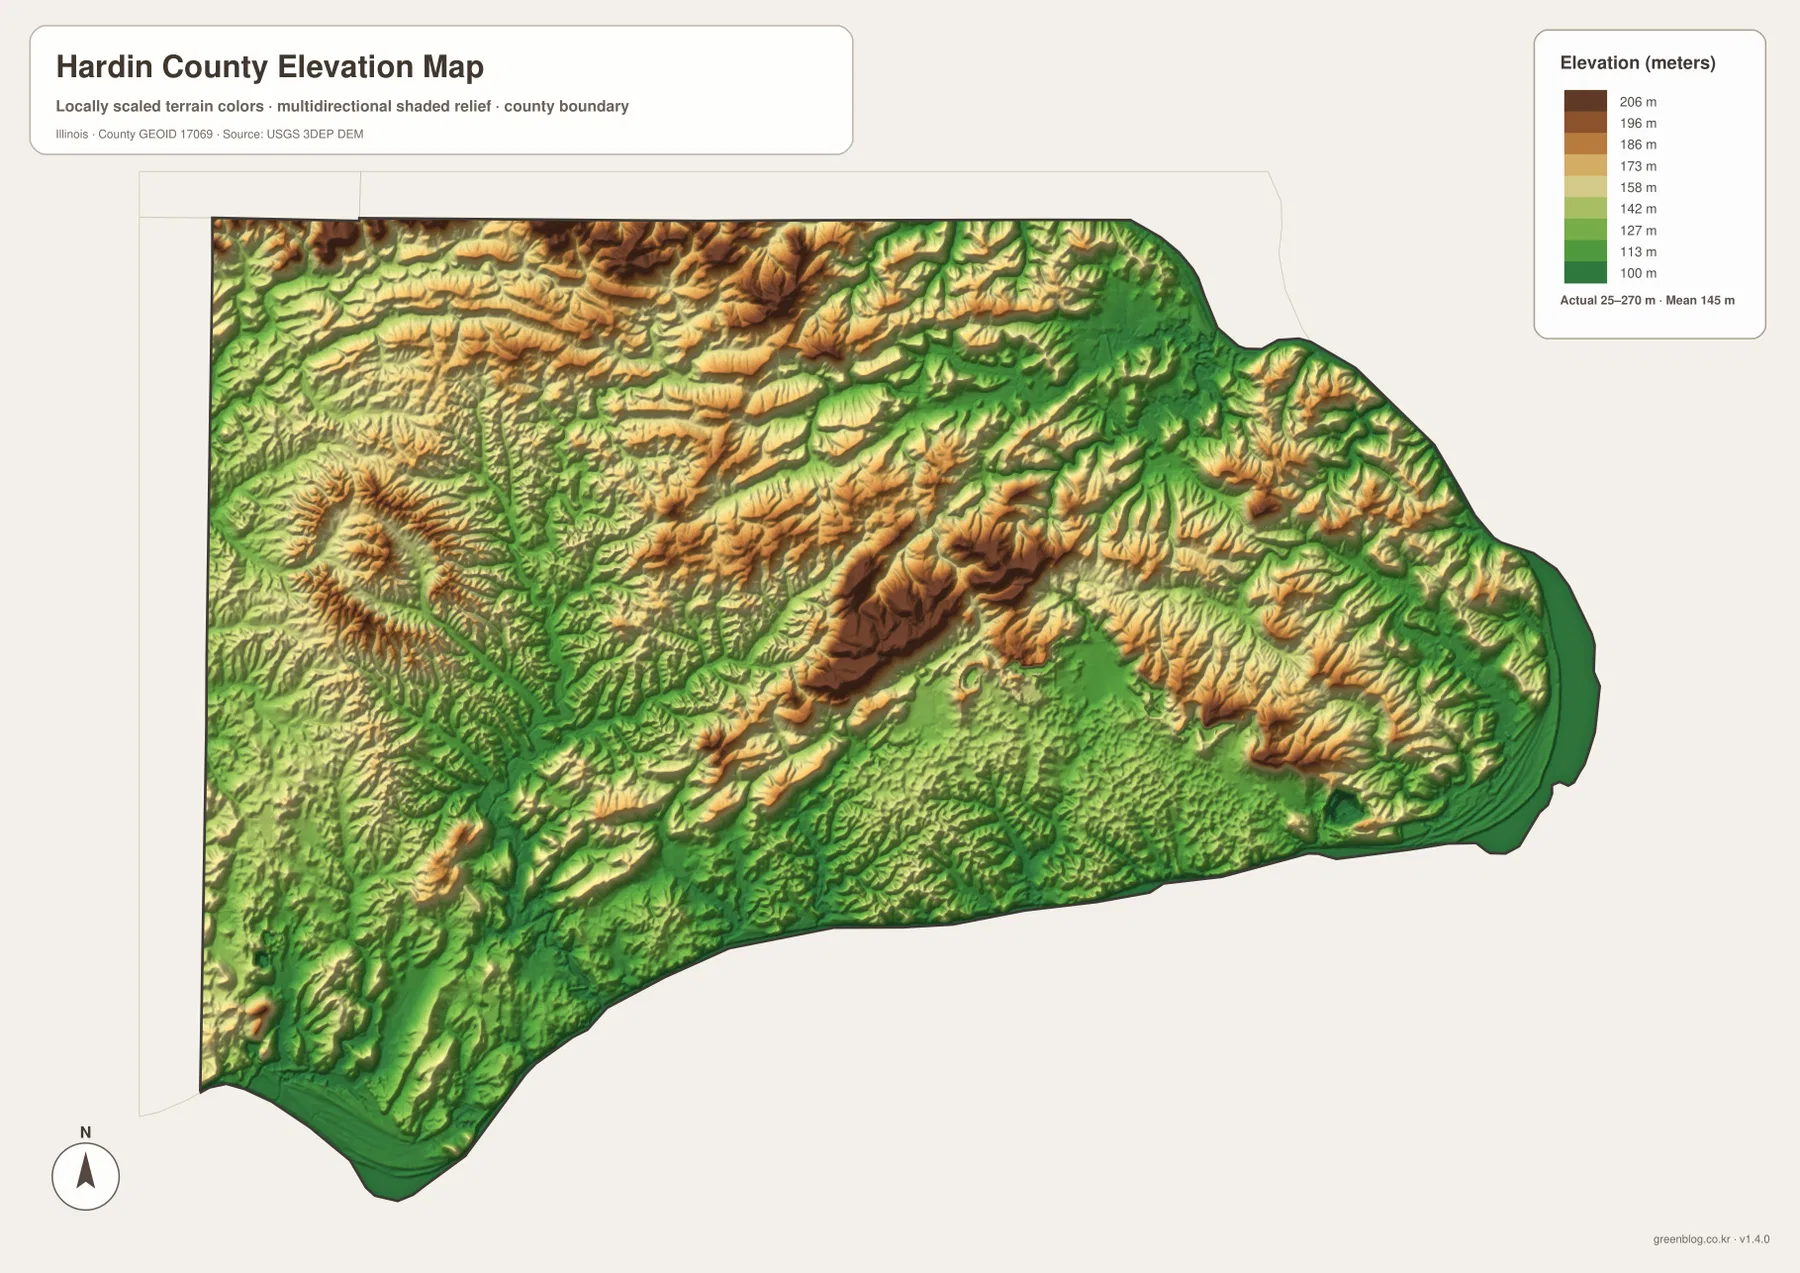
The southern communities make useful checkpoints on the elevation view even though their names are not printed on the shaded surface. Rosiclare, Elizabethtown, and Cave-in-Rock all sit near the Ohio River on the general map, so comparing the two images shows that they occupy the lower edge of a county with much steeper terrain immediately inland. This relationship is especially clear near Cave-in-Rock, where the IDNR description of river bluffs provides real-world context for the sharp rise shown by the relief colors.
The elevation image is not survey-grade. It is intended for county-scale comparison and does not provide precise spot elevations for buildings, roads, property corners, or engineering design. Anyone who needs exact measurements should use original USGS 3DEP data and professional survey information. For ordinary map reading, however, it is excellent for answering a simpler question: which parts of Hardin County are low river corridors, and which parts are higher ridges?
Choosing the Best File for Roads, Water, or Relief
If only one image is needed for a quick geographic reference, start with the general county map. It combines the county outline, Rosiclare, Elizabethtown, Cave-in-Rock, and the main road labels in one view. Use the city-connections map when the task is narrower: comparing the three mapped communities and their straight-line spacing from Rosiclare. This cleaner view is especially useful on a slide where small road labels would otherwise distract from the settlement pattern.
For natural features, the terrain-and-water map contains the richest set of labels. It is the better choice for the Ohio River, Saline River, Harris Creek, Rock Creek, Peters Creek, Big Creek, and the smaller tributaries. The elevation map is easier when the question is simply high versus low ground. Its color bands make the low river edge and higher interior ridges understandable even at a glance, while the water map is better for readers who want specific creek names.
The WebP previews are optimized for viewing in the article. The downloadable archive contains four original JPG maps at 3638 × 2572 pixels each: county, city, water, and elevation. Those files are more convenient for printing at larger sizes, enlarging creek labels, placing the maps into a report or lesson, or comparing Hardin County with nearby Illinois counties. They should still be treated as reference graphics rather than legal boundary, emergency management, navigation, or surveying products.
Frequently Asked Questions
Are the 3-mile and 11-mile city labels driving distances?
No. The supplied city-connections graphic labels them as direct distances from Rosiclare. Elizabethtown is shown about 3 miles away and Cave-in-Rock about 11 miles away in a straight line. Actual driving routes can be longer because roads follow the river margin and uneven terrain. Use a current road or navigation service for trip planning.
Why is Cave-in-Rock so close to the Ohio River on every map?
Cave-in-Rock is an Ohio River community on the eastern side of Hardin County. The Illinois Department of Natural Resources describes Cave-in-Rock State Park as a bluff-top site above the river, named for a large limestone cave carved by water. That setting explains why the settlement, river, steep relief, and short tributaries appear so closely related across the supplied maps.
Can the 25–270 meter elevation map be used for surveying or construction?
No. The elevation view is a generalized county-scale reference for comparing low river corridors with higher ridges. It does not provide survey-grade spot elevations, engineering tolerances, parcel measurements, or construction grades. Precise work should rely on original USGS elevation data, current local records, and professional field surveying.
Map File Information
The ZIP contains the Hardin County boundary-and-road map, city-connections map, terrain-and-water map, and elevation map as original high-resolution JPG files.
- Included Files: 4 JPG maps
- Printable Size: 3638 × 2572 pixels each
- Intended Use: Printing, education, presentations, and geographic reference
Related Maps
Sources and Reference Data
- U.S. Census Bureau QuickFacts – Hardin County, Illinois: county area, population, and current statistical context
- Illinois Department of Natural Resources – Cave-in-Rock State Park: official information about the Ohio River bluffs and cave setting
- USGS National Hydrography: authoritative water-feature reference information
- USGS 3D Elevation Program: original elevation data and documentation
- U.S. Census Bureau TIGER/Line Shapefiles: official geographic boundary reference files
Green Map creates custom-edited map images using open geographic data sources such as geoBoundaries, Natural Earth, OpenStreetMap, and government open data.
These maps are edited visual materials, not raw data files, and are provided for education, documents, presentations, and graphic reference.