The UNESCO Institute for Statistics indicator used here is not a reading score and it is not a percentage of children who can read. It records whether a nationally representative learning assessment in reading was administered at the end of primary education during the preceding five years, using 2025 as the reference year. The dataset is binary: a value of 1 denotes an administration recorded under this indicator, while 0 denotes that it was not recorded as administered under the same definition. That narrow definition matters because educational systems can run many other tests that do not meet this exact combination of subject, stage of schooling, national representativeness and reference period.
The verified table contains 236 national country-and-territory units, with 173 values of 1 and 63 values of 0. Calculated across the observed units, that is 73.3% recorded as administered and 26.7% recorded as not administered. These percentages summarize the distribution of the binary status in the dataset; they do not measure student achievement. A country in the first group is not necessarily a high-performing education system, and a country in the second group is not necessarily without any learning assessment. The indicator answers a much more specific institutional question: whether this particular kind of reading assessment was administered within the defined period.
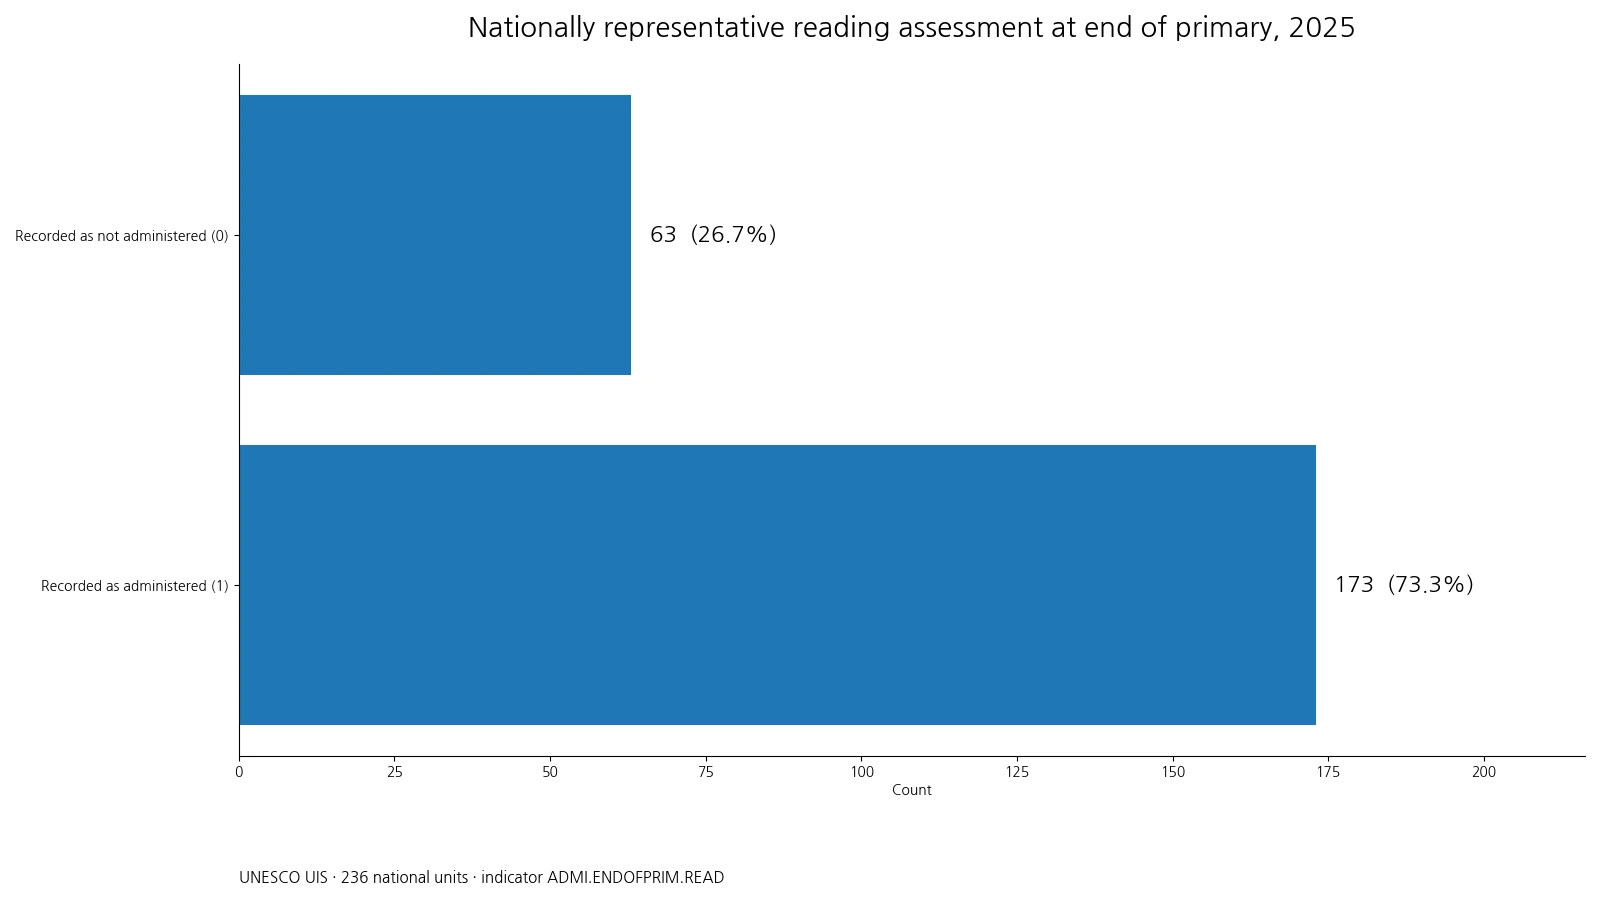
Table of Contents
The broad pattern in 2025
The most immediate pattern is that the administered status is common but not universal. Nearly three quarters of the 236 observed units are coded 1, while more than sixty are coded 0. This makes the measure useful as a quick picture of the reach of national learning-assessment systems, but it also shows why it should not be treated as a routine that exists everywhere on the same schedule. The zero group is large enough that differences in assessment cycles, institutional capacity and reporting arrangements remain relevant to any cross-country comparison.
The 1 group is geographically diverse. The source includes countries such as Australia, Brazil, Canada, Chile, Colombia, Egypt, Finland, France, Ghana, India, Indonesia, Italy and Japan, among many others. The 0 group is also diverse and includes Afghanistan, Armenia, Belarus, China, Switzerland, Iraq, Kuwait, Mongolia, Romania, Sudan, Tunisia and Yemen, as well as a number of territories and small jurisdictions. Because both statuses appear across very different settings, it would be unsafe to attribute the pattern to a single income level, region or policy model from this dataset alone.
How to read a binary education indicator
A binary indicator is easy to display but easy to overinterpret. There is no ranking within the value 1 group and no ranking within the value 0 group. A value of 1 does not tell us whether an assessment was stronger, more frequent or more technically sophisticated than another assessment coded 1. Likewise, 0 does not tell us how close a system was to meeting the definition. The distinction is categorical rather than continuous. For questions about student learning, researchers need separate outcome measures such as average scale scores or the proportion of students reaching a minimum proficiency level.
The five-year reference window is another important detail. The 2025 status does not mean that the assessment necessarily took place in 2025. It means the administration condition was satisfied during the preceding five years as defined for this indicator. A system that administered a qualifying assessment earlier than that window may appear as 0, while another system that administered one once within the window may appear as 1. The indicator therefore works best as a recent-status flag, not as a measure of assessment frequency.
| Value | Meaning in this dataset | Count | Share |
|---|---|---|---|
| 1 | Qualifying assessment recorded as administered within the reference window | 173 | 73.3% |
| 0 | Not recorded as administered under the same indicator definition | 63 | 26.7% |
Why national learning assessments matter
Enrollment and completion statistics describe access to schooling, but they do not by themselves show what students learned. Nationally representative assessments create a way to estimate learning outcomes for a defined student population, monitor disparities, and provide evidence for curriculum or instructional decisions. The end of primary education is especially important because foundational reading is expected to support learning across later subjects. A system that can measure reading at this transition point gains information that administrative counts alone cannot provide.
Assessment administration, however, is only one part of a learning-measurement system. Sampling quality, test design, participation, comparability over time, data processing and publication all affect the value of the results. Policy use matters as well. A technically sound assessment can have limited impact if findings are not translated into curriculum review, teacher support or targeted interventions. For that reason, the 1/0 status should be understood as evidence that a measurement event meeting the indicator definition occurred, not as a final grade for the education system.
Coverage and missing-data discipline
The source metadata distinguishes explicit zeros from absent catalogue units. The 63 zeros in this analysis are official source values, not missing entries that were filled with zero. That distinction is essential. Treating an absent geography as a zero would create a false claim that the assessment was not administered. The verified national response contains 236 observed rows and no missing values in the included table, while several catalogue units not reported in this response remain outside the denominator rather than being imputed.
The geographic scope also requires careful wording. The 236 observations should not be described as 236 sovereign states. UNESCO national-level data can include countries, territories and other reporting units. For that reason, this article uses “countries and territories” or “national units” when discussing the denominator. Readers comparing these counts with another international dataset should first check whether the geographic universe is the same.
What the country examples do and do not show
Selected examples help make the two statuses concrete, but they are not a league table. Australia, Brazil, Canada, Chile, Colombia, Egypt, Finland, France, Ghana, India, Indonesia and Japan are examples coded 1. Afghanistan, Armenia, Belarus, China, Switzerland, Iraq, Kuwait, Mongolia, Romania, Sudan, Tunisia and Yemen are examples coded 0. The presence of very different countries on both sides is a reminder that this variable captures a specific recent assessment event rather than a broad measure of educational development.
A useful next step for any particular country is to identify the assessment program itself: its administration year, target grade or age, sample design, reporting scale and whether results are comparable with earlier cycles. Those details can explain why countries sharing the same binary code may still have very different measurement systems. They also help avoid confusing participation in an international study with a national assessment, or confusing an assessment at another stage of education with the end-of-primary reading measure used here.
| Examples coded 1 | Examples coded 0 |
|---|---|
| Australia | Afghanistan |
| Brazil | Armenia |
| Canada | Belarus |
| Chile | China |
| Colombia | Switzerland |
| Egypt | Iraq |
| Finland | Kuwait |
| France | Mongolia |
| Ghana | Romania |
| India | Sudan |
| Indonesia | Tunisia |
| Japan | Yemen |
How to combine this indicator with learning outcomes
The binary status becomes more informative when paired with outcome data. One obvious companion is the share of children achieving minimum proficiency in reading. Another is primary completion, which indicates how many students reach the stage at which end-of-primary learning can be assessed. Teacher indicators, education spending and pupil-teacher ratios can add information about inputs, while repeated assessment cycles make it possible to study changes over time. Each of these measures answers a different question, so keeping their meanings separate is more useful than compressing them into a single ranking.
Researchers can also use the indicator as a data-quality filter. If a country lacks a qualifying assessment in the relevant period, directly comparable learning outcomes may be unavailable or older. That does not mean the system lacks all evidence, but it signals that extra work may be needed to understand the source, date and representativeness of available learning data. Conversely, a value of 1 can point analysts toward a recent assessment whose results may support deeper work on proficiency, inequality or regional gaps.
Limits of the 2025 snapshot
This dataset has several limitations that should remain visible in interpretation. It does not identify the exact administration year within the preceding five-year window. It does not describe the test instrument, the number of participating students, reliability, score scale or publication quality. It does not say whether every child took the assessment; nationally representative surveys normally rely on sampling. It also does not establish whether countries used comparable tests. The indicator is about administration under a common definition, not a common achievement scale.
The snapshot is also unsuitable for causal claims. It cannot show that administering assessments improves reading outcomes, nor can it explain why a country is coded 0. Institutional capacity, policy priorities, disruptions, timing and reporting practices may all matter, but those explanations require additional evidence. The safest interpretation is descriptive: in the verified 2025 table, a qualifying reading assessment at the end of primary was recorded as administered for 173 national units and not recorded as administered for 63.
Source and calculation
The underlying source is the UNESCO Institute for Statistics public data API for indicator ADMI.ENDOFPRIM.READ, reference year 2025. The verified file contains 236 rows with country or territory name, three-letter code, year and binary value. The counts in this article are direct tallies of the source values: 173 rows equal 1 and 63 rows equal 0. The displayed shares, 73.3% and 26.7%, are calculated by dividing those counts by 236. No source value was converted into a performance percentage and no missing geography was recoded as zero.
For readers using the data in further analysis, the key is to preserve the observation contract. Keep 0 separate from missing, retain the 2025 reference year, and remember that the indicator refers to administration during the preceding five years. If a map is built with an external boundary file, unmatched geographies should remain no-data rather than being forced into the zero category. Those simple practices prevent the most common distortion of a binary status dataset.
What this snapshot tells us
The 2025 UIS snapshot shows that nationally representative reading assessment at the end of primary was recorded as administered for 173 of 236 observed national units, or about 73.3% of the dataset. The remaining 63 units were coded 0 under the same definition. The result suggests that this form of learning measurement is widespread, while also leaving a substantial group outside the administered category in the reference window.
Its best use is therefore diagnostic rather than evaluative. It helps identify where recent nationally representative reading assessment evidence should exist and where analysts may need to investigate other sources or older cycles. To judge learning quality itself, the next step is to examine the assessment results and related proficiency indicators rather than treating this 1/0 status as a score.
Frequently Asked Questions
What do 1 and 0 mean in this indicator?
A value of 1 means a nationally representative end-of-primary reading assessment was recorded as administered during the defined five-year reference window. A value of 0 means it was not recorded as administered under that definition. Neither value is a student performance score.
Does the 2025 value mean the test was given in 2025?
Not necessarily. The indicator refers to administration during the preceding five years, using 2025 as the reference year. The exact assessment year requires additional source information.
Does a value of 0 mean the country has no education assessments?
No. A system may have assessments in another subject, grade, design or period. Zero applies only to this specific UIS definition.
Related Articles
Green Map creates custom-edited map images using open geographic data sources such as geoBoundaries, Natural Earth, OpenStreetMap, and government open data. These maps are edited visual materials, not raw data files, and are provided for education, documents, presentations, and graphic reference.