There are two different ways to describe the international migrant population of a country: the number of migrants and their share of the total population. World Bank indicator SM.POP.TOTL.ZS measures the second concept. World Bank metadata defines the international migrant stock primarily as people living in a country other than the one in which they were born, including refugees. Where foreign-born data are unavailable, foreign-citizen data can be used as a basis for estimation.
This comparison uses 216 country and area observations for 2024. Because every row has the same reference year, there is no mixed-year comparability problem in this extract. The percentage still requires care, however. A small state or territory can have a very high migrant share with a relatively modest absolute number of migrants, while a very populous country can host millions of migrants and still record a low percentage.
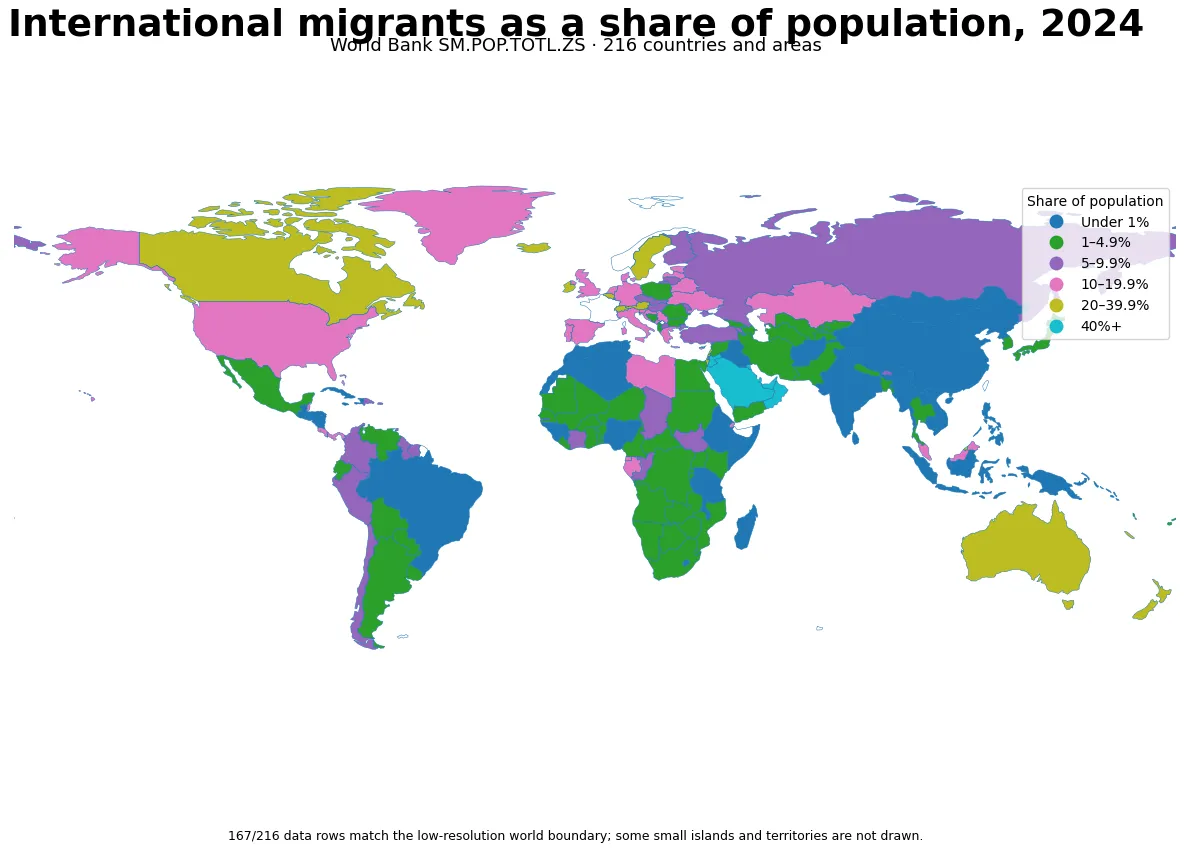
Table of Contents
What the international migrant share measures
The numerator is the international migrant stock: people residing in a country other than their country of birth under the main definition used for the series. The denominator is the country’s total population. A value of 20% therefore means that roughly one person in five in the resident population is counted in the international migrant stock. It is a stock measure at a point in time, not the number of people who entered during the year.
The measure should not automatically be read as the share of foreign citizens. Citizenship and country of birth are different concepts. A naturalized citizen can still be foreign-born and therefore included in a birthplace-based migrant-stock estimate. In countries without adequate foreign-born data, foreign-nationality information may be used instead, which is one reason why country comparisons should be interpreted with the metadata in mind.
The median across 216 observations is 5.6%
The median 2024 value is 5.6%, while the simple unweighted mean is 13.42%. The 25th percentile is 1.6% and the 75th percentile is 16.3%. The mean is more than twice the median because the upper tail contains a substantial group of countries and territories with migrant shares between 40% and more than 70%.
| 2024 migrant share | Countries and areas | Share of 216 |
|---|---|---|
| Under 1% | 40 | 18.5% |
| 1 to <5% | 65 | 30.1% |
| 5 to <10% | 27 | 12.5% |
| 10 to <20% | 39 | 18.1% |
| 20 to <40% | 19 | 8.8% |
| 40% or higher | 26 | 12.0% |
Just under half of the observations, 105 countries and areas, are below 5%. Eighty-four are at or above 10%, 45 are at or above 20%, and 26 are at or above 40%. These are country counts, not shares of the world’s population. A global migrant percentage requires population weighting rather than a simple average of country percentages.
Qatar and the United Arab Emirates exceed 70%
| Country or area | International migrant share |
|---|---|
| Qatar | 76.7% |
| United Arab Emirates | 74.0% |
| Monaco | 70.2% |
| Sint Maarten (Dutch part) | 69.5% |
| Liechtenstein | 69.4% |
| Aruba | 68.0% |
| Kuwait | 67.3% |
| Virgin Islands (U.S.) | 66.9% |
| British Virgin Islands | 62.1% |
| Turks and Caicos Islands | 61.1% |
| Macao SAR, China | 59.3% |
| Andorra | 59.1% |
| Bahrain | 52.3% |
| Isle of Man | 51.9% |
| Luxembourg | 51.2% |
Qatar has the highest 2024 share in the extract at 76.7%, followed by the United Arab Emirates at 74.0%. Monaco, Sint Maarten, Liechtenstein, Aruba, and Kuwait are all above 67%. The upper end contains both Gulf economies and a large number of small European states and island territories. Labor-market structure, a small citizen or native-born population base, and cross-border mobility may be relevant to individual cases, but this percentage alone cannot establish why a country has a high migrant share.
Population size is especially important for interpreting the top of the table. A territory with 100,000 residents and a migrant share of 60% would contain about 60,000 migrants, while a country of 50 million people with a 10% share would contain about five million. The country with the highest percentage is therefore not necessarily the country with the largest international migrant population.
How to interpret values near zero
| Country or area | International migrant share |
|---|---|
| Cuba | 0.0% |
| St. Martin (French part) | 0.0% |
| China | 0.1% |
| Madagascar | 0.1% |
| Myanmar | 0.1% |
| Philippines | 0.1% |
| Afghanistan | 0.2% |
| Haiti | 0.2% |
| Indonesia | 0.2% |
| Sri Lanka | 0.2% |
| India | 0.3% |
| Viet Nam | 0.3% |
The lowest displayed values range from 0.0% to a few tenths of a percent. A displayed 0.0% should not be expanded into a claim that literally no international migrants live there. The published figure is displayed at one decimal place, so very small shares can appear as zero after rounding, and the series itself is estimated from census, register, survey, and modelling inputs.
A low percentage can also coexist with a large absolute migrant population when the denominator is very large. This is why the percentage series should be paired with the World Bank’s international migrant stock, total indicator whenever the question is about the number of people rather than the composition of the resident population.
A high share is not the same as fast immigration growth
A migrant share of 50% does not mean the migrant population grew by 50% during 2024. The indicator is a cross-sectional stock ratio. Measuring recent change requires comparing migrant stock across years or using migration-flow data where available. A country can have a high share that has been stable for years, while another country can have a much lower share that is rising rapidly.
The denominator matters over time as well. Even if the number of migrants is unchanged, the percentage can rise when the total population falls. Conversely, the migrant stock can increase while its population share changes little if the total population grows at a similar or faster rate. Trend analysis should therefore examine both migrant stock and total population.
International migrant stock is not the same as refugee stock
World Bank metadata states that refugees are included in the international migrant stock, but the two concepts are not interchangeable. The international migrant stock also includes people who moved for work, family, education, and other reasons, while refugees form a distinct protection category under international law. Questions about refugee populations or asylum applications require dedicated refugee and asylum indicators.
This distinction prevents overinterpreting the high-share economies. A high international migrant share does not, by itself, show that an economy hosts a large refugee population or that one particular migration policy explains its demographic structure. The direct information in this indicator is the migrant share of the resident population.
Small states and territories shape the upper tail
The map highlights high migrant shares in Gulf economies, several European microstates, and a number of Caribbean and other island territories. Geographic area, however, is not population size. A large polygon on a world map does not represent more migrants, and many very small territories with high shares are barely visible at global scale.
Of the 216 statistical rows, 167 match the low-resolution world boundary used for the map. Most unmatched rows are small islands, territories, or separately reported areas without a one-to-one polygon in this simplified geometry. All 216 rows remain in the statistical calculations, and unmatched places are not filled with zero.
A below-median share can still represent many people
One peer example is the Republic of Korea, where the 2024 migrant share is 3.5%. That sits below the 216-observation median of 5.6% and within the 1-to-below-5% band. The percentage alone does not indicate the absolute migrant population or the pace of recent migration, so the total stock and a multi-year series are needed for those questions.
Useful indicators to pair with this one
- International migrant stock, total shows the absolute number of migrants rather than their population share.
- Total population provides the denominator needed to translate a percentage into an approximate number of people.
- Population growth helps show how migration interacts with broader demographic change.
- Urbanization and population density can add spatial context to where people live and settle.
- Refugee and asylum indicators separate forced-displacement populations from the broader international migrant stock.
The World Bank SM.POP.TOTL.ZS indicator page provides the time series, while the World Development Indicators metadata explains the definition and estimation approach. The underlying source is the United Nations Population Division’s International Migrant Stock series.
Summary
International migrants account for very different shares of national populations in the 2024 data, ranging from values near zero to more than 70%. The median across 216 countries and areas is 5.6%, while Qatar and the United Arab Emirates exceed 70%. The upper end contains many Gulf economies, microstates, and island territories, making population size essential context. This indicator measures the composition of the resident population at a point in time; it is not a measure of annual immigration, migrant-population growth, refugee prevalence, or the absolute number of migrants.
Frequently Asked Questions
Does a high international migrant share mean immigration rose quickly in 2024?
No. The indicator is a stock share at a point in time. Measuring recent growth requires comparing migrant stock across years or using migration-flow data.
Is the international migrant share the same as the share of foreign citizens?
Not exactly. The series primarily uses country of birth, although foreign-nationality data can be used where foreign-born data are unavailable.
Does the country with the highest migrant share also have the most migrants?
Not necessarily. A small country can have a very high percentage with a modest migrant count, while a populous country can have a lower percentage but millions of migrants.
Related Articles
Green Map creates custom-edited map images using open geographic data sources such as geoBoundaries, Natural Earth, OpenStreetMap, and government open data.
These maps are edited visual materials, not raw data files, and are provided for education, documents, presentations, and graphic reference.