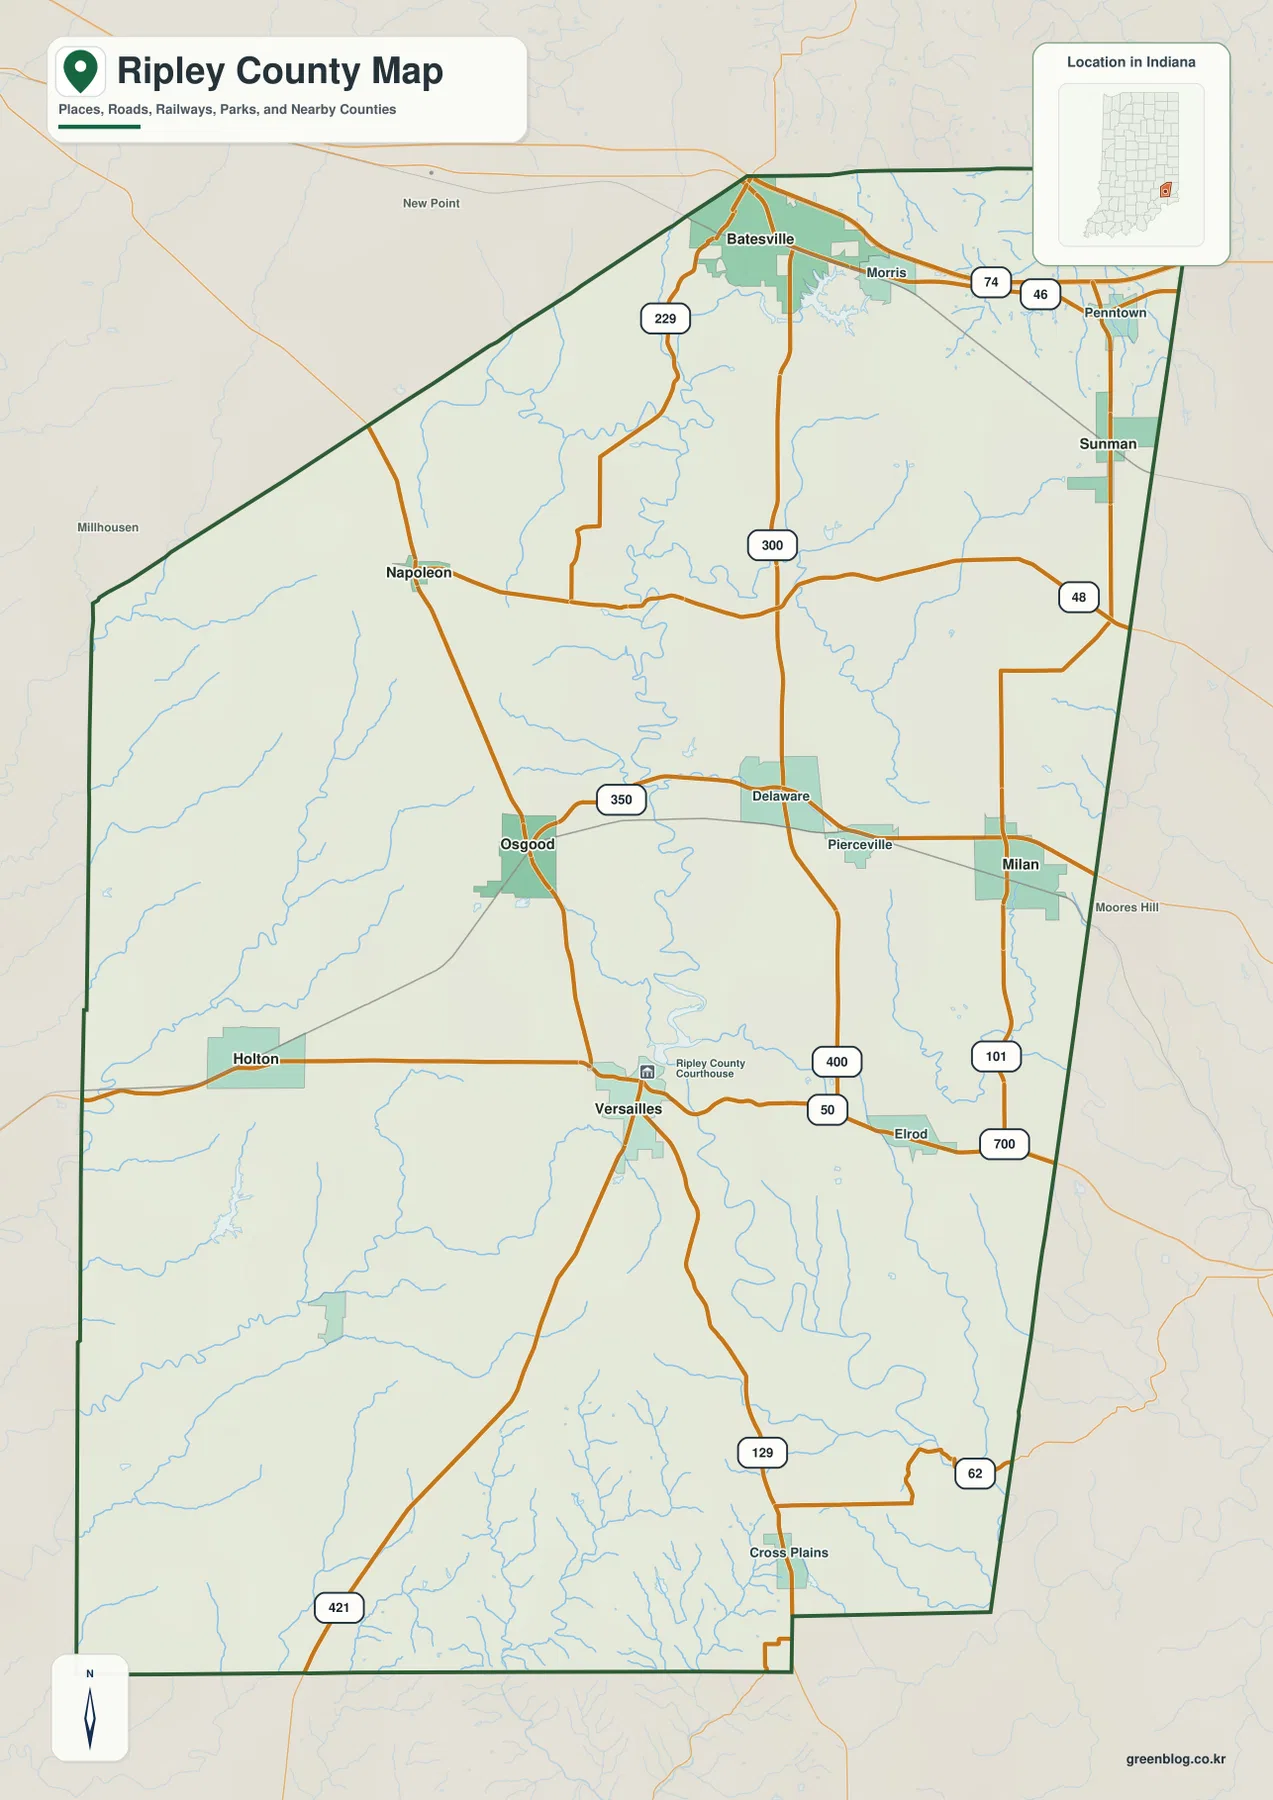
Route 50 gives Ripley County one of its clearest road references, crossing the Versailles area while the rest of the county spreads outward toward Batesville in the north, Milan and Sunman in the east, and Osgood and Holton in the west. The natural landscape is less orderly. Laughery Creek bends through a deep central valley, three separately named reservoirs cluster in the northern interior, and smaller creeks cut narrow passages through the eastern and western hills. This Ripley County Indiana Map page is built around those county-specific features. The original general, city, terrain-and-water, and elevation maps are also available as 2572×3638 high-resolution JPG files in a single downloadable ZIP, so the full-size versions can be used when the browser previews are too small for route or stream labels.
Two places make particularly useful anchors. Versailles is slightly south of the county center, marked with the Ripley County Courthouse and crossed by Route 50. Batesville sits much closer to the northern boundary near Route 229 and the roads marked 74 and 46. Between those two points, the maps show repeated ridges and creek valleys rather than one broad flat surface. That difference becomes especially clear when Laughery Creek is traced on the water map and then found again as a dark green low corridor on the elevation map.
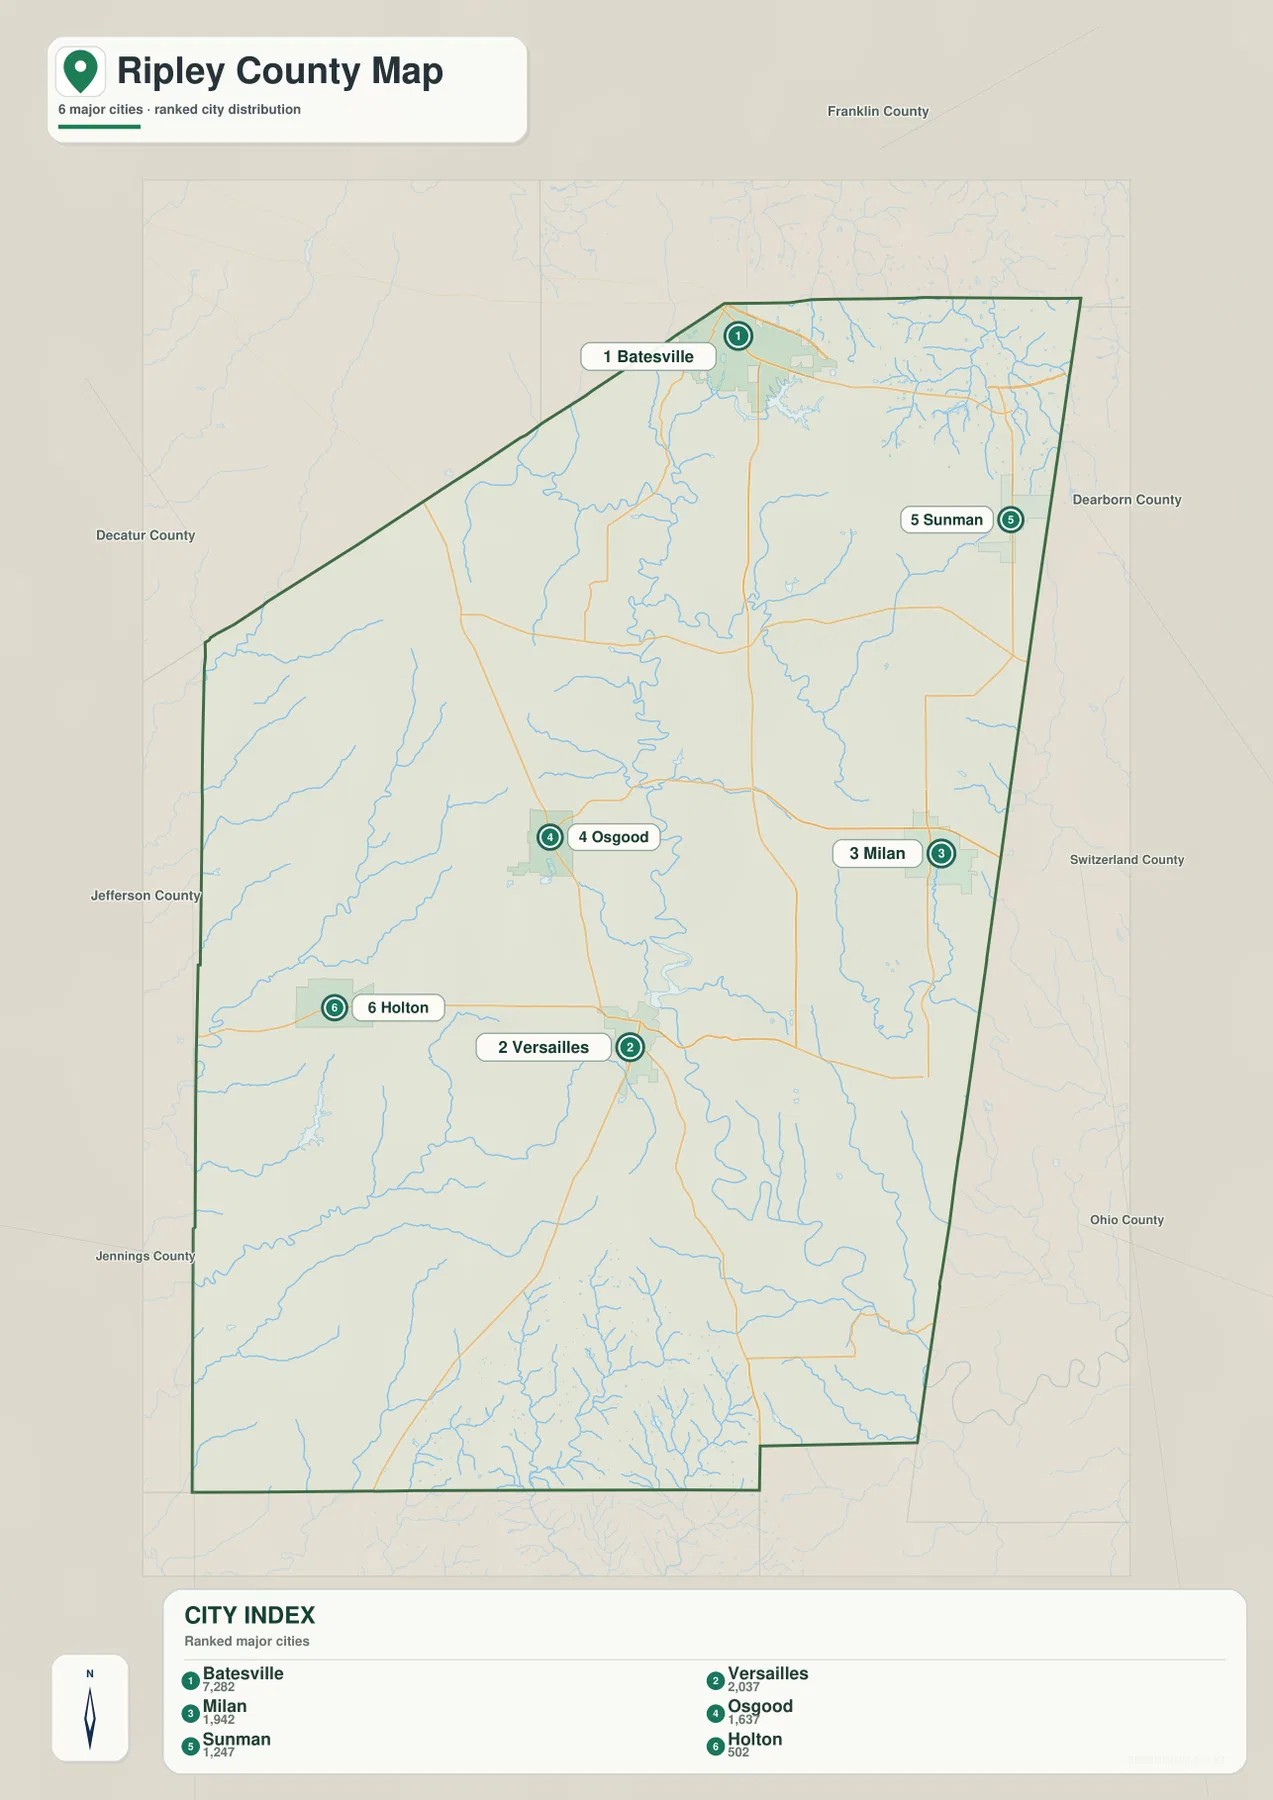
The four supplied images are easier to use when the question changes from one topic to another. The general county view is the best place to combine town names, numbered roads, and the boundary. The city view simplifies the six highlighted places. The terrain-and-water map identifies Laughery Creek, Ripley Creek, Otter and Graham creek systems, and the three northern reservoirs. The elevation map then shows an actual county range of about 180 to 324 meters, with a mean of 268 meters. The sections below follow those real Ripley County features rather than repeating a fixed map-by-map template.
Table of Contents
Batesville overlooks a northern zone of small reservoirs, creeks, and higher ground
Batesville is the most obvious northern settlement on the maps. It lies close to the county boundary, with Route 229 nearby and the road labels 74 and 46 providing east–west reference lines. Moving south from Batesville, the road map becomes increasingly crossed by small blue drainage lines. The water map explains that density more clearly by naming three separate reservoirs—Oser Reservoir, Bischoff Reservoir, and Mollenkramer Reservoir—within the same broad northern interior.
The three reservoirs are not shown as one connected lake. Each has its own name, and short streams occupy the surrounding terrain. That matters because the northern part of Ripley County might otherwise look like a simple road-and-town area on the general map. The physical maps show a more broken landscape, with small water bodies and narrow valleys interrupting the upland surface. The reservoirs are therefore useful landmarks for identifying the northern interior even though Laughery Creek remains the larger countywide water feature.
East of Batesville, Sunman occupies the northeastern side, while Milan lies farther south near Route 101. The two towns should not be treated as one east-side corridor at the same latitude. Sunman is clearly farther north, and the road marked 48 crosses the eastern side below it. This stepped arrangement of Batesville, Sunman, and Milan helps explain why the northeast has several different road and creek directions instead of one simple north–south pattern.
The elevation map adds another distinction. Much of the Batesville–Sunman side contains orange and brown uplands, but narrow lower valleys cut repeatedly through that high ground. The northern reservoirs sit within this dissected terrain rather than on one broad flat lowland. The contrast between high ridges and narrow drainage cuts becomes more pronounced farther south, where the Laughery Creek valley develops into the county’s most recognizable low corridor.
Versailles turns Route 50 into the easiest road reference for the county interior
Versailles is the practical center of the general road map. The Ripley County Courthouse label makes the town easy to locate, and Route 50 passes through the area on a broad west–east course. From there, the map opens toward Holton on the west side and toward Elrod and the Milan side to the east. Osgood lies northwest of Versailles, so locating those four places—Versailles, Osgood, Holton, and Milan—organizes much of the middle and southern part of the county before smaller routes are considered.
Western Ripley County has two different reference towns rather than a single one. Osgood sits northwest of Versailles and below the sloping northwestern boundary near Napoleon. Holton lies much farther south. Route 421 leaves the county through the southwest, while Route 129 runs south from the Versailles area toward Cross Plains. Those roads show that the western and south-central exits are not interchangeable; they serve different parts of the county and diverge as they approach the boundary.
Milan and Sunman perform a similar two-level role on the eastern side. Milan is closer to the central band and Route 101, whereas Sunman lies farther north. Surrounding county labels help place those towns in a broader setting. Dearborn County is shown along the northeastern and eastern side, Switzerland County farther down the east, Ohio County near the southeast, Jefferson County on the west, Jennings County to the southwest, Decatur County to the northwest, and Franklin County to the north. These labels are useful for recognizing how close some Ripley County towns lie to the county edge.
The CITY INDEX prints numeric values beside Batesville, Versailles, Milan, Osgood, Sunman, and Holton, but the supplied package does not identify the year or source for those numbers. They should therefore not be treated as current official population in this article. The dependable information is the mapped position of the six places: Batesville north, Versailles south-central, Milan and Sunman east, and Osgood and Holton west at different north–south positions.
Laughery Creek forms the central low corridor while other valleys split the western and southern hills
Laughery Creek is the dominant named water feature on the terrain-and-water map. Its course develops broad bends in the northern interior, crosses the middle of the county, and then turns through the southeastern half. Ripley Creek approaches the system from the east, while numerous shorter tributaries enter from surrounding hills. On the general road map these blue lines can blend into the road network, but the water map makes the main creek and its tributary setting much easier to follow.
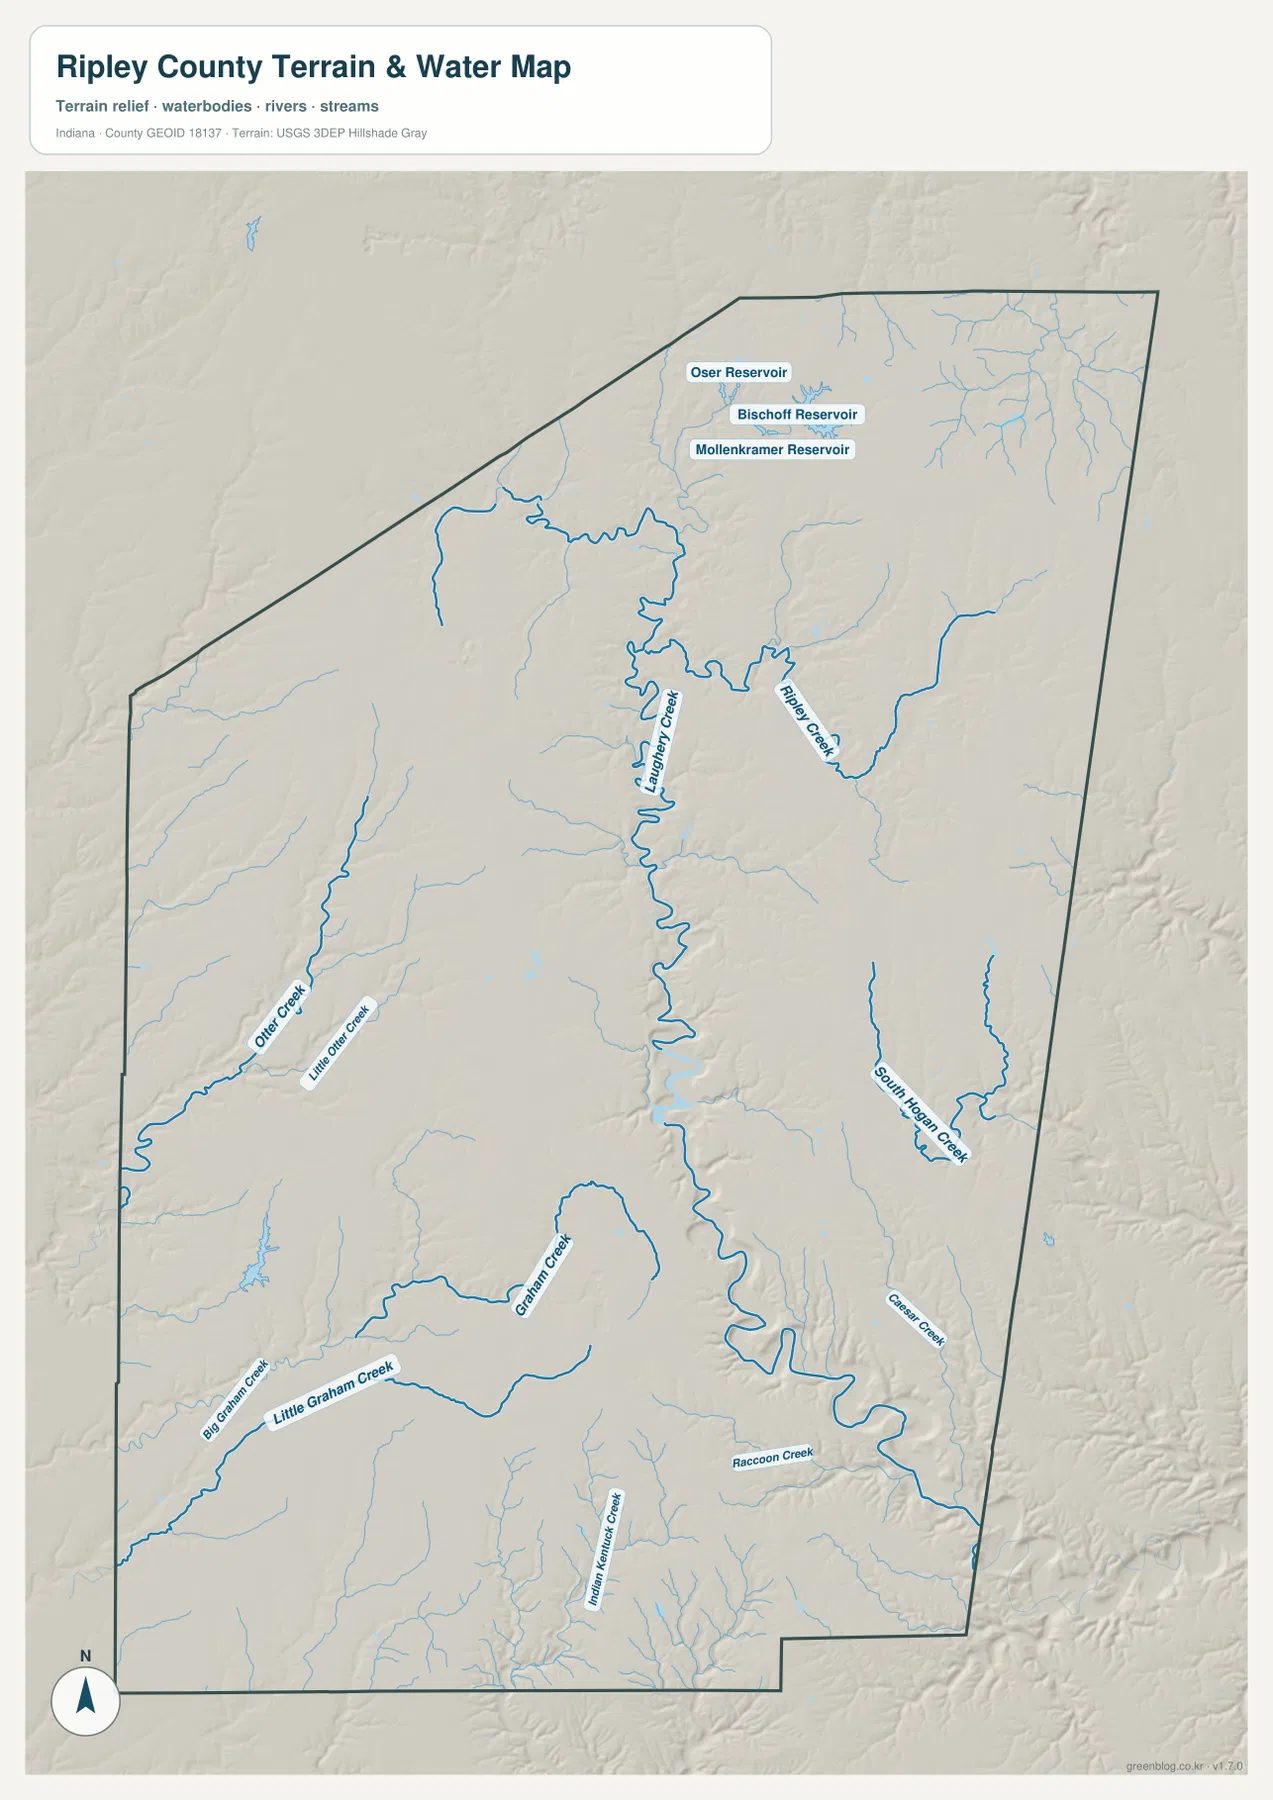
The west has its own set of valleys. Otter Creek and Little Otter Creek are labeled in the western half, with Graham Creek and Little Graham Creek farther south. Indian-Kentuck Creek appears across the southern interior. These waterways are not simply short branches attached to one identical drainage line; they occupy separate parts of the western and southern uplands. That is why the terrain map looks heavily dissected even away from the main Laughery Creek corridor.
On the eastern and southeastern side, South Hogan Creek, Raccoon Creek, and Caesar Creek are among the named streams. Their valleys cut through terrain that is often higher than the central creek floor. Looking at the water map first makes it easier to recognize the same narrow low passages on the elevation image. In several places, a stream occupies a green or yellow strip while nearby ridges rise into orange and brown shades over a short distance.
The terrain-and-water image is a county-scale reference rather than a flood, parcel, legal-boundary, drainage-engineering, or navigation product. It is appropriate for locating the three named reservoirs, following Laughery Creek, and distinguishing western and eastern creek systems. Current flood conditions or site-specific drainage questions require dedicated agency information. For ordinary geographic use, the supplied map clearly shows that Ripley County is divided by several valley systems rather than drained by one simple straight channel.
A 180–324 meter range makes the Laughery Creek valley stand out against the eastern uplands
The elevation legend reports an actual Ripley County range of roughly 180 to 324 meters and a mean of 268 meters. Green marks the lower part of the locally scaled surface, followed by yellow and orange, with brown representing higher terrain. The deepest visual feature is the Laughery Creek corridor. A dark green band winds from the northern interior through the center and then bends toward the southeast, closely following the creek shown on the water map.
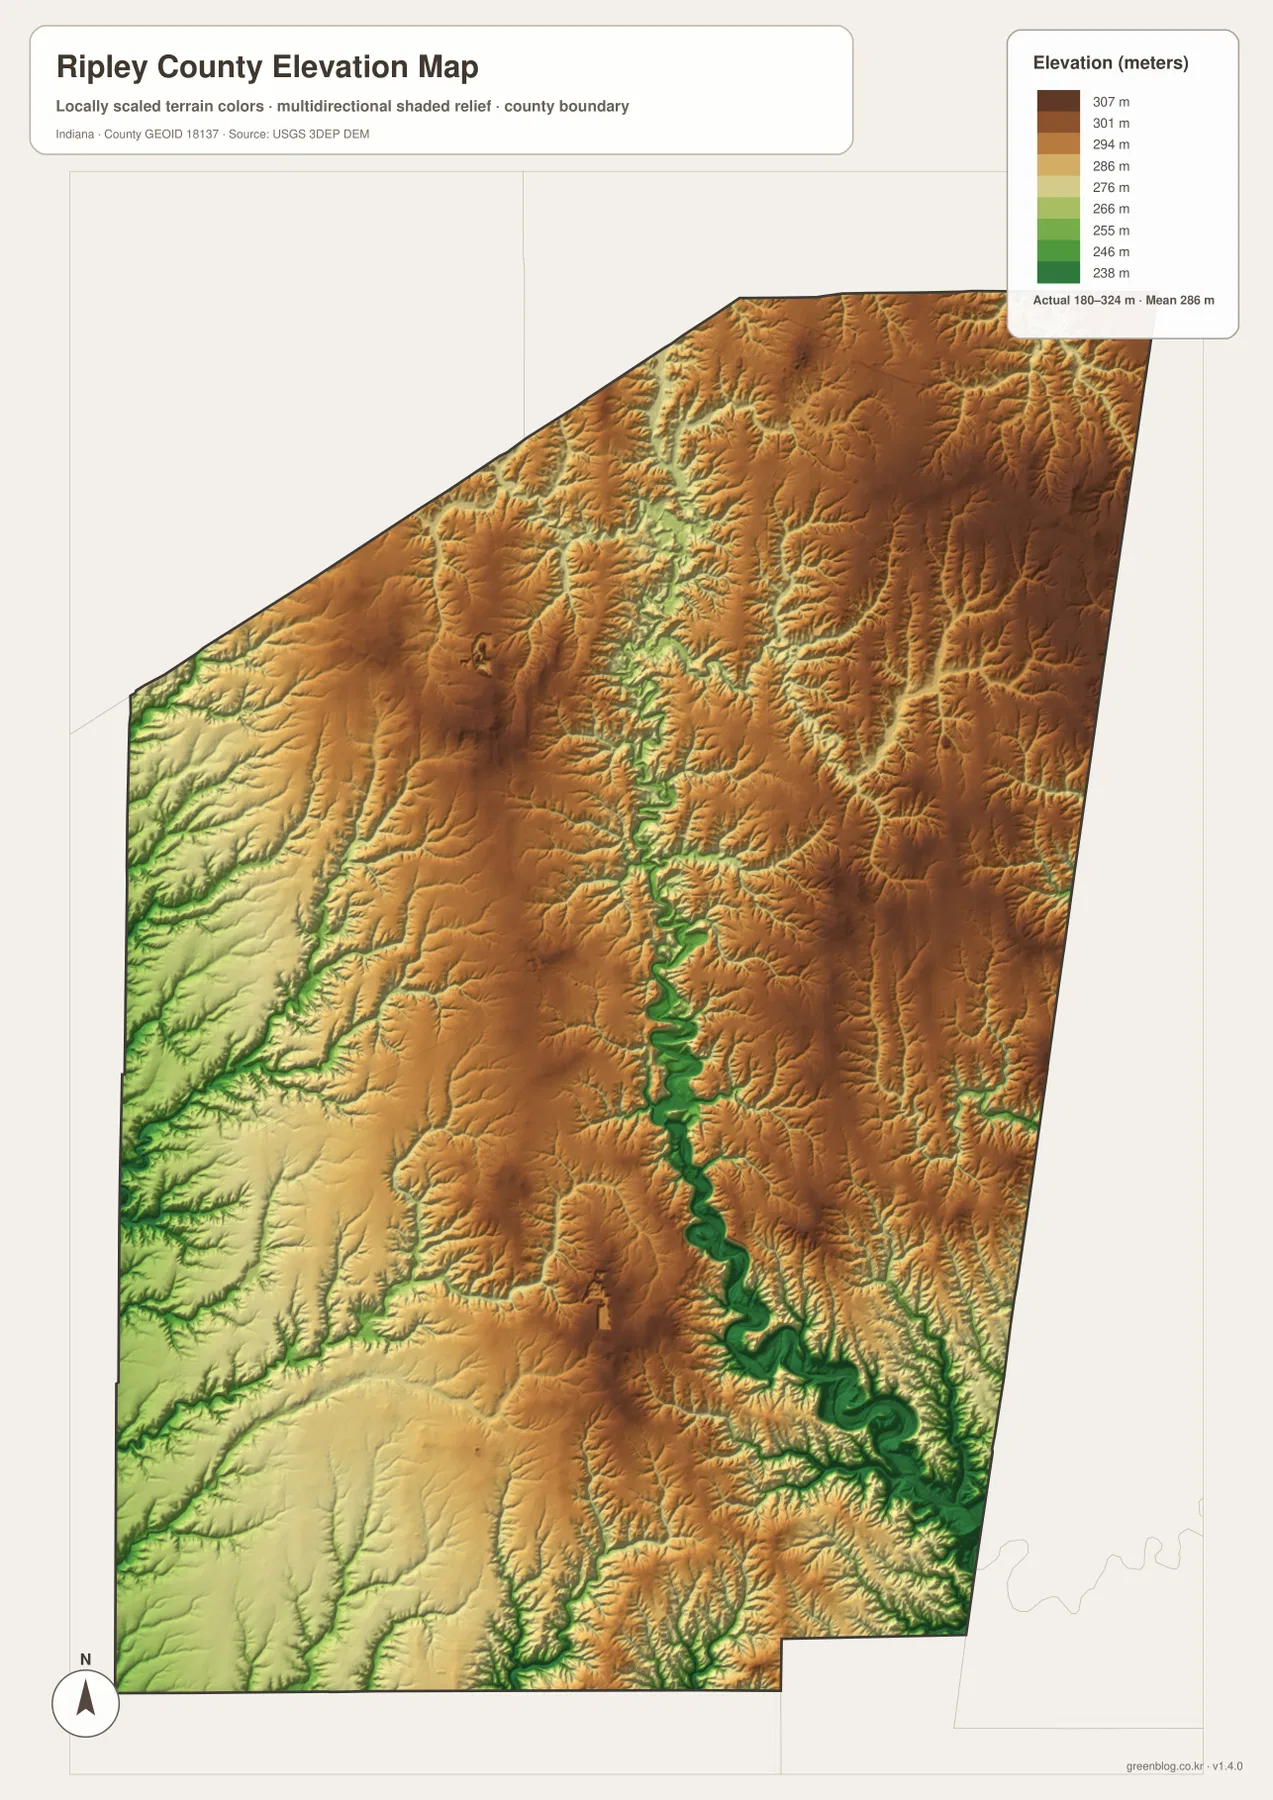
The eastern and northeastern parts of the county contain some of the broadest orange-brown areas. Thinking of Batesville and Sunman as place references helps locate those uplands. They are not flat plateaus. Many narrow tributary valleys cut into them, producing a dense sequence of ridges and low lines. The result is strongest near the Laughery Creek system, where high ground and a deep valley sit close together and create a large local change in elevation.
Western and southwestern Ripley County contain more yellow-green terrain and generally appear lower than the high eastern side, but they are not flat plains. Otter and Graham creek valleys continue to carve the surface, and the southern interior around the routes leading away from Versailles contains repeated ridge-and-valley forms. The useful countywide interpretation is therefore not a single slope from east to west or north to south. Ripley County is a rolling upland landscape repeatedly cut by low creek corridors.
The elevation map is designed for county-level comparison, not for assigning a survey-grade height to a house, road point, parcel, or construction site. Its range and mean are helpful reference values, but precise elevations should come from USGS source data or professional survey work. For map reading, the most important relationship is the way Laughery Creek and the smaller tributaries occupy low corridors within much higher surrounding ground.
Choose the road view for orientation and the physical maps for valleys and relief
When the goal is to find a town or numbered route, the general county map should be opened first. Route 50 at Versailles, Route 129 to the south, Route 421 in the southwest, Route 101 near Milan, and the 229/74/46 cluster around Batesville provide practical references. The city map is simpler when the only question is where the six highlighted towns lie relative to one another and to the county boundary.
The terrain-and-water map is the better choice for Laughery Creek, the three northern reservoirs, Ripley Creek, Otter Creek, Graham Creek, Raccoon Creek, and other named waterways. When the question changes from stream location to terrain, the elevation map shows how those same channels occupy lower corridors. The contrast between dark green valley floors and orange-brown uplands is especially useful for understanding why roads and towns are distributed across a landscape that is more broken than the general map first suggests.
The WebP images on this page are optimized for convenient browser viewing. The downloadable ZIP contains the original high-resolution JPG versions of the general county map, city map, terrain-and-water map, and elevation map. Each file is a portrait image measuring 2572 by 3638 pixels. The originals are the better choice for enlargement, A3 printing, or any use where small road and creek labels need to remain clear.
One simple comparison method is to keep Versailles fixed as a reference. Start with Route 50 and Route 129 on the road map, use the city view to place Osgood, Holton, Milan, and Batesville around it, then trace Laughery Creek on the water map. Finish by locating the same creek corridor on the elevation image. Repeating one familiar area across the four views makes the relationship between roads, water, and relief much easier to understand.
Frequently Asked Questions
Is Versailles or Batesville the better starting point for reading the Ripley County maps?
Versailles is the better starting point for roads and the county interior because Route 50 passes through it and the courthouse label is easy to find. Batesville is more useful for understanding the northern edge, Route 229, and the area around the three northern reservoirs. Using both towns together gives a clearer sense of the county’s north–south extent.
Are Oser, Bischoff, and Mollenkramer Reservoirs one connected lake?
No. The supplied water map labels Oser Reservoir, Bischoff Reservoir, and Mollenkramer Reservoir separately within the same northern zone. They are best understood as distinct named water bodies surrounded by short streams south of the Batesville area.
Why does Laughery Creek appear so strongly on the elevation map?
Laughery Creek occupies a low valley, so its winding course aligns closely with a dark green corridor on the elevation image. Higher orange and brown uplands rise nearby, especially toward the east and northeast. The map legend reports an actual county range of about 180–324 meters and a mean of 268 meters, which helps explain the strong relief around the creek system.
Map File Information
Download the high-resolution JPG originals for the Ripley County general map, city map, terrain-and-water map, and elevation map in one ZIP. Use the originals when small route or creek labels need to stay sharp or when preparing an A3 print.
- Printable Size: 2572×3638 px each
Related Maps
Sources and References
The county-specific road, place, water, and elevation descriptions above are based on the supplied Ripley County maps and asset information. The official resources below are useful when current boundary, hydrography, or source elevation data is required.
- U.S. Census Bureau TIGER/Line Shapefiles – official reference data for county boundaries, roads, and places
- USGS National Hydrography – official river, stream, and water-data information
- USGS 3D Elevation Program – elevation source data and program information
Green Map creates custom-edited map images using open geographic data sources such as geoBoundaries, Natural Earth, OpenStreetMap, and government open data.
These maps are edited visual materials, not raw data files, and are provided for education, documents, presentations, and graphic reference.