This page includes a downloadable ZIP of the supplied A3 high-resolution JPG maps for Gooding County, Idaho, along with WebP previews for quick viewing in the article. The maps show the county boundary and main roads, the positions of Gooding, Wendell, Hagerman, and Bliss, the Big Wood–Little Wood–Malad river system, the Snake River edge, and the steep rise into the northern high country. If you need the larger files for printing or closer inspection, the download box later on the page provides the original 2572×3638 JPG versions.
Gooding County is especially easy to understand when town locations, waterways, and elevation are compared rather than treated as separate subjects. Most of the named towns and prominent road labels appear in the middle and southern part of the county. North of that settled area, the road network thins while narrow valleys and small drainages become far more common. The elevation layer confirms the same change: broad green lowlands occupy much of the south, while yellow and brown high terrain dominates the far north.
A useful way to work through the page is to begin with Gooding as a reference point. Wendell lies to the south, Bliss to the west, and Hagerman to the southwest near the deeply cut western side of the county. The water map then explains what occupies the broad northern area and how the Big Wood and Little Wood rivers connect with the Malad River before the landscape reaches the Snake River side of the county. The elevation map ties those places together by showing where the land is lowest and where it rises sharply.
Table of Contents
Gooding, Wendell, Hagerman, and Bliss form the main southern reference points
The general county map makes the settlement pattern clear before any detailed terrain analysis is needed. Gooding sits slightly east of the county’s center, Wendell is farther south, Bliss lies to the west, and Hagerman is tucked near the curved western boundary in the southwest. All four named places fall within the lower half of the county. The broad northern section, by comparison, contains few large settlement labels and is filled instead with drainage lines and a sparse road pattern.
Several numbered routes provide easy orientation. Route 46 runs through the Gooding–Wendell area, while Interstate 84 and labels for 26 and 30 appear around the Bliss side of the county. The map is not a turn-by-turn navigation product, but it shows where the most obvious transportation lines are concentrated. Roads are denser across the middle and south, whereas the northern half is visually dominated by valleys and smaller watercourses.
The outline of Gooding County is also worth noticing. Much of the eastern side is comparatively straight, while the western middle and lower boundary bends inward around deeply cut terrain. Hagerman sits close to this indentation. Along the south, the boundary becomes irregular again near the Snake River side of the county. Those bends make more sense once the water and elevation maps are viewed, because the unusual shape corresponds with lower river-cut terrain rather than a simple rectangular administrative boundary.
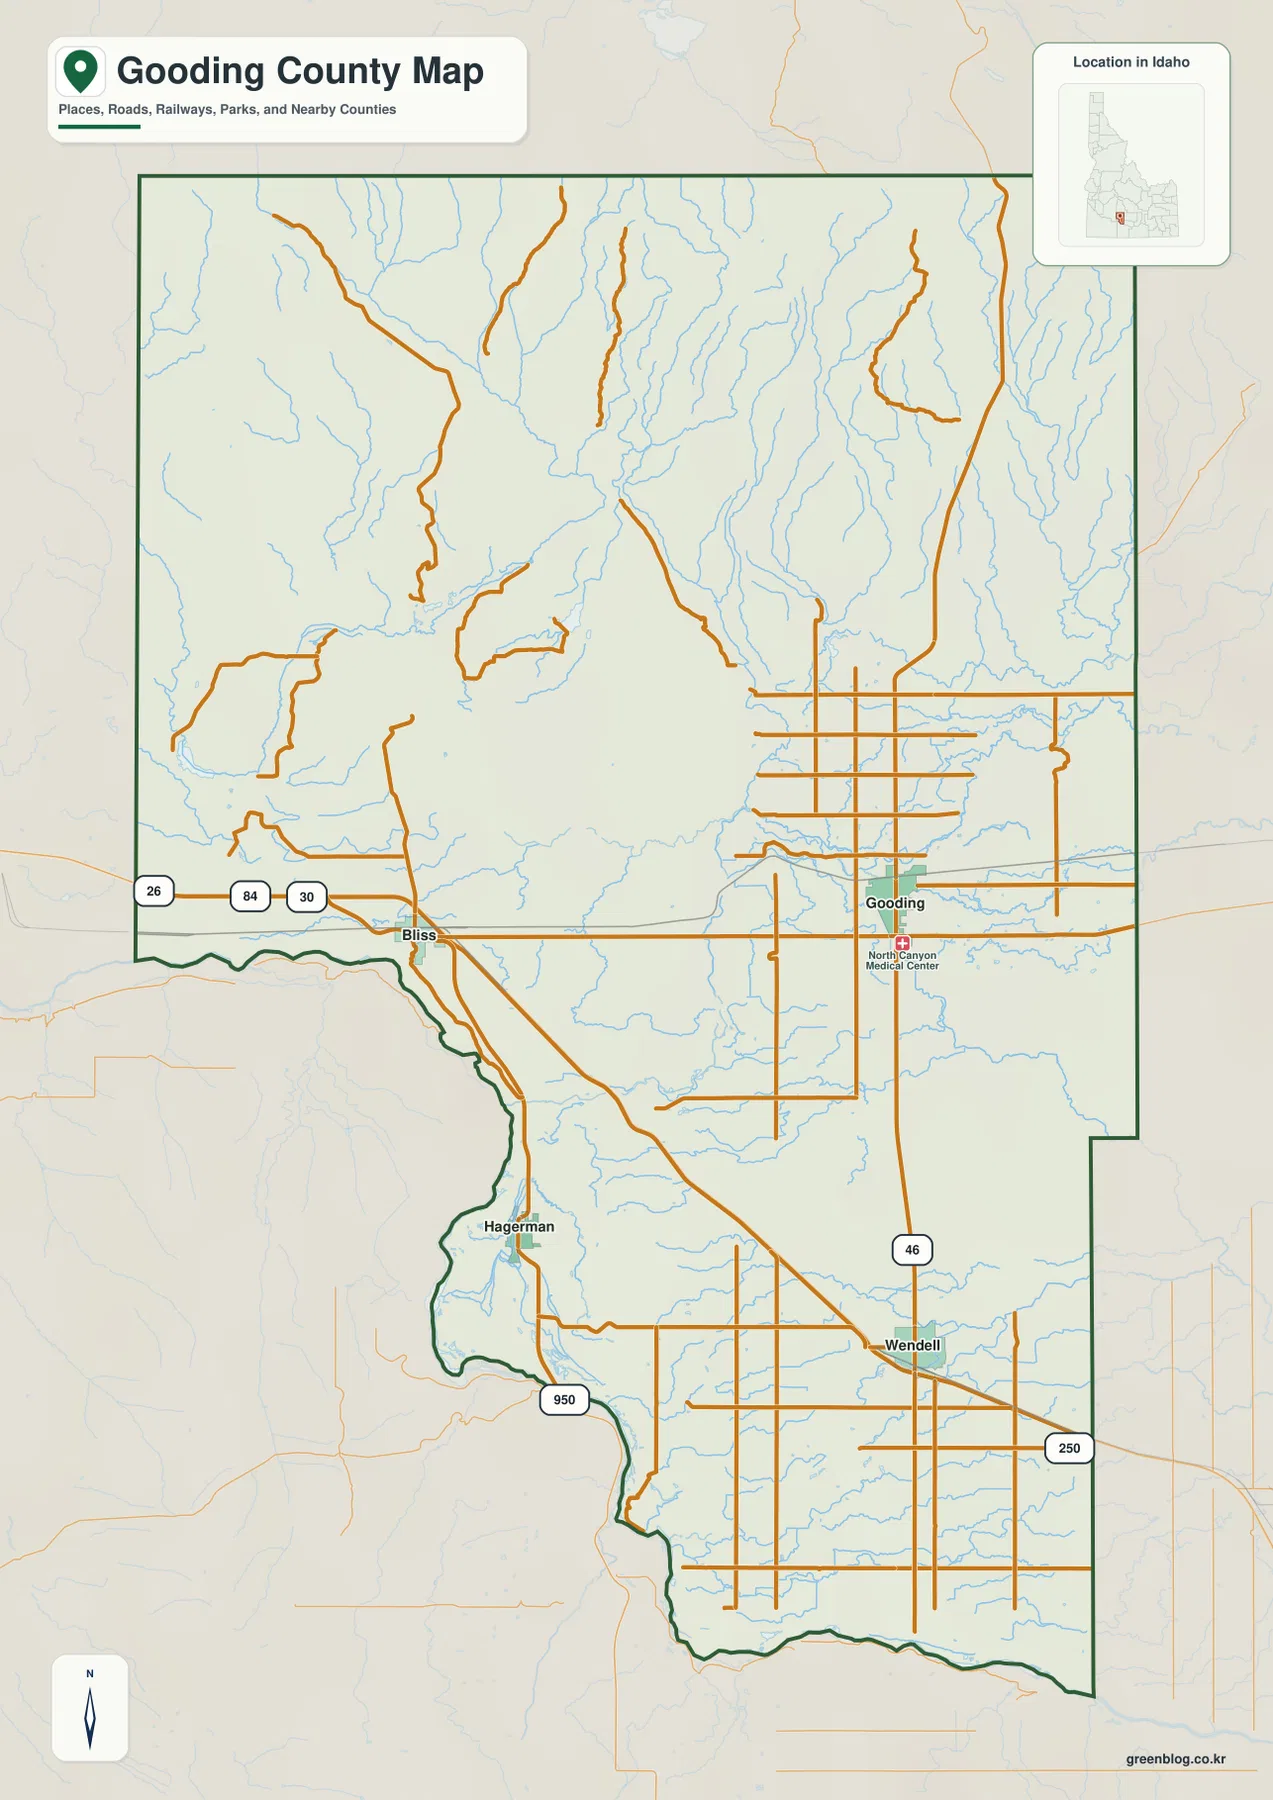
For first-time orientation, this is the best layer to start with. It gives enough information to answer basic questions such as which town is west of Gooding, where Route 46 runs, and why Hagerman appears close to a deeply curved section of the boundary. Once those positions are familiar, the specialized water and elevation maps are much easier to read because the same locations can be recognized immediately.
The city map shows direction and scale, not driving routes
The city-connections map uses Gooding as the hub and compares the other three named towns by straight-line distance. Wendell is shown about 11 miles away, while Hagerman and Bliss are each shown about 12 miles from Gooding. These are direct point-to-point measurements, not distances along the road network. Curves, intersections, highway access, and local streets can all make the actual driving distance longer.
The directions are more important than the exact numbers. Wendell lies south of Gooding, Bliss lies west, and Hagerman is southwest. Hagerman and Bliss therefore occupy the same general side of the county without being in the same direction. Hagerman is much closer to the deep western indentation and river-cut terrain, while Bliss is positioned near a cluster of major road lines in the middle-western part of the map.
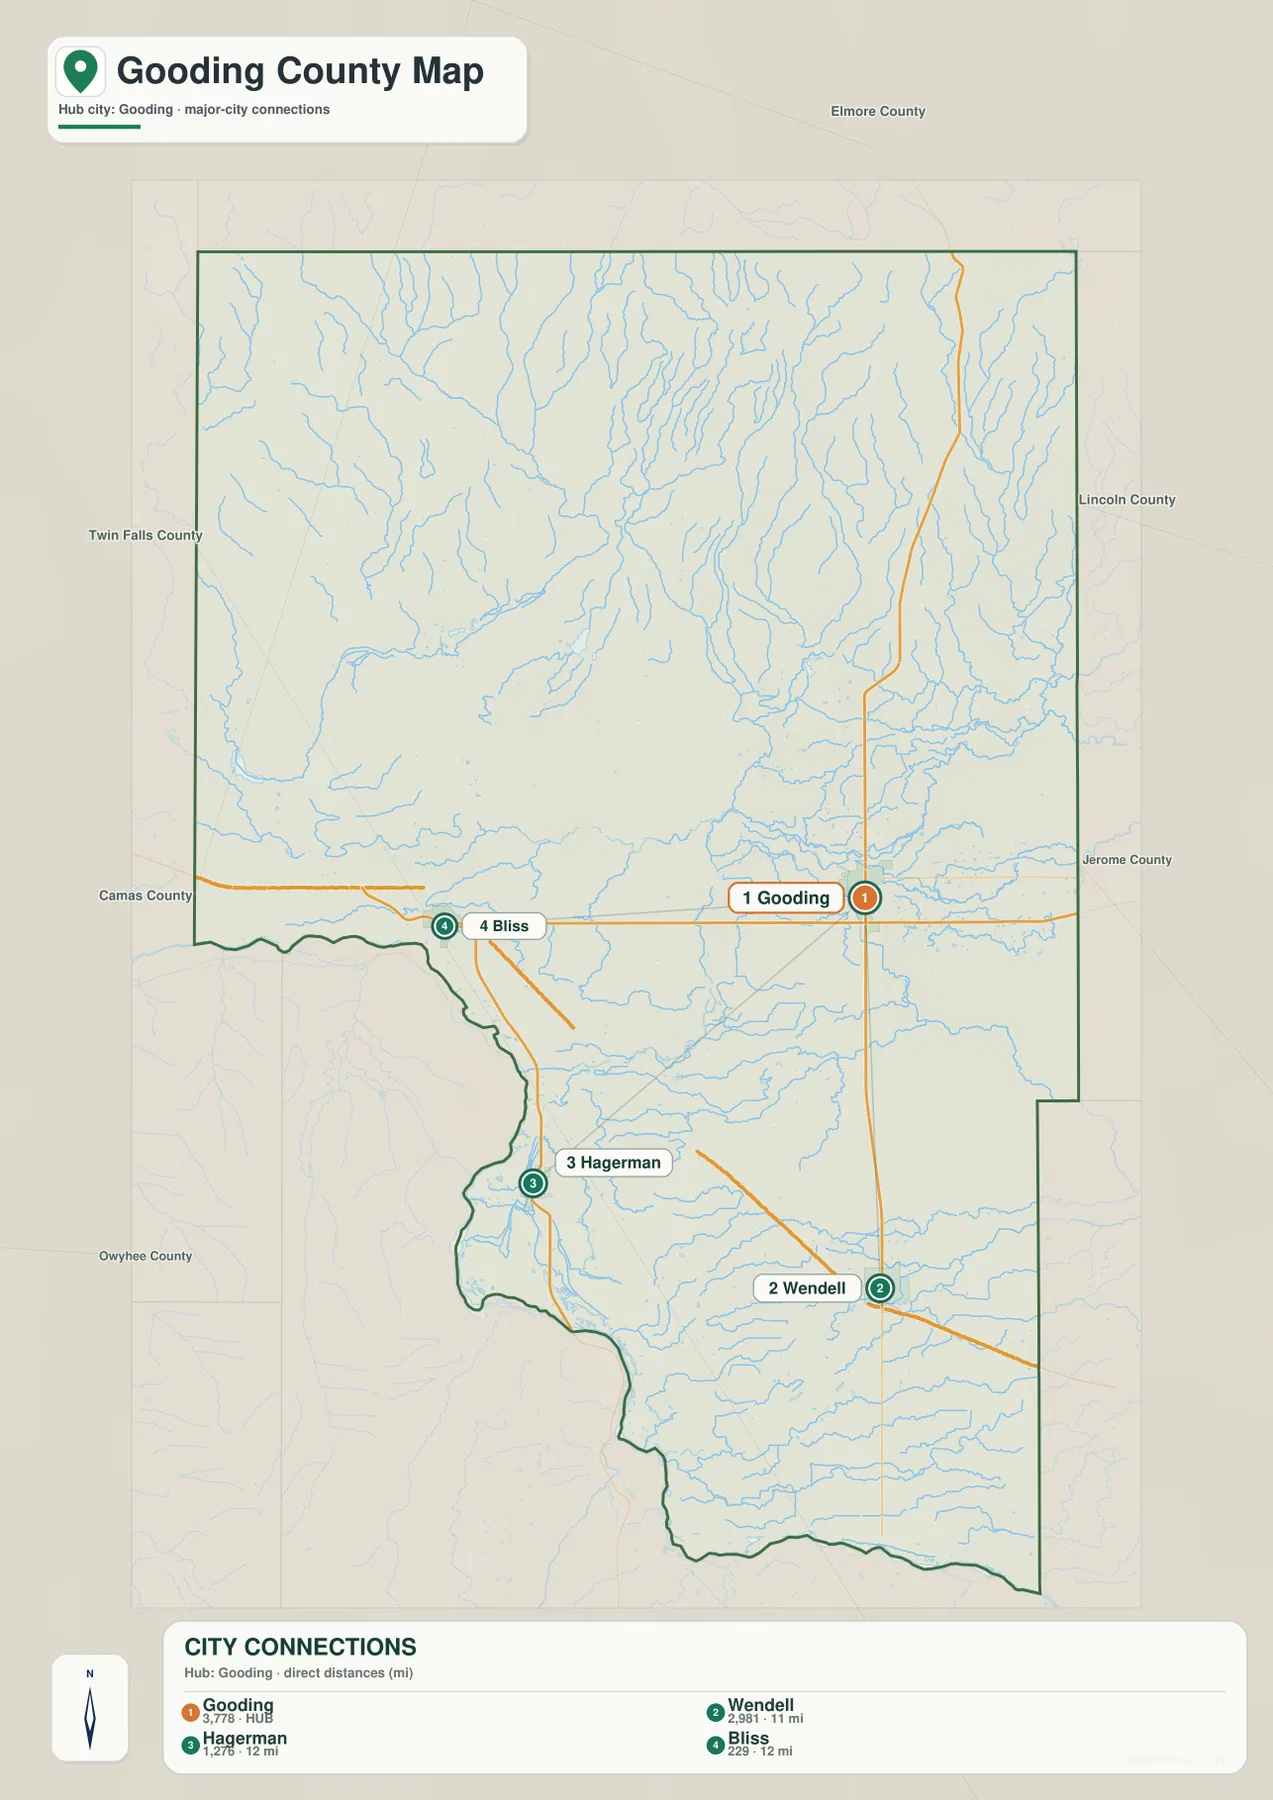
The surrounding county labels add regional orientation, but the main value of this layer is local. It quickly shows how compact the four named towns are compared with the full north–south extent of Gooding County. There is no comparable cluster of large town labels in the northern half. That simple contrast prepares the reader for the next two maps, where the northern area is explained by drainage density and higher terrain rather than by settlement.
Big Wood and Little Wood rivers feed into the Malad system
The terrain-and-water map shifts attention from roads to the county’s drainage network. In the east-central area, the Big Wood River and Little Wood River are clearly labeled as they approach one another. Downstream, the Malad River continues generally southwest toward the deeply cut western terrain. Along the far southern edge, the Snake River provides a separate major water reference. Following these names from east-central Gooding County toward the west and south gives a much clearer sense of the county’s water geography than the road-focused base map can provide.
The northern section is filled with smaller channels. Dry Creek, Clover Creek, Black Canyon Creek, and Thorn Creek are among the named features, and many unnamed tributaries occupy the narrow valleys around them. The shaded relief is important here because it shows that these blue lines are not crossing a flat empty plateau. They run through dissected high ground where ridges and valleys repeat across a large part of the northern county.
Smaller water bodies and canals add another layer of detail. Pioneer Reservoir appears in the west, while Hot Sulphur Lake and Bray Lake are visible farther east near the Clover Creek area. North Gooding Main Canal and South Gooding Main Canal cross the central and eastern part of the county, and W Canal is labeled farther south. The layer therefore contains natural rivers and creeks as well as reservoirs, lakes, and named canals. It should be used as a geographic reference, not as a flood-risk, water-rights, or navigation map.
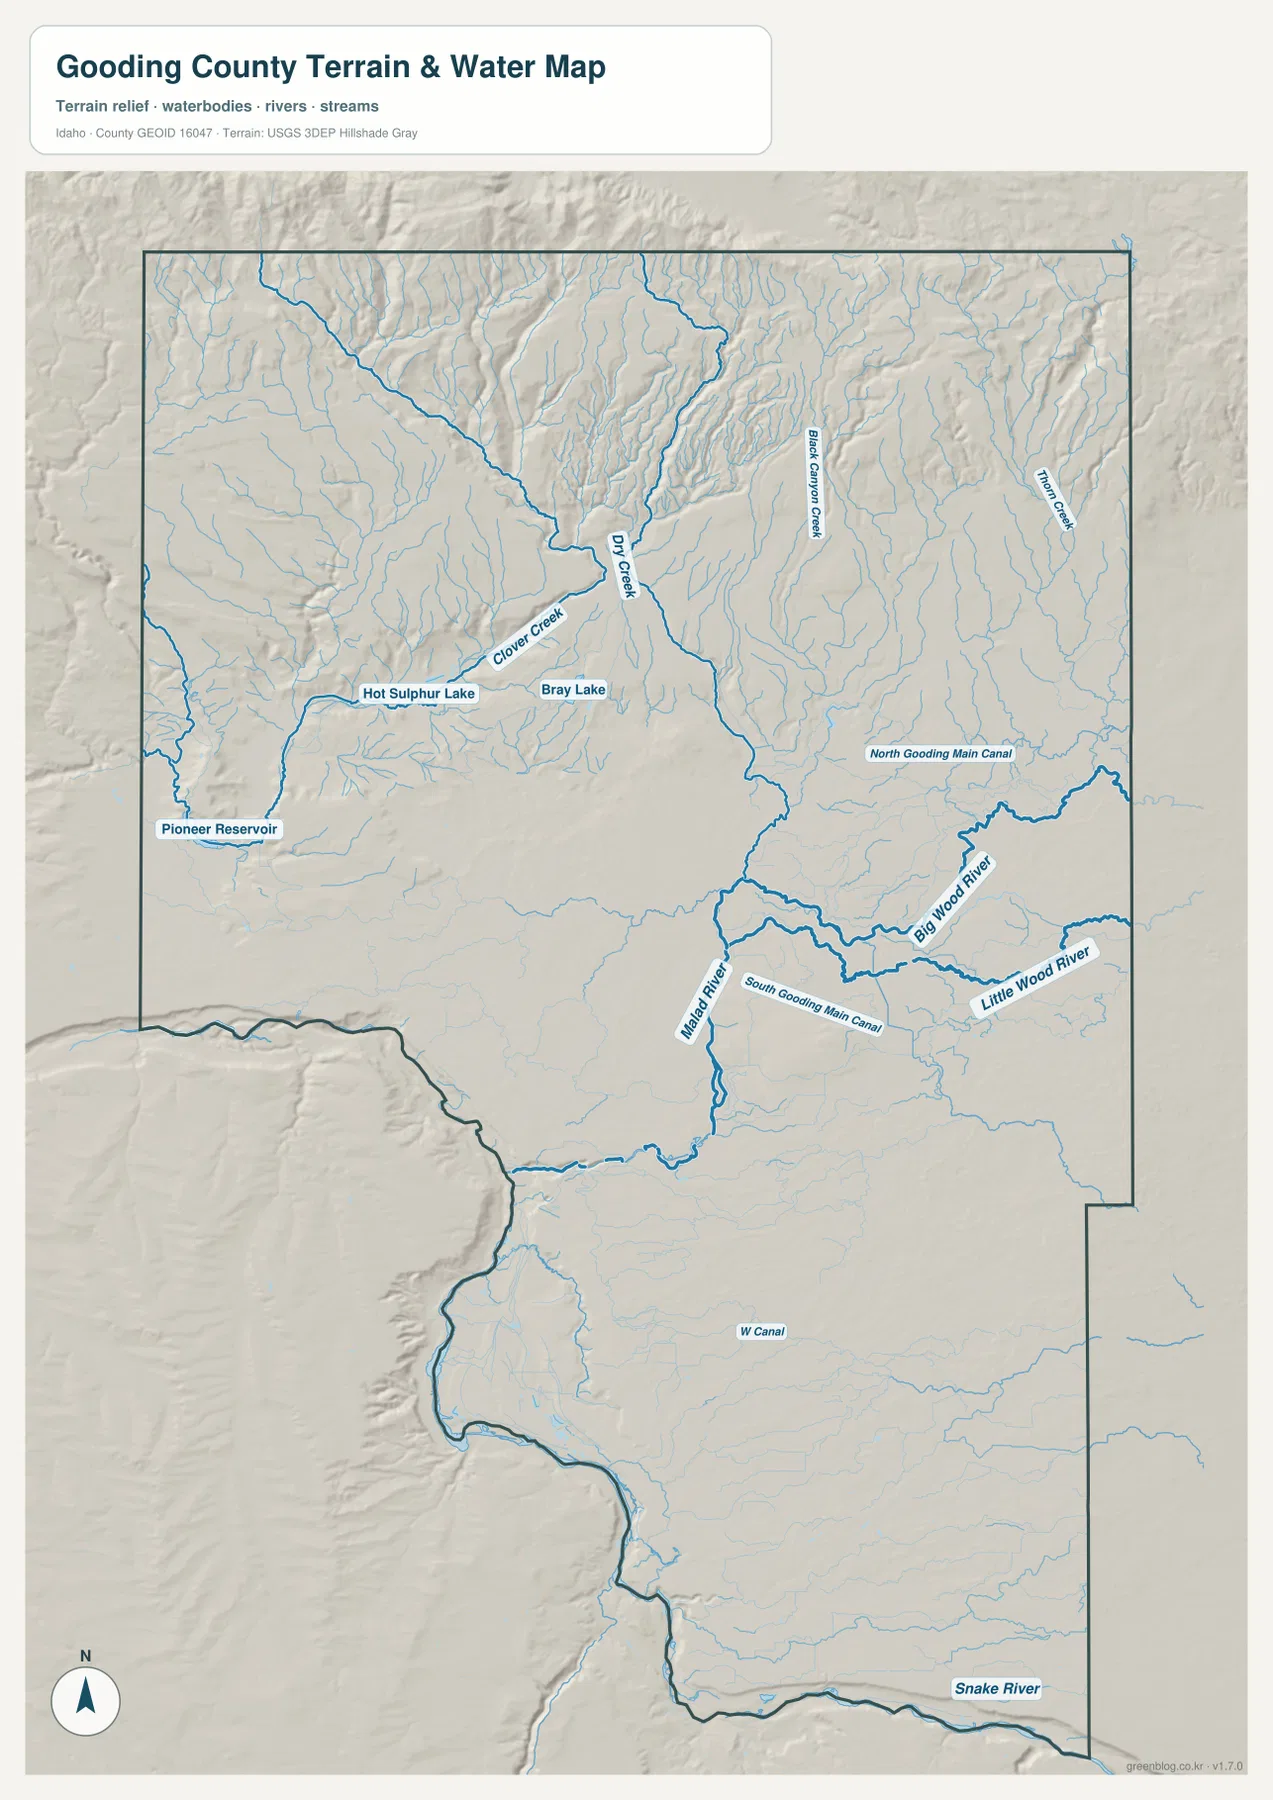
The map also explains why the western boundary near Hagerman looks so different from the straighter eastern side. The west-central and southwestern landscape is deeply cut, and the Malad River descends toward that lower corridor. Farther south, the Snake River follows the lower edge of the county. The relationship between water and boundary shape is much easier to see here than on a plain outline map.
The Snake River lowlands sit far below the northern high country
The elevation map gives the county’s strongest physical contrast a numerical scale. Its legend reports an actual elevation range from about 787 to 1,947 meters, with a mean of 1,185 meters. Most of the central and southern county appears in green, while the far north rises through lighter greens and yellows into broad brown highlands. The color transition is large enough that the north–south difference is obvious even before individual valleys are examined.
Relief shading reveals that the northern high country is broken by repeated ridges and narrow valleys. Those valleys match the dense creek network shown on the water map. Moving south, the surface becomes broader and smoother. Gooding and Wendell sit within this lower part of the county rather than in the brown northern zone. Near Hagerman, a deeply incised low corridor appears against the surrounding surface and corresponds with the pronounced bend in the western boundary.
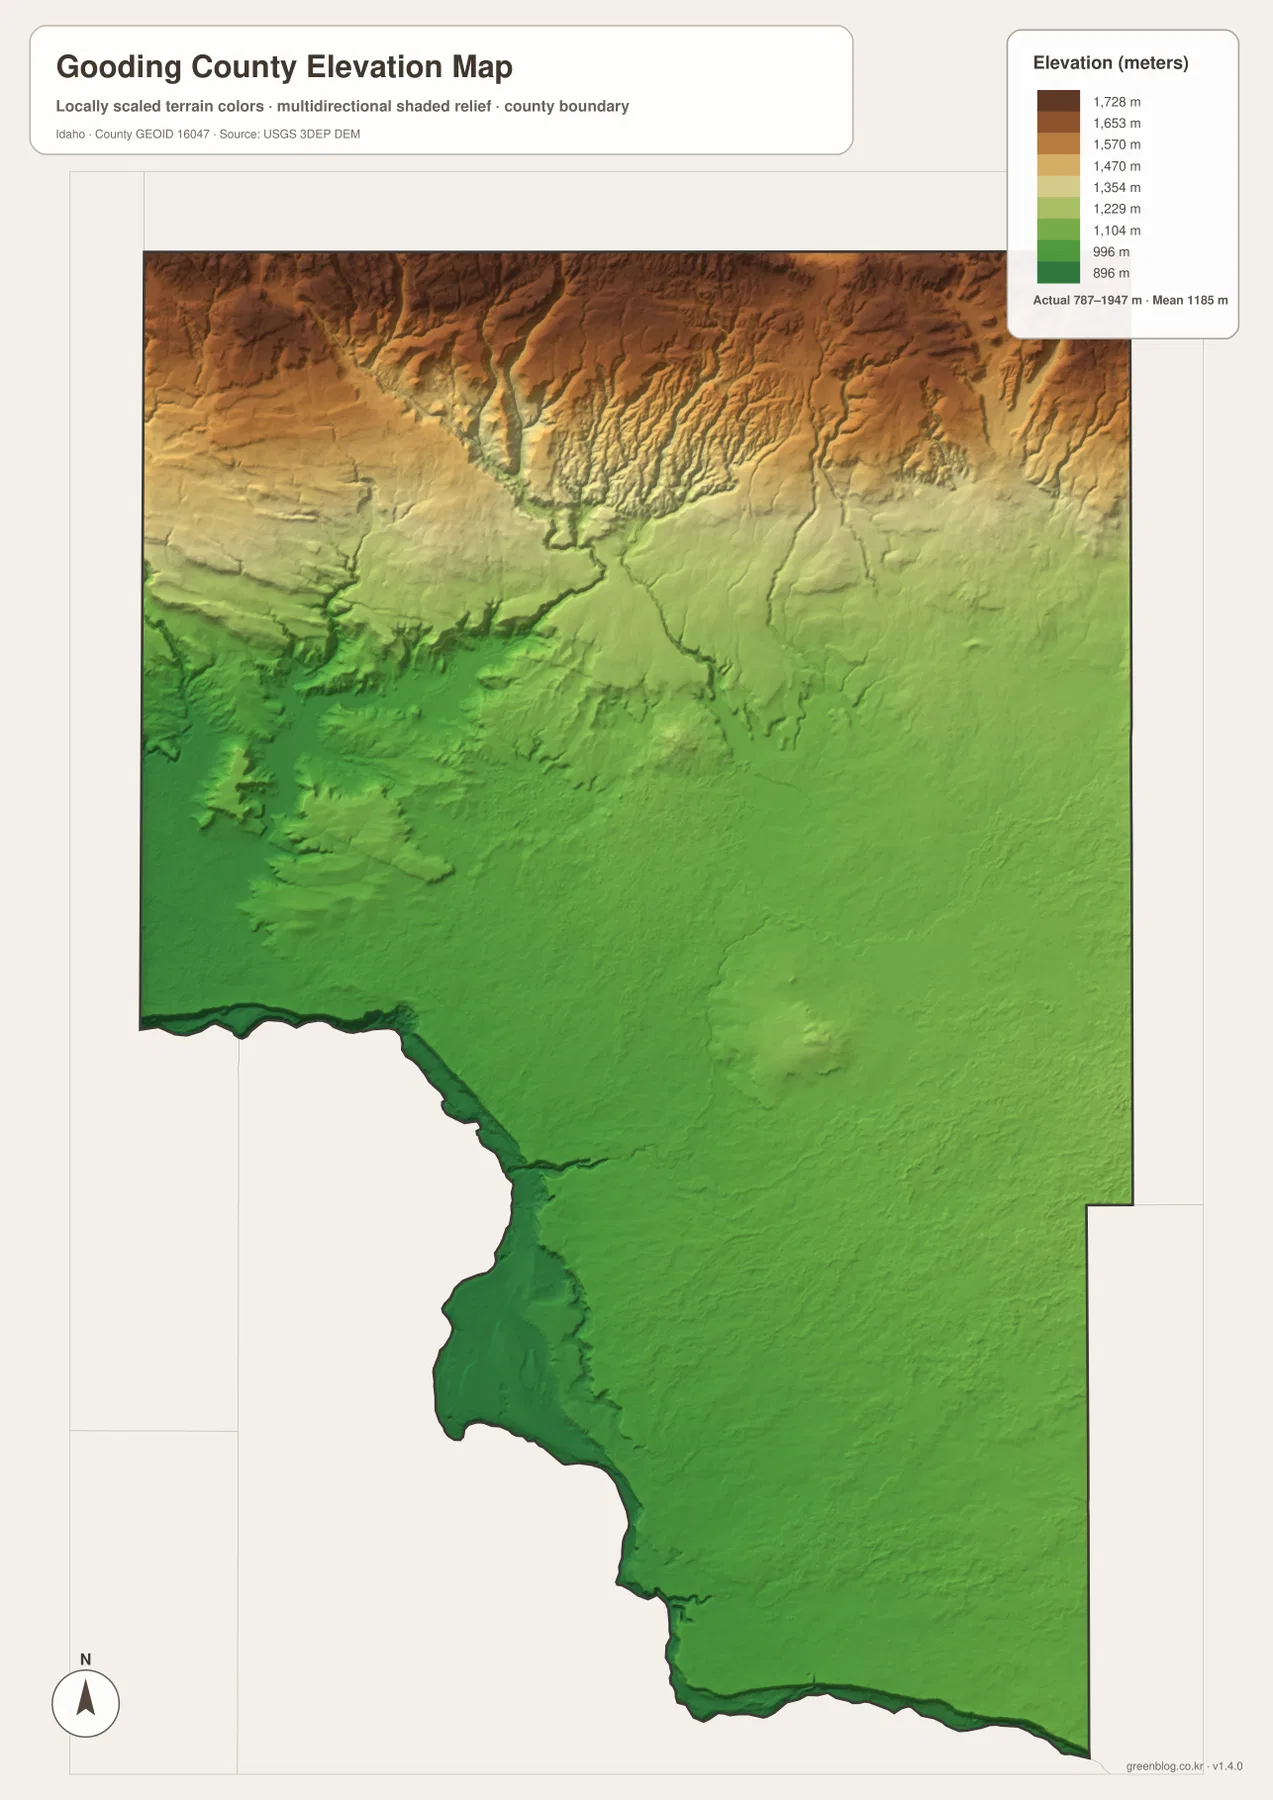
This layer is useful for county-wide comparison rather than survey work. It can show that the Snake River side is low relative to the north, or that the main towns lie below the highest terrain, but it cannot provide a survey-grade elevation for an individual parcel or road cut. For that kind of decision, a more precise site-specific dataset would be required.
The same places look different when roads, water, and elevation are compared
Gooding itself is a good example of why the layers work better together. On the county map, it is a central road reference and the hub for comparing the other named towns. On the water map, it sits near the Wood River system and named canals across a broad lowland. On the elevation map, the same area falls well below the brown northern high country. None of the individual maps needs to carry every label because each one adds a different part of the same geographic picture.
Hagerman provides an equally useful comparison. The base map places it near the strongly curved western boundary. The terrain-and-water map shows a deeply cut corridor in the same area, while the elevation layer colors that corridor as lower ground than the surrounding surface. Bliss is farther north and closer to the major western road cluster, while Wendell occupies a broad lower area south of Gooding. Comparing the four towns across layers makes the county feel less like a collection of isolated names and more like a connected landscape.
The northern half deserves the same treatment. A sparse road map can make the area look empty, but the water layer fills it with creeks and valleys, and the elevation layer shows why those drainages are so numerous. Much of the north is high, broken terrain. The point where roads become less dense is close to the area where creek valleys multiply and elevation begins to rise, so the three maps reinforce one another without repeating the same information.
Choose the map by the question you need to answer
Use the general county map when the main question is location: where Gooding, Wendell, Hagerman, or Bliss sits, which major roads pass nearby, and how the county boundary bends. Use the city map when you want a quick comparison of direction and straight-line scale from Gooding. The water-and-terrain map is better for the Big Wood, Little Wood, Malad, and Snake rivers, along with named creeks, canals, reservoirs, and lakes. The elevation map is the clearest choice for comparing the low southern terrain with the high north.
The WebP previews are convenient for reading on the page, while the downloadable JPG files are better suited to printing, presentations, or closer inspection. The ZIP contains the supplied county, city, terrain-and-water, and elevation maps as 2572×3638 JPG images in an A3 portrait format. If you only need a simple orientation image, the county map may be enough; if the goal is to explain physical geography, pairing the water and elevation maps gives a much fuller view.
Frequently Asked Questions
Are the 11- and 12-mile city connections driving distances?
No. The city map uses straight-line measurements from Gooding. Wendell is shown at about 11 miles, while Hagerman and Bliss are each about 12 miles away. Actual driving distances depend on the road network and can be longer. The map is best used to compare direction and relative spacing, not to plan a route.
Which map best shows the Big Wood, Little Wood, and Malad rivers?
The terrain-and-water map is the best choice. It labels the Big Wood River and Little Wood River in the east-central county, the Malad River downstream, and the Snake River along the southern edge. It also includes Dry Creek, Clover Creek, canals, reservoirs, and small lakes, making it the most useful layer for comparing named water features.
How large is the elevation range across Gooding County?
The supplied elevation map reports an actual range of about 787 to 1,947 meters and a mean elevation of 1,185 meters. The lower southern and central areas are mostly green, while the highest northern terrain is shown in yellow and brown. The map is intended for broad geographic comparison rather than precise site surveying.
Sources and reference material
County boundaries and general geographic data can be checked with the U.S. Census Bureau TIGER/Line Shapefiles. Water features can be referenced through USGS National Hydrography, and elevation data through the USGS 3D Elevation Program.
For local administrative and community information, see the official Gooding County website and its Community Information page. These sources are useful companions when a map feature needs to be checked against county-level information.
Map File Information
Download the A3 high-resolution JPG maps for Gooding County in one ZIP when you need files larger than the on-page previews.
- Included Files: county map, city map, terrain and water map, elevation map
- Printable Size: 2572×3638 pixels for each JPG
- File Type: ZIP containing 4 JPG images
Related Maps
Green Map creates custom-edited map images using open geographic data sources such as geoBoundaries, Natural Earth, OpenStreetMap, and government open data.
These maps are edited visual materials, not raw data files, and are provided for education, documents, presentations, and graphic reference.