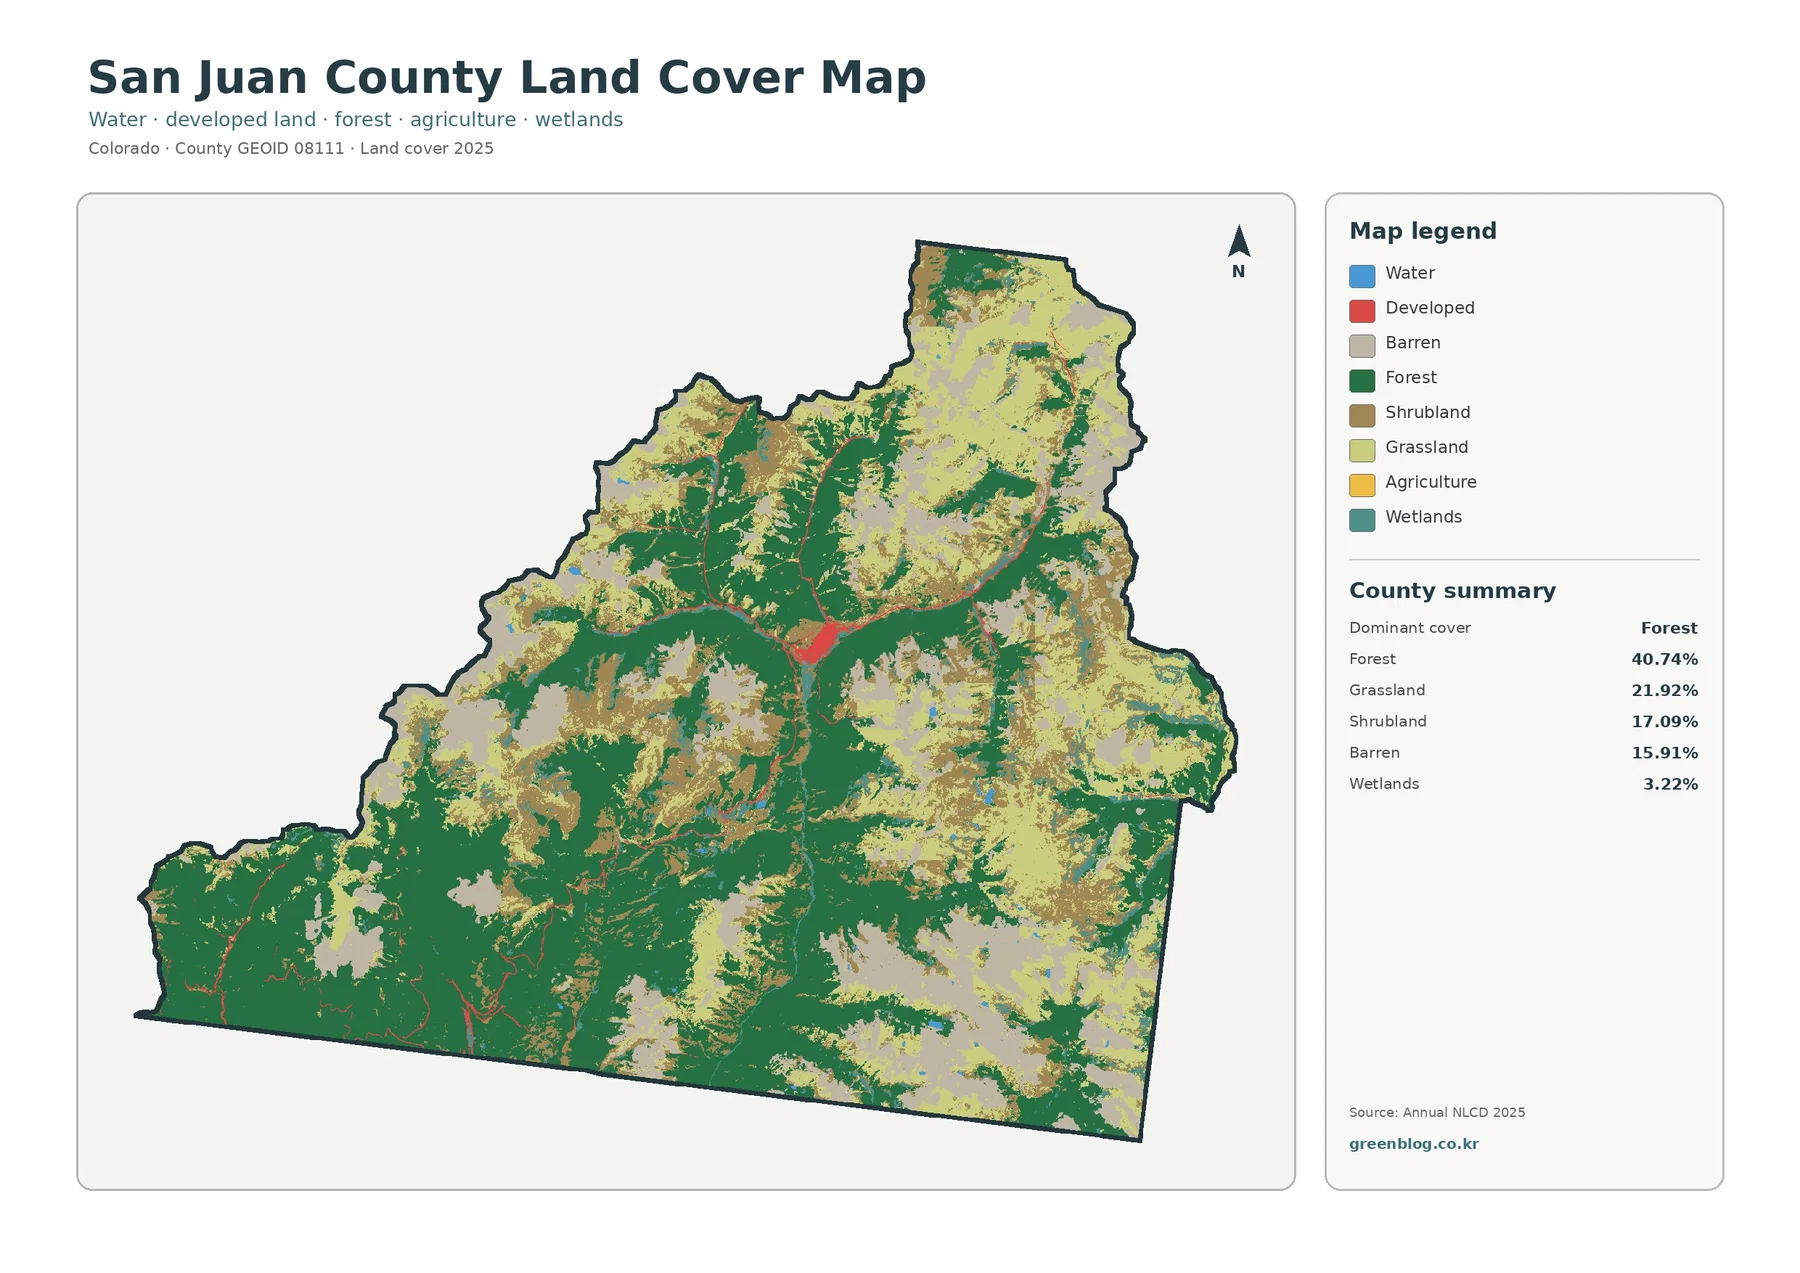
San Juan County is one of Colorado’s most strongly alpine land-cover landscapes. The 2025 summary is led by forest at 40.74%, followed by grassland at 21.92%, shrubland at 17.09%, and barren land at 15.91%. Wetlands account for 3.22%, developed cover for 0.94%, and water for 0.18%. Agriculture rounds to 0.00% in the map summary.
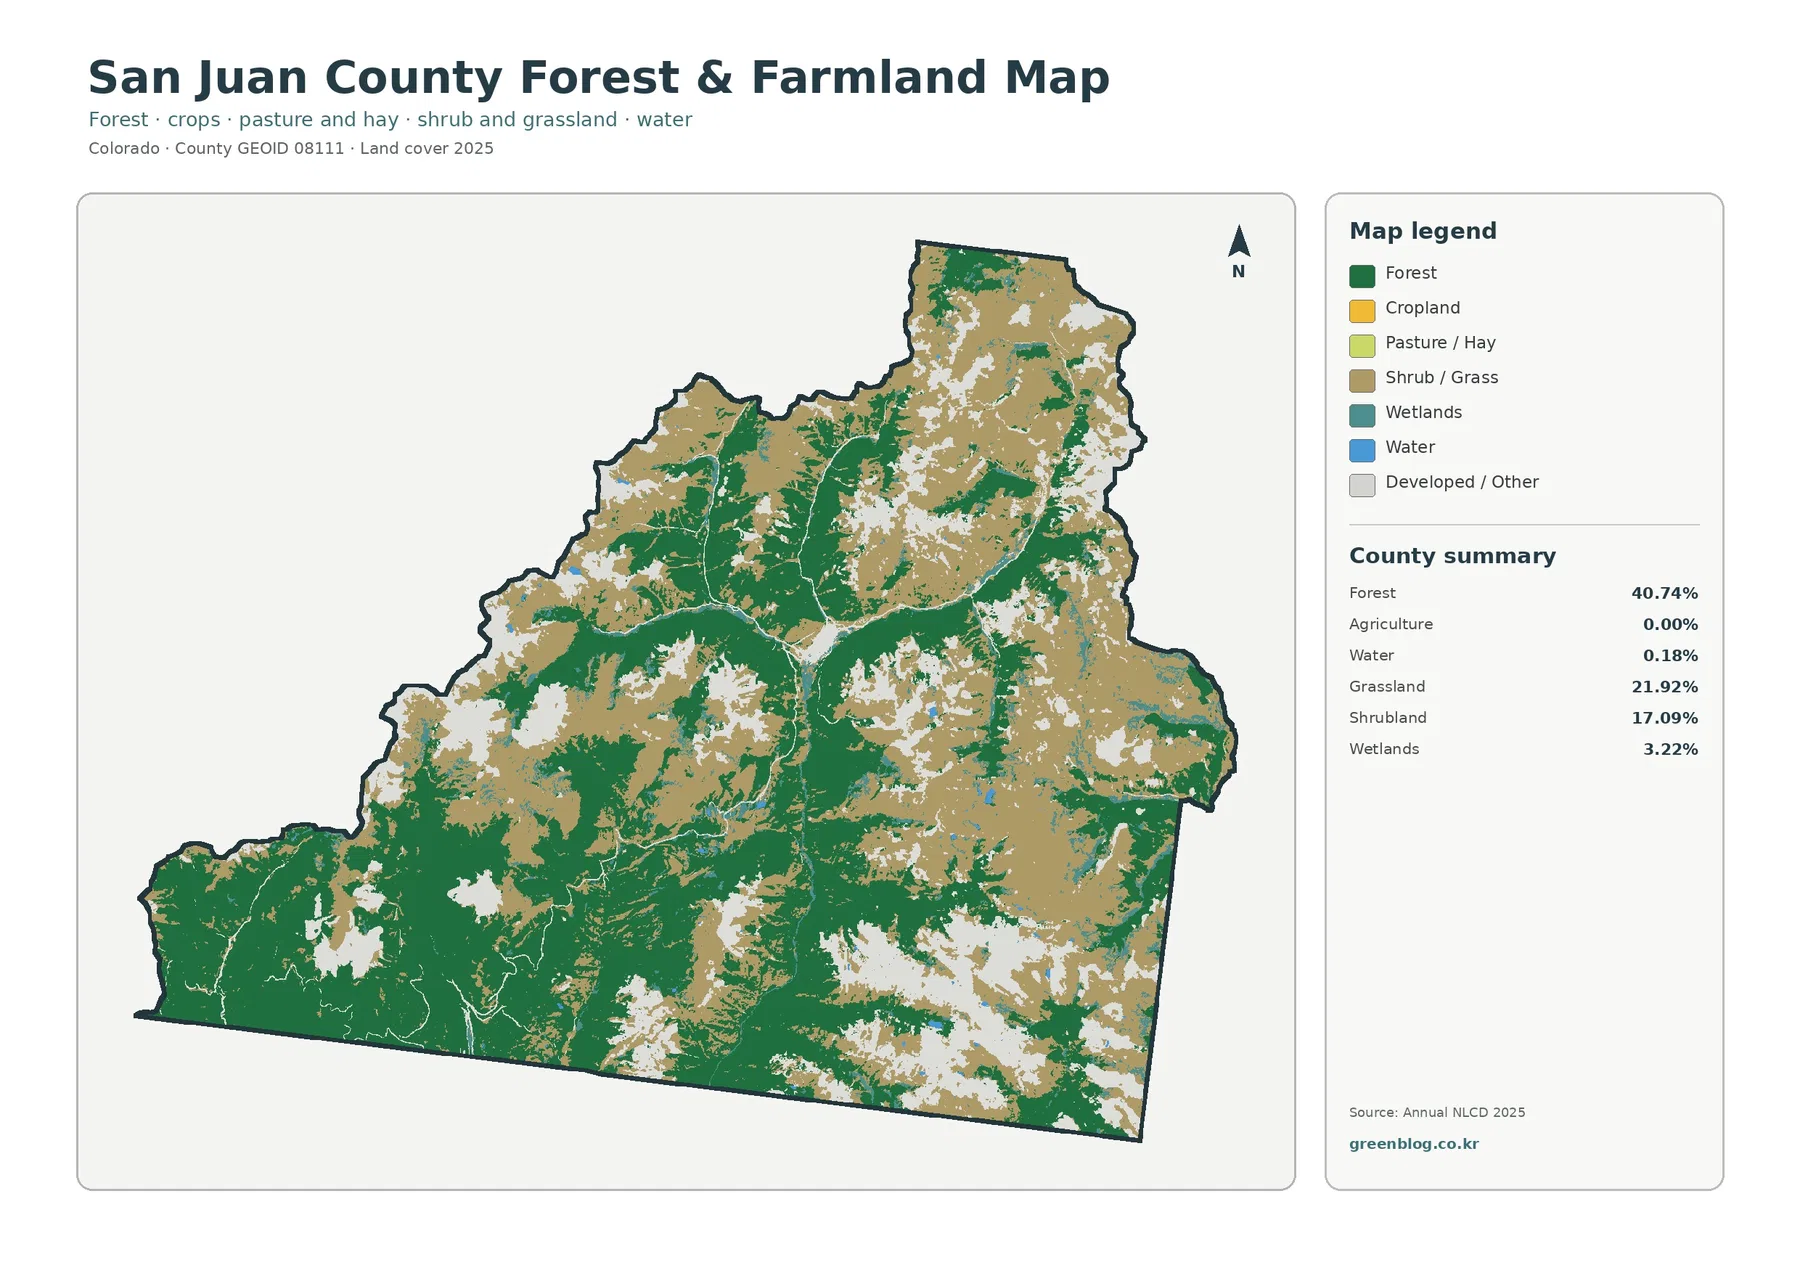
The four maps on this page separate different questions that are easy to mix together. The general land-cover map is best for the overall mountain mosaic. The forest and farmland version makes vegetation contrasts easier to see. The impervious map isolates hard surfaces around Silverton and along roads, while the 1985–2025 map marks cells whose class changed between the two mapped years. Original JPG versions of all four maps are available together in the ZIP download below.
Table of Contents
A county where forest, alpine openings, and exposed ground share the landscape
Forest forms the largest continuous cover in San Juan County, especially across the southern and southwestern parts of the map and through broad central mountain areas. It is not a single uninterrupted blanket. Grassland, shrubland, barren ground, wetlands, and small water features break the forest into a complex pattern that changes quickly across short distances.
Grassland is the second-largest class at 21.92%. On this map it does not resemble the broad plains of eastern Colorado. Much of it appears as open alpine or subalpine terrain among forested slopes and higher ridges. Shrubland, at 17.09%, fills many of the transitions between forest and more open ground and is especially visible across the north and east.
Barren land covers 15.91%, an unusually important share for a county land-cover summary. In this setting, barren does not mean vacant property or land available for development. It can represent exposed rock, thinly vegetated slopes, talus, and other high-elevation surfaces where vegetation is sparse. That distinction matters because a planning map would answer a completely different question.
Wetlands make up 3.22% and appear as narrow, scattered features that follow low areas and drainage corridors. Water is only 0.18%, so lakes and stream surfaces occupy a small fraction of the county even though water has an important visual and ecological role in mountain valleys. Developed land is also limited at 0.94%, with the strongest concentration near Silverton.
Why the forest and farmland view is useful even when agriculture is 0.00%
The forest and farmland map simplifies the legend so the main vegetation groups stand out. Large forest blocks are easy to follow across the southern half of the county, while shrub and grass classes dominate many open slopes and higher areas. Small wetland and water features remain visible, but agricultural color is essentially absent.
Agriculture is reported as 0.00% in the 2025 summary. That number should be read as a land-cover classification result, not as a statement that no agricultural activity of any kind can occur in the county. It means mapped cropland and pasture/hay classes account for virtually none of the county area at the scale used for this dataset.
This distinction is particularly useful when comparing San Juan County with Colorado counties where cropland occupies broad valley floors or plains. Here, the map is dominated by natural mountain cover instead. The absence of a meaningful agricultural footprint makes the separation between forest, shrub/grass, barren ground, and wetlands much more important than a farm-versus-forest comparison.
Raster land-cover data also generalize the ground into cells. A narrow stream, a thin band of willows, exposed rock, and nearby grass can all fall within or beside the same mapped cell. Small patches should therefore be treated as generalized landscape information rather than surveyed boundaries.
Silverton is the clear center of hard-surface development
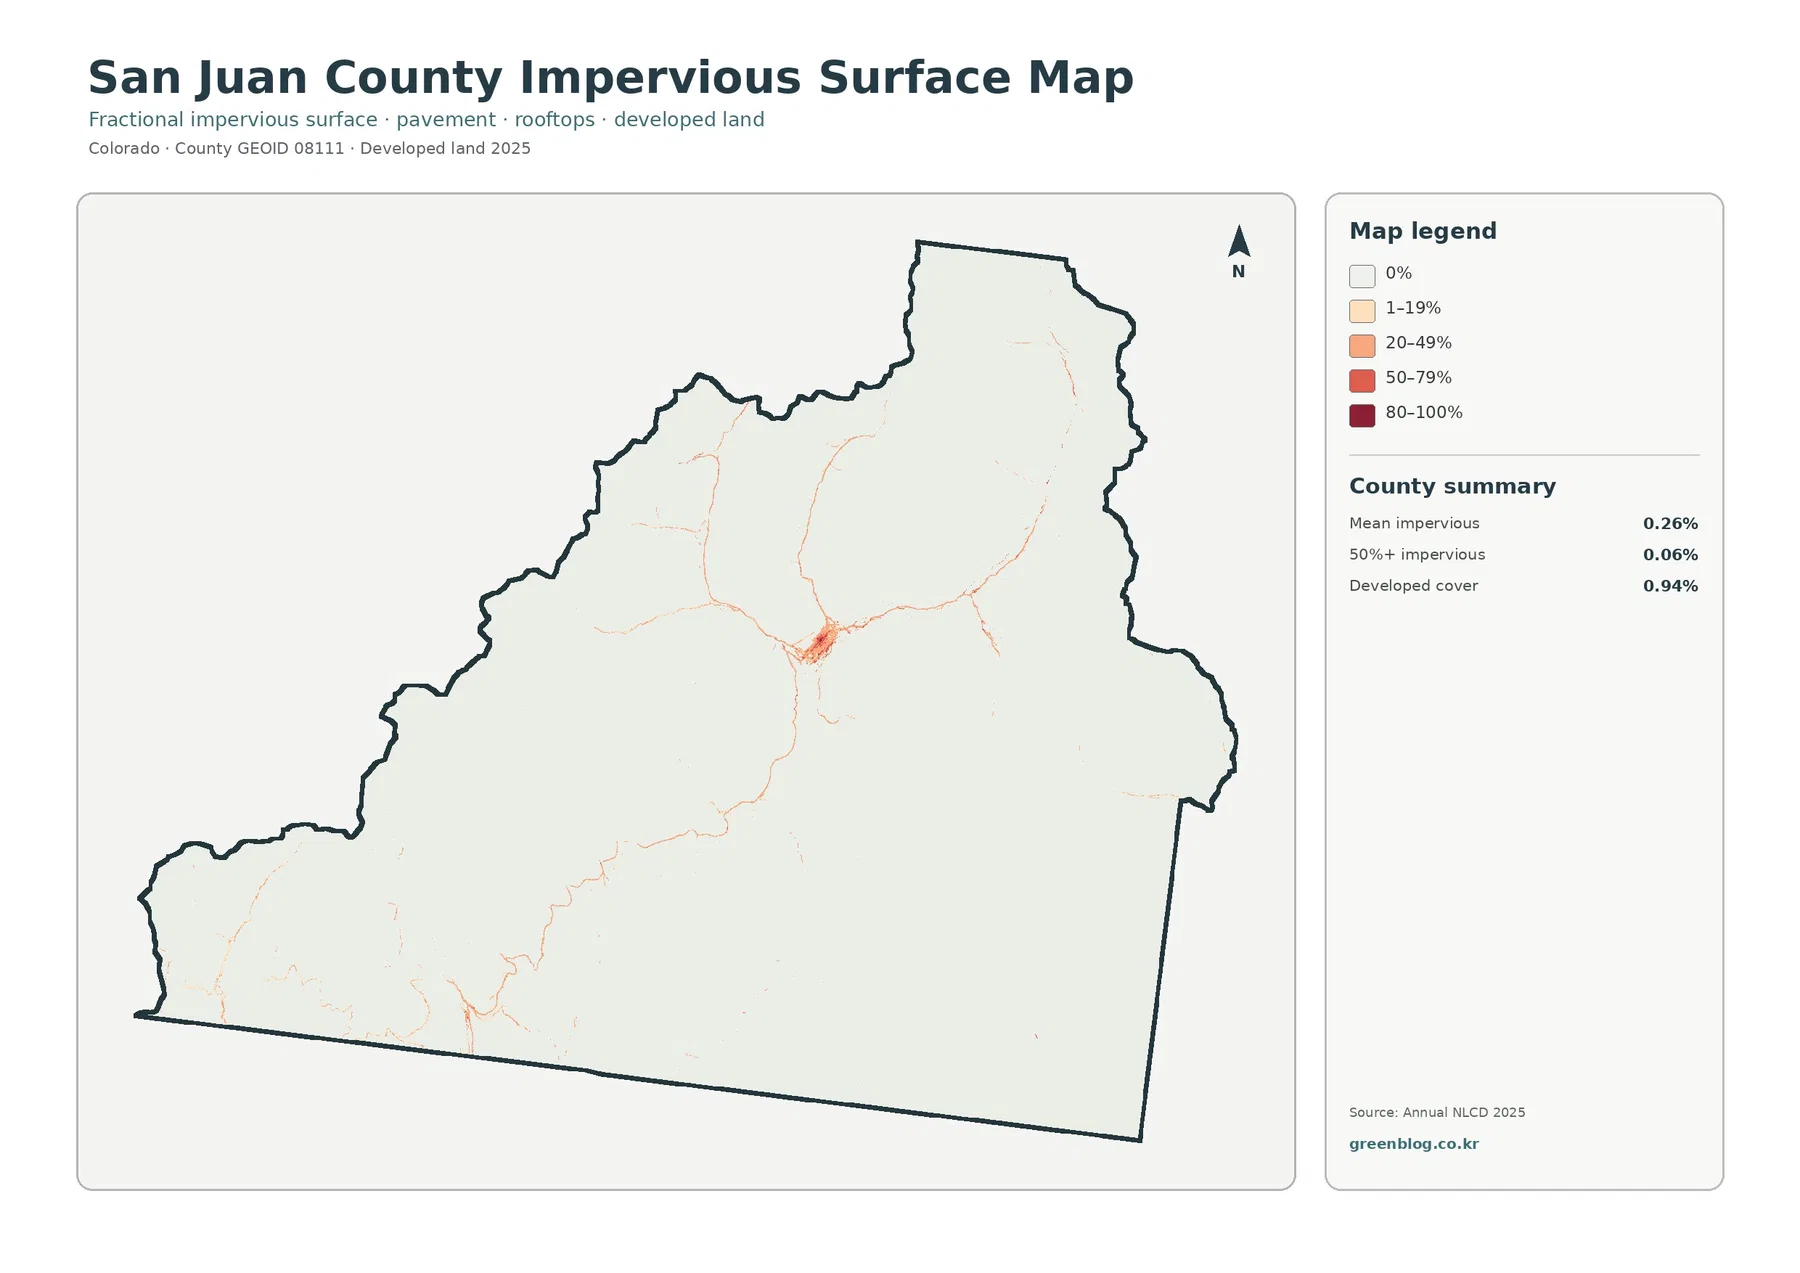
Impervious surface means pavement, rooftops, and other hard surfaces that do not readily absorb water. San Juan County has a mean impervious value of 0.26%, and only 0.06% of the county is mapped at 50% or more impervious. Developed land cover is 0.94%. Those figures fit the map, where most of the county is very pale and only a few narrow corridors show stronger values.
Silverton is the obvious exception. The central settlement appears as the county’s strongest orange-red cluster, with thin lines extending outward along transportation routes. The official San Juan County website places county government in Silverton, which helps explain why the town is the most recognizable developed concentration on a map otherwise dominated by mountain cover.
Beyond Silverton, the impervious signal becomes faint very quickly. The county’s Road & Bridge page describes unpaved county roads ranging from roughly 9,000 to 12,500 feet in elevation and notes the demanding seasonal conditions under which they are maintained. That source is useful context, but the impervious map itself does not identify road names, surface condition, access, or seasonal closures.
Developed cover and impervious percentage should not be treated as interchangeable. A developed land-cover class can include vegetation, soil, and other permeable surfaces mixed with buildings or roads. Impervious data estimate the hard-surface fraction within the mapped cell, so the countywide mean can be much lower than the developed-cover percentage.
The 1985–2025 map records class differences, not a single story of loss
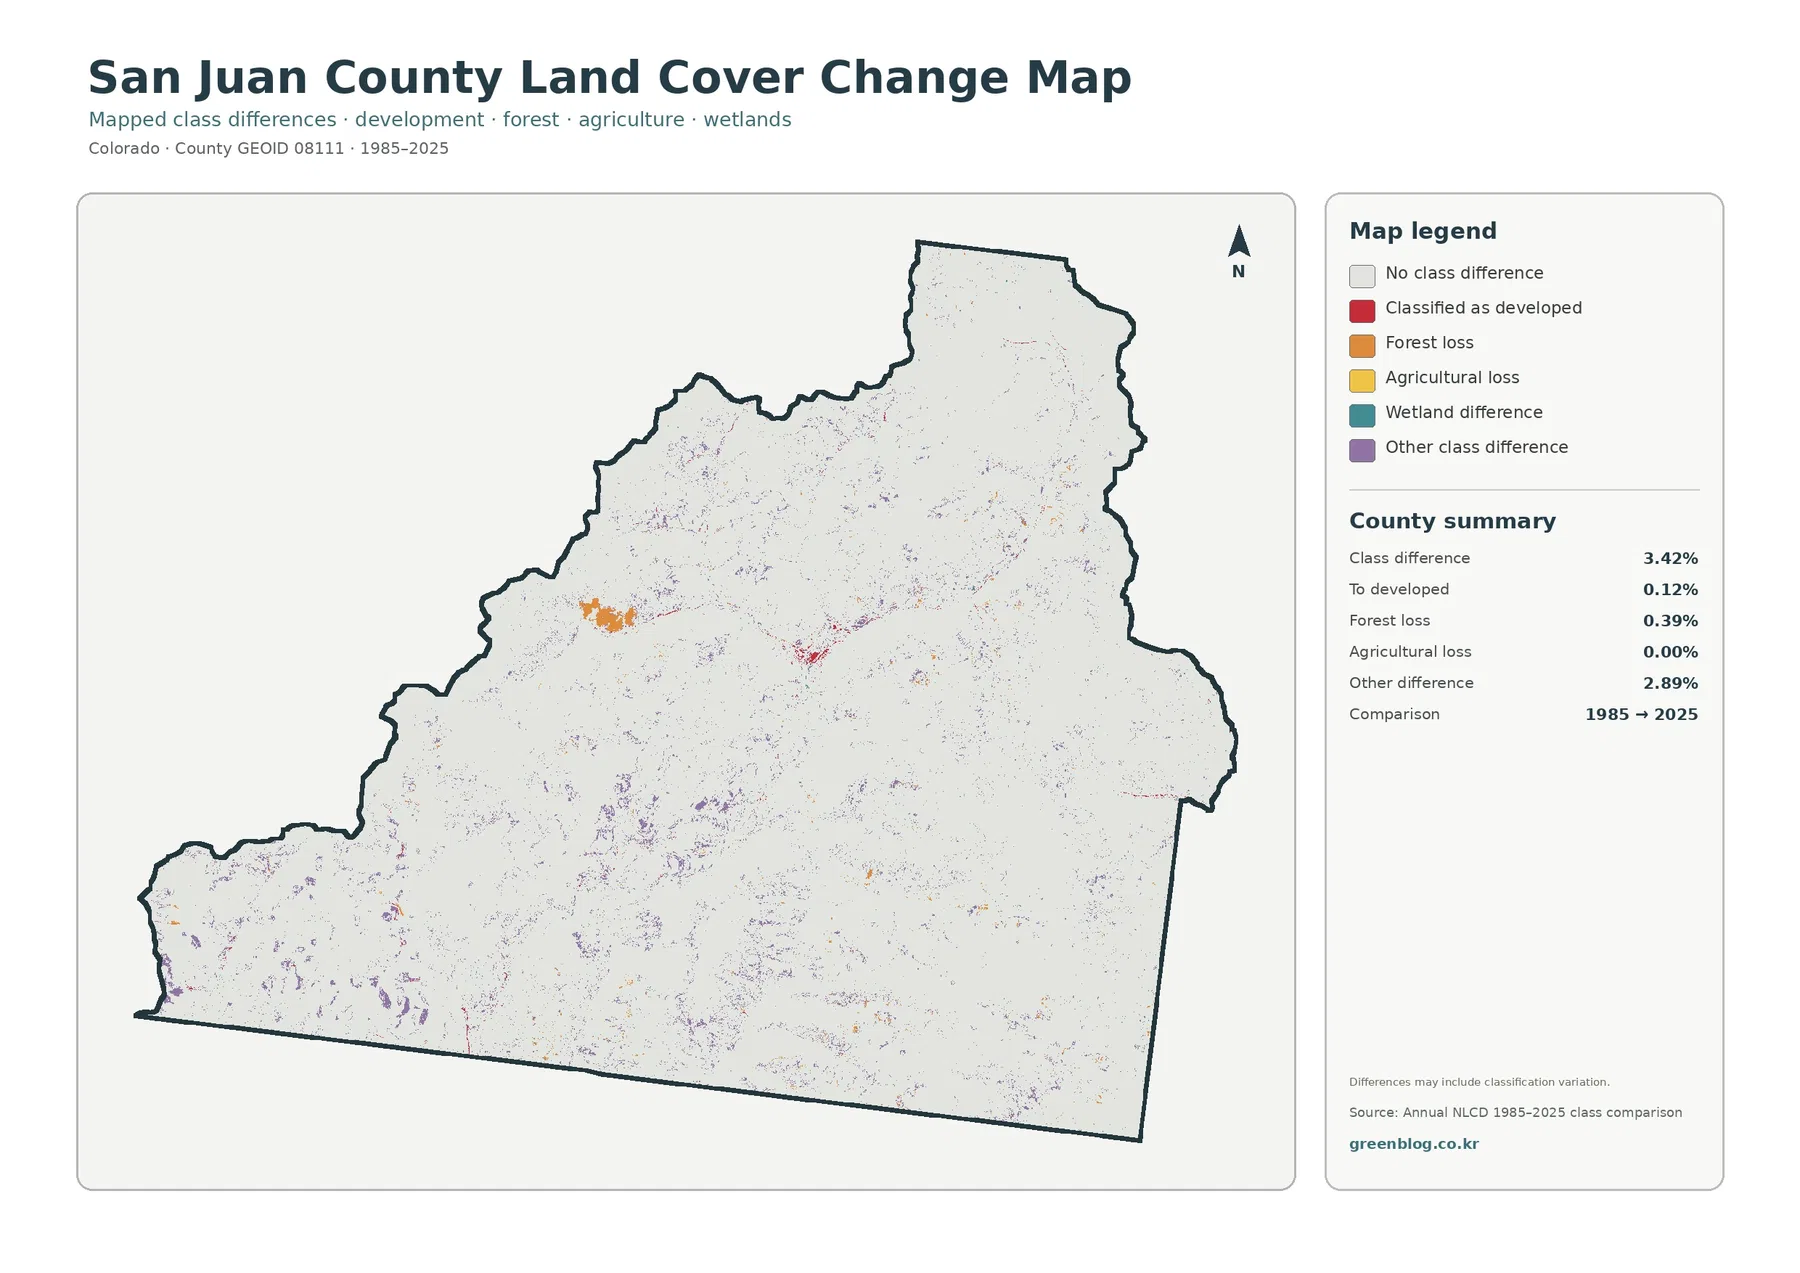
Only 3.42% of the county is marked as a different land-cover class between the 1985 and 2025 comparison layers. The summary identifies 0.12% as change to developed, 0.39% as forest loss classification, 0.00% as agricultural loss, and 2.89% as other class difference.
Most change pixels are scattered rather than forming one large continuous zone. A few orange forest-loss patches are more noticeable in mountain areas, while small red development changes appear near the central settlement. Purple and other small difference pixels are distributed much more widely, which is why the ‘other difference’ category makes up the largest part of the total.
The 3.42% figure is not a damage rate. It reports locations where two mapped years received different classes. Real land-cover change may contribute, but so can snow conditions, vegetation phenology, disturbance and recovery, image quality, mixed pixels, and classification methods. A high mountain county is especially sensitive to seasonal and surface conditions that can change the appearance of the same location.
The 0.39% forest-loss class deserves the same caution. It means a cell mapped as forest in 1985 was assigned another class in 2025. Determining whether a specific patch reflects fire, clearing, avalanche effects, natural succession, classification uncertainty, or another process requires intermediate-year imagery and local records.
High-elevation context helps explain what the colors do—and do not—mean
San Juan County’s official Road & Bridge information describes county roads at elevations from about 9,000 to 12,500 feet. That does not turn the land-cover map into an elevation map, but it provides useful context for the mix of forest, alpine grass, shrubland, barren slopes, and narrow wet areas visible across the county.
The county Planning page also provides separate zoning, avalanche-hazard, and geohazard maps. Those resources should not be merged conceptually with land cover. A barren patch in the NLCD map does not by itself identify an avalanche path, a geologic hazard, or a zoning designation. Each map has its own purpose and source.
The same caution applies to property and development questions. Land cover describes the surface, not ownership, parcel boundaries, permitted use, or building rights. Anyone using the map for a site-specific project should move from this broad county view to the county’s official property, zoning, hazard, and permit resources.
Practical ways to use the four-map set
- Use the 2025 land-cover map when you need one view of forest, grassland, shrubland, barren ground, wetlands, water, and developed cover.
- Use the forest and farmland map when the main question is how large forest blocks relate to open alpine vegetation and the near absence of mapped agriculture.
- Use the impervious and developed-land map to locate the compact hard-surface footprint around Silverton and the thin transportation traces extending away from town.
- Use the 1985–2025 comparison to identify places worth checking with newer imagery or local records, rather than treating every difference pixel as confirmed environmental loss.
For classroom or presentation use, the general map works well as the starting image because it preserves the full legend. The simplified forest/farmland map can follow when explaining the county’s strong natural-cover dominance. The impervious map then adds a useful scale contrast: a dense-looking town footprint is still very small when viewed against the entire county.
For watershed or habitat discussions, wetlands and water can be located first on the general map and then compared with surrounding forest, shrub, and grass classes. The change map can add a time dimension, but it should be presented with the year labels and the classification caveat so viewers do not read it as a direct measure of damage.
Download the four San Juan County JPG maps
The ZIP below contains the original JPG versions of all four maps described on this page. The set is useful for reports, classroom materials, local comparisons, presentations, or a quick visual reference when a single map does not answer every question. Keep the map year and legend visible whenever possible so the 2025 current-cover layers are not confused with the 1985–2025 comparison layer.
Frequently Asked Questions
What is the largest land-cover class in San Juan County?
Forest is the largest 2025 class at 40.74%. Grassland follows at 21.92%, shrubland at 17.09%, and barren land at 15.91%.
Which map is best for seeing development around Silverton?
The impervious surface and developed-land map is the clearest choice. It shows the county’s strongest hard-surface concentration around Silverton while most of the surrounding county remains very low in impervious cover.
Does the 3.42% 1985–2025 class difference equal environmental damage?
No. It is the share of cells assigned different land-cover classes in the two mapped years. Real change can contribute, but snow, vegetation condition, imagery, mixed pixels, and classification methods can also affect the comparison.
Map File Information
The ZIP includes four original JPG maps: 2025 land cover, forest and farmland, impervious surface and developed land, and 1985–2025 class differences.
- Included Files: Use only the versions confirmed in the article and supplied images
- File Type: Use the confirmed download contents
- Intended Use: Printing, education, presentations, and map-based projects
Related Maps
- Adams County Colorado Land Cover Map
- Alamosa County Colorado Land Cover Map
- Arapahoe County Colorado Land Cover Map
Sources and references
- MRLC Annual NLCD Data – land-cover and impervious-surface data
- USGS Annual NLCD Land Cover Classification – land-cover class definitions
- U.S. Census Bureau TIGER/Line Shapefiles – county boundary data
- San Juan County Colorado Official Website – county government and Silverton information
- San Juan County Road & Bridge – high-elevation county road context
- San Juan County Building & Planning – zoning, avalanche-hazard, and geohazard resources
Green Map creates custom-edited map images using open geographic data sources such as geoBoundaries, Natural Earth, OpenStreetMap, and government open data.
These maps are edited visual materials, not raw data files, and are provided for education, documents, presentations, and graphic reference.