The Boulder County Colorado Land Cover Map brings two very different Colorado landscapes into one county view. The 2025 land-cover summary is led by forest at 41.48%, but the eastern side contains broad developed, grassland, and agricultural areas. Developed cover accounts for 14.67%, grassland for 14.60%, shrubland for 12.40%, and agriculture for 8.59%. On the full map, the contrast is immediate: a dark-green mountain west gives way to a much more mixed eastern plains and foothills belt.
This page brings together four views: general land cover, forest and farmland, impervious surface, and mapped land-cover differences from 1985 to 2025. After comparing the maps on screen, you can download the four original JPG files in one ZIP for classroom work, regional reference, planning context, environmental presentations, or other projects that need a clear county-scale background.
Table of Contents
A forested mountain west meets a heavily settled eastern edge
Boulder County’s own geographic overview describes mountains in the west, foothills in the middle, and rolling plains farther east. That description matches the land-cover image closely. Forest forms a large, nearly continuous block through much of the western half, with shrubland, grassland, barren ground, and small water features interrupting the green in higher or more open terrain. The western pattern is broad and natural-looking rather than divided into the rectangular blocks that become common on the plains.
East of the mountain front, the map becomes much more varied. Red developed land spreads through several large clusters, while yellow agricultural blocks, light-green grassland, blue water, and teal wetlands fill the spaces between them. Boulder County lists Boulder, Longmont, Lafayette, Louisville, Erie, Superior, Lyons, Nederland, Jamestown, and Ward among its incorporated municipalities. The land-cover image does not label those city boundaries, but the eastern plains and foothills zone where many of the county’s larger communities lie is also where developed cover is most concentrated.
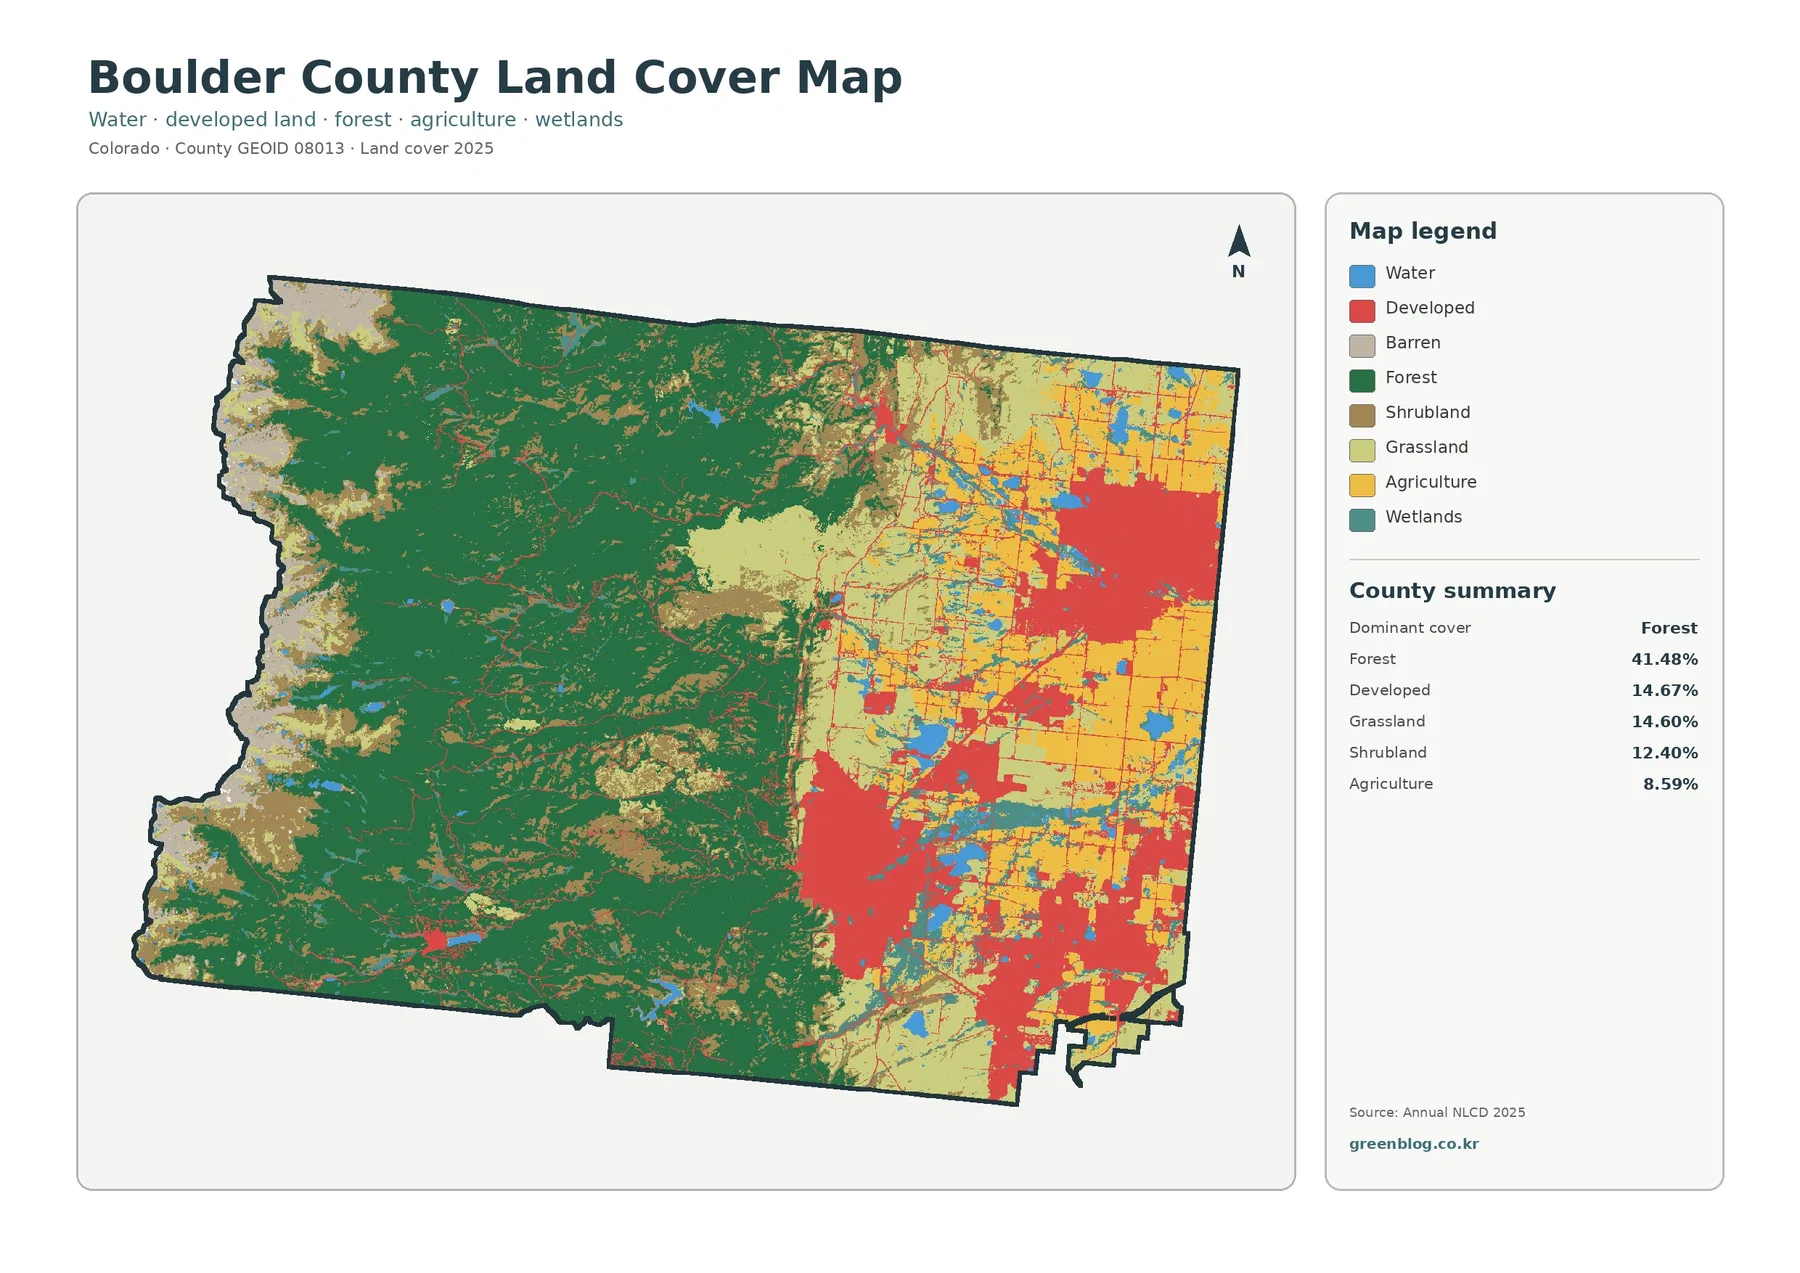
The legend separates water, developed land, barren land, forest, shrubland, grassland, agriculture, and wetlands. These categories describe what covers the ground in the source imagery. They are not zoning districts, parcel ownership records, building permits, or legal land-use designations. A cell classified as developed may still contain trees, lawns, or exposed soil, and a cell classified as agriculture does not identify a particular farm operator, crop, or property boundary.
The percentages also show why Boulder County cannot be summarized simply as either a mountain county or an urban county. Forest is clearly the largest class at 41.48%, yet developed land and grassland are almost tied at 14.67% and 14.60%. Shrubland adds another 12.40%, while agriculture contributes 8.59%. The most useful feature of the map is therefore the transition between these classes: dense forest in the west, a mixed foothills zone, and a more fragmented eastern landscape where cities, fields, grass, water, and wetlands occur close together.
The forest-and-farmland view makes the foothills transition easier to follow
The simplified forest-and-farmland map removes some of the visual competition from the full legend. Dark green still fills most of the west, but the eastern edge of that forest becomes easier to trace against shrub/grass cover and the agricultural blocks beyond it. Cropland appears most often as yellow rectangles and larger field groups on the eastern plains. Pasture and hay add another lighter agricultural class, while developed or other land is pushed into a neutral background.
Agriculture represents 8.59% of the NLCD county summary, so fields are visually important without being the dominant countywide cover. Boulder County Parks & Open Space separately reports that it owns about 25,000 acres of agricultural land and leases that land to qualified operators. The county’s agriculture program also distinguishes irrigated cropland, dryland cropland, range, and land out of production. Those management acreages are not the same dataset as the NLCD land-cover percentage, so they should be used as local context rather than combined mathematically with the 8.59% map value.
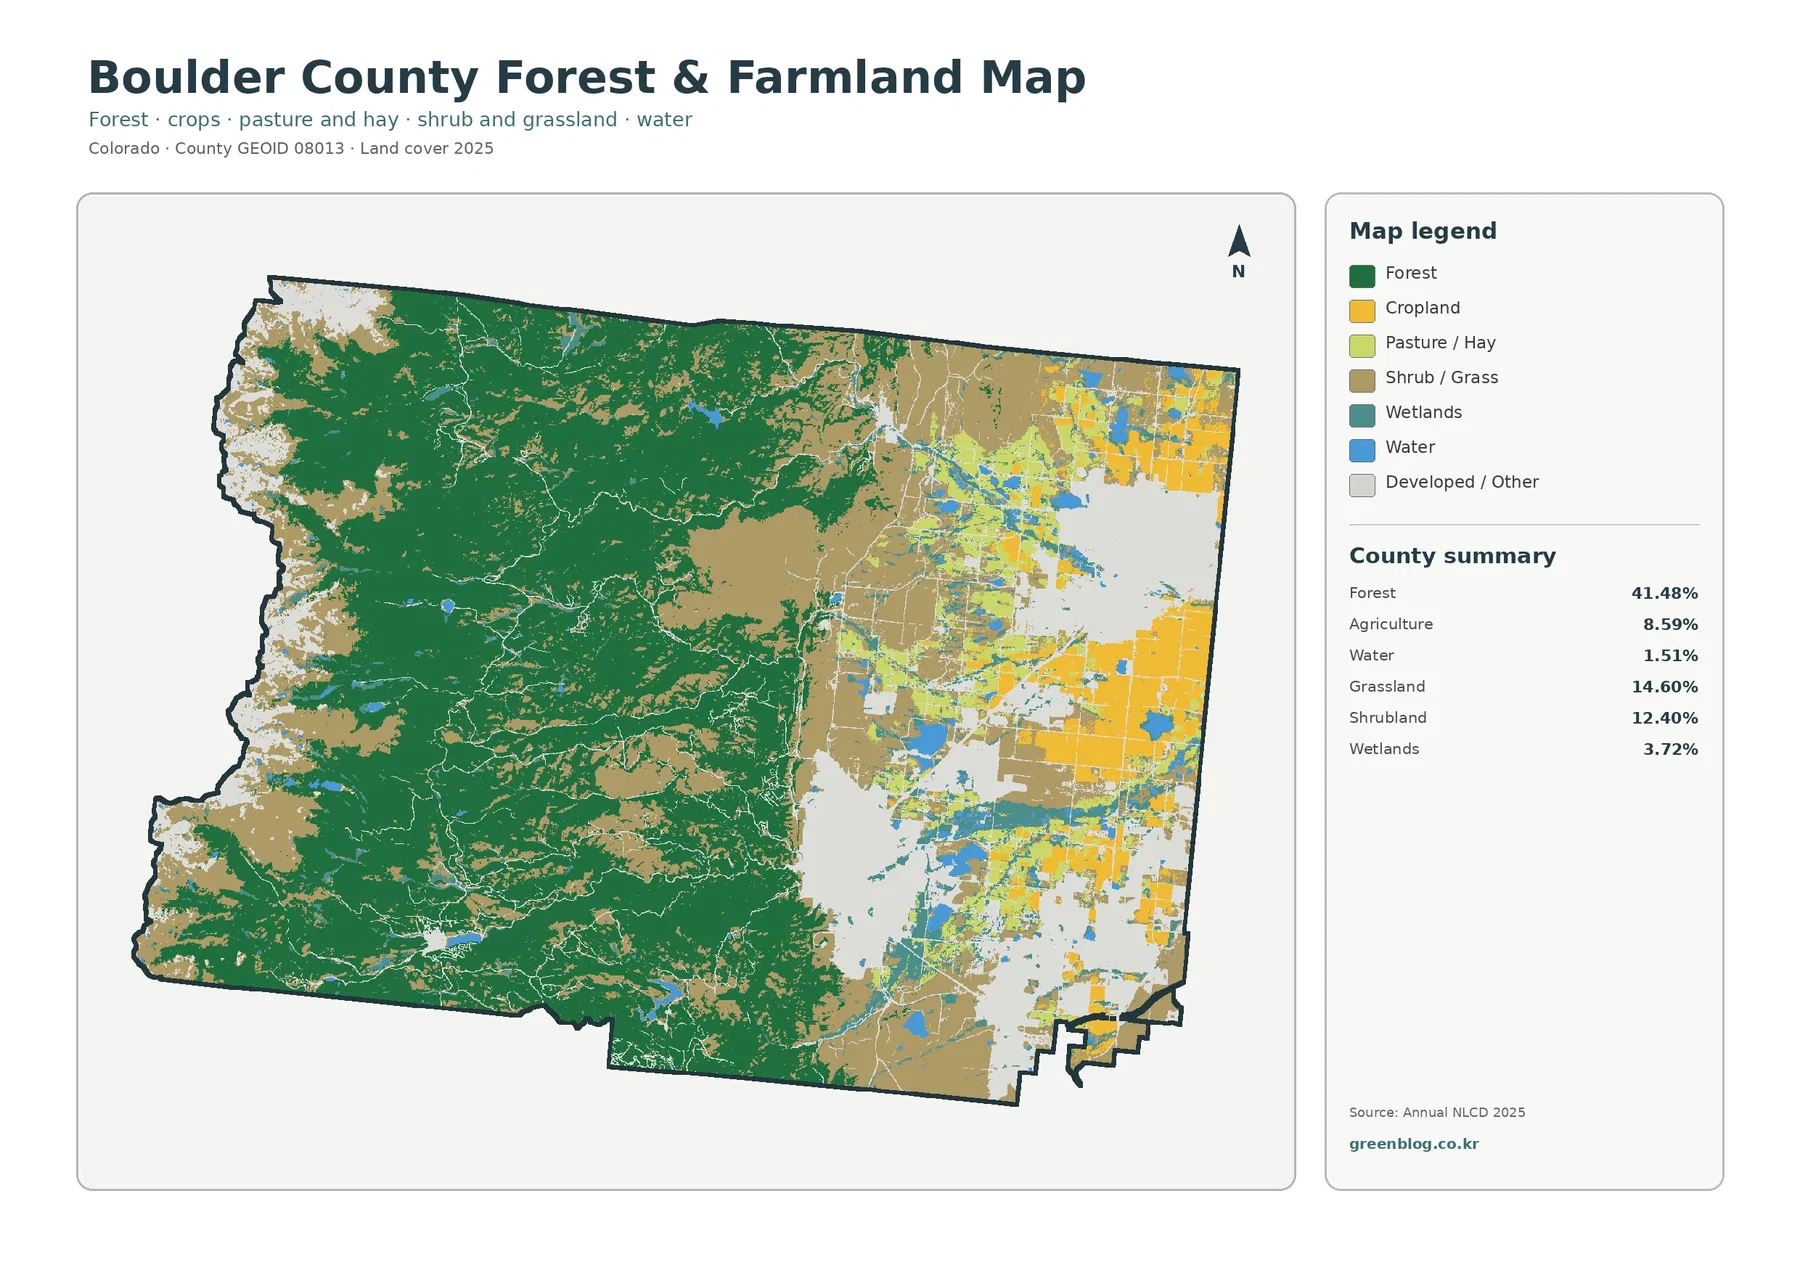
Water covers 1.51% of the 2025 summary and wetlands cover 3.72%. On this map, blue water features occur in both the mountain and plains portions of the county, while teal wetlands appear as separate patches and narrow areas. That distinction matters. Open water in a reservoir or pond is not the same land-cover class as wet vegetation or saturated ground along its edge, and a narrow stream may be too small to appear with the same clarity as a large water body at county scale.
The county’s geographic overview names the North and South St. Vrain, Left Hand, North Boulder, and South Boulder creeks as drainage routes from the mountains toward the plains. This land-cover map is not a hydrography map and does not label those channels, but the official description helps explain the broader setting in which blue water and wetland classes occur. For an exact stream centerline, floodplain, or reservoir boundary, a dedicated water or hazard layer is more appropriate than this generalized land-cover product.
The western forest block also deserves a scale check. Boulder County Parks & Open Space says it manages more than 30,000 acres of forest in the foothills and mountains. That management figure covers county-managed forest, not every forest pixel in Boulder County. The 41.48% NLCD value instead summarizes the countywide classified surface. Keeping those two ideas separate prevents a common mistake: treating an agency’s managed acreage as though it were the same thing as a remote-sensing land-cover class.
Hard surfaces cluster in the east while the mountain interior stays mostly light
The impervious-surface map estimates pavement, rooftops, and other hard materials that do not readily absorb water. Boulder County has a mean impervious value of 5.84%, and 4.76% of the county is mapped at 50% impervious or higher. Those numbers are countywide averages and area summaries, so a particular city block can be much higher even though the county as a whole remains low because so much western land is forested or open.
The image makes that imbalance easy to see. Most of the western mountain area is nearly white, with only thin lines and small isolated marks. Orange and red become much more common near the foothills and spread across several large eastern clusters. The northeastern, east-central, and southeastern developed areas contain the strongest concentrations. The map does not draw municipal borders, but the pattern is consistent with the county’s concentration of larger towns and cities on the plains side of the mountain front.
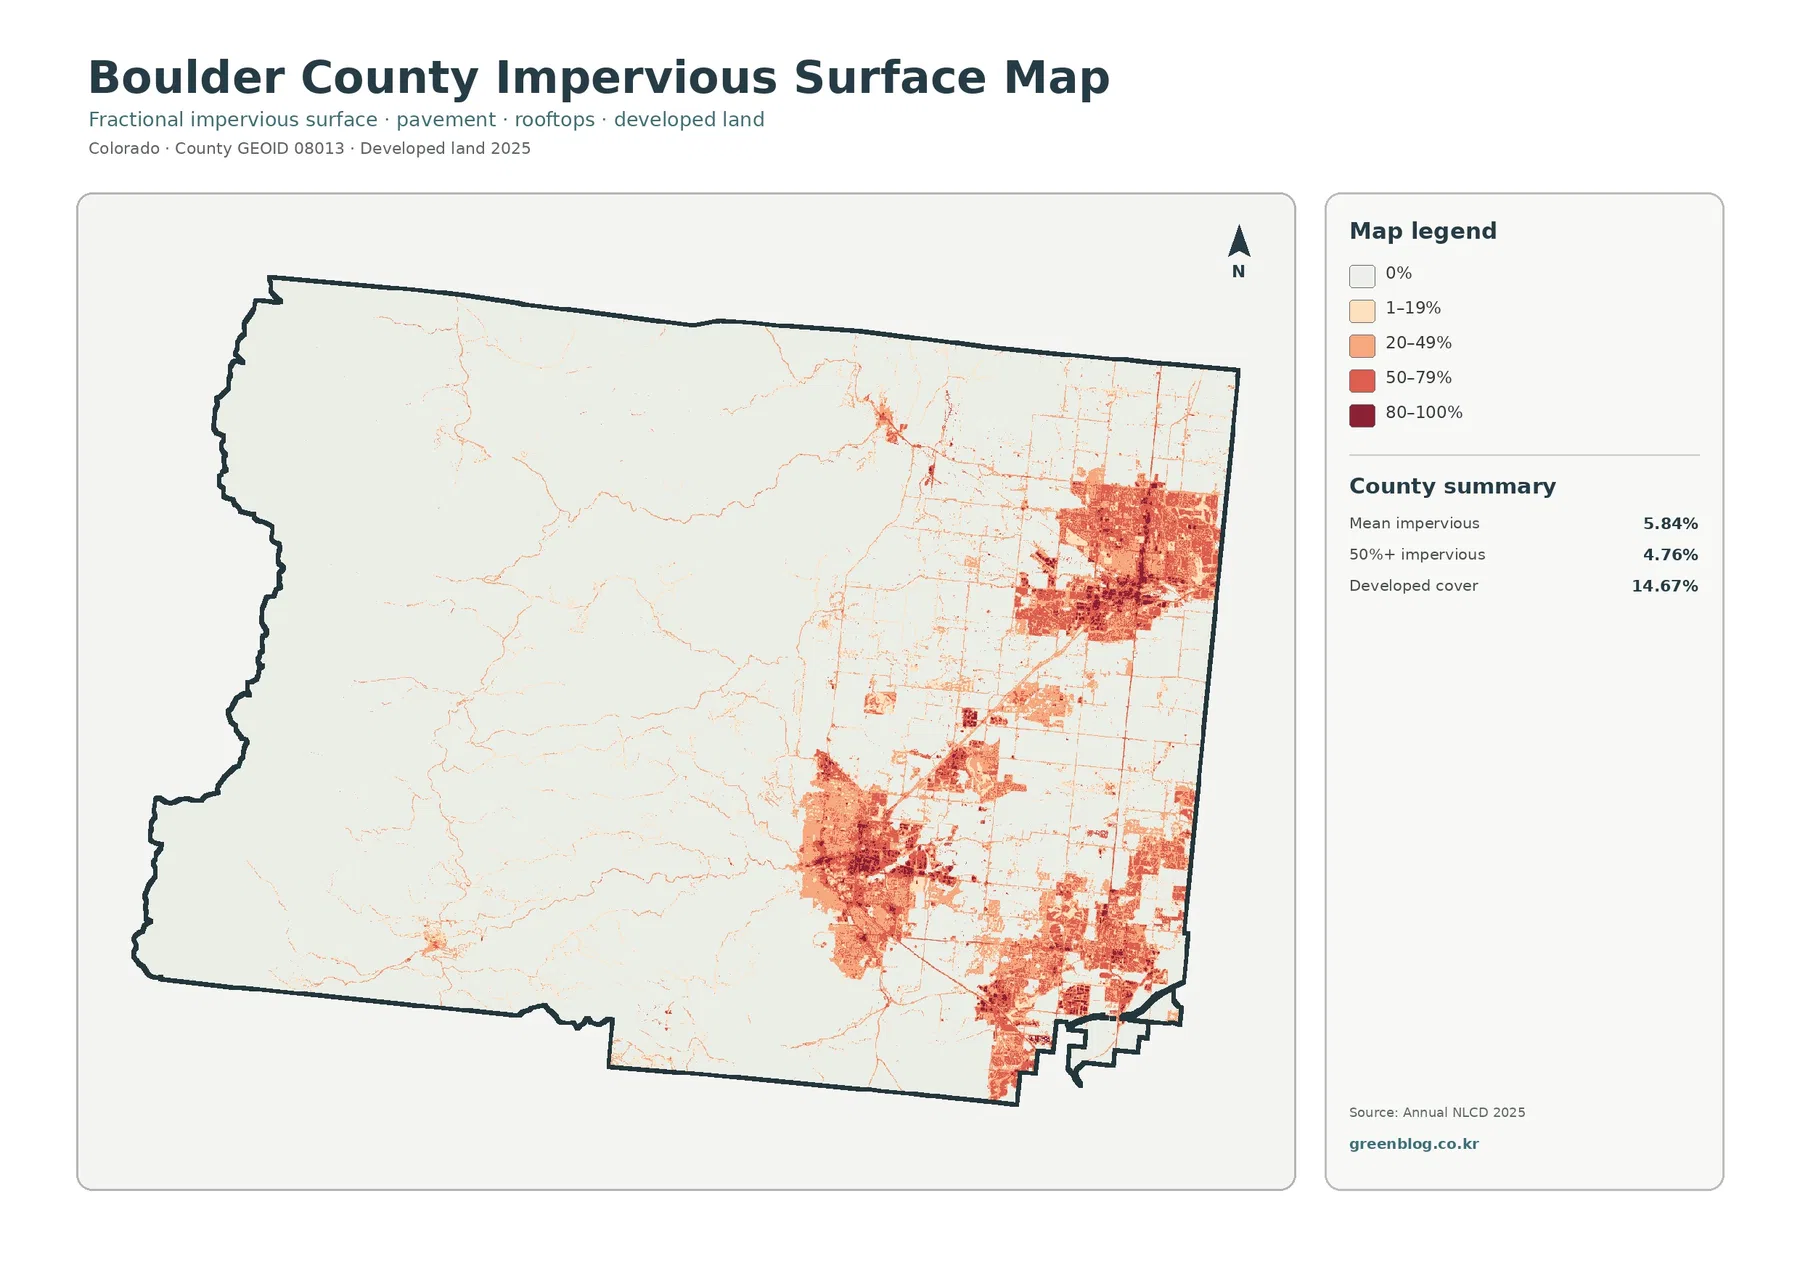
Developed cover at 14.67% should not be treated as another way of saying 14.67% impervious. The two products measure different things. A developed land-cover cell can contain buildings and roads mixed with vegetation or bare soil, especially in low-density residential areas. The impervious layer instead estimates the share of the cell occupied by hard surface. A neighborhood with lawns and trees can therefore count as developed land while still having a much lower impervious percentage.
This layer works best for comparing concentrations, edges, and corridors. It can help a reader see where built surfaces become dense, where they thin toward open land, and how sharply the eastern urban pattern differs from the western mountains. It is not a building-footprint or road-width survey. A raster cell can contain a street, roof, yard, and tree canopy at the same time, so parcel-level engineering, drainage, or site design requires more detailed local data.
The map is also useful when paired with the general cover image around the urban fringe. A red developed area on the land-cover map may transition gradually into grassland or agriculture, while the impervious map can show whether hard surfaces remain dense or quickly fade. That comparison gives more information than either map alone, especially in a county where major urban areas sit directly beside open space, agricultural land, and foothills.
The 1985–2025 comparison separates eastern development from western forest differences
The long-term comparison marks a class difference across 17.31% of Boulder County. Of the categories summarized on the map, 4.57% is classified as change to developed land, 3.26% as forest loss, 2.31% as agricultural loss, and 6.99% as other class differences. Large red development-change patches are concentrated in the east, while orange forest-difference areas appear mainly in the mountain and foothill portion of the county.
Comparing this image with the current impervious map is especially informative. Many of the broad eastern areas that now contain dense hard surfaces also fall within the wider part of the county where development-class changes are visible. That is a spatial comparison, not proof of a specific cause. The map does not contain subdivision approvals, road construction dates, annexation records, or building permits, so it cannot say which project produced an individual change pixel.
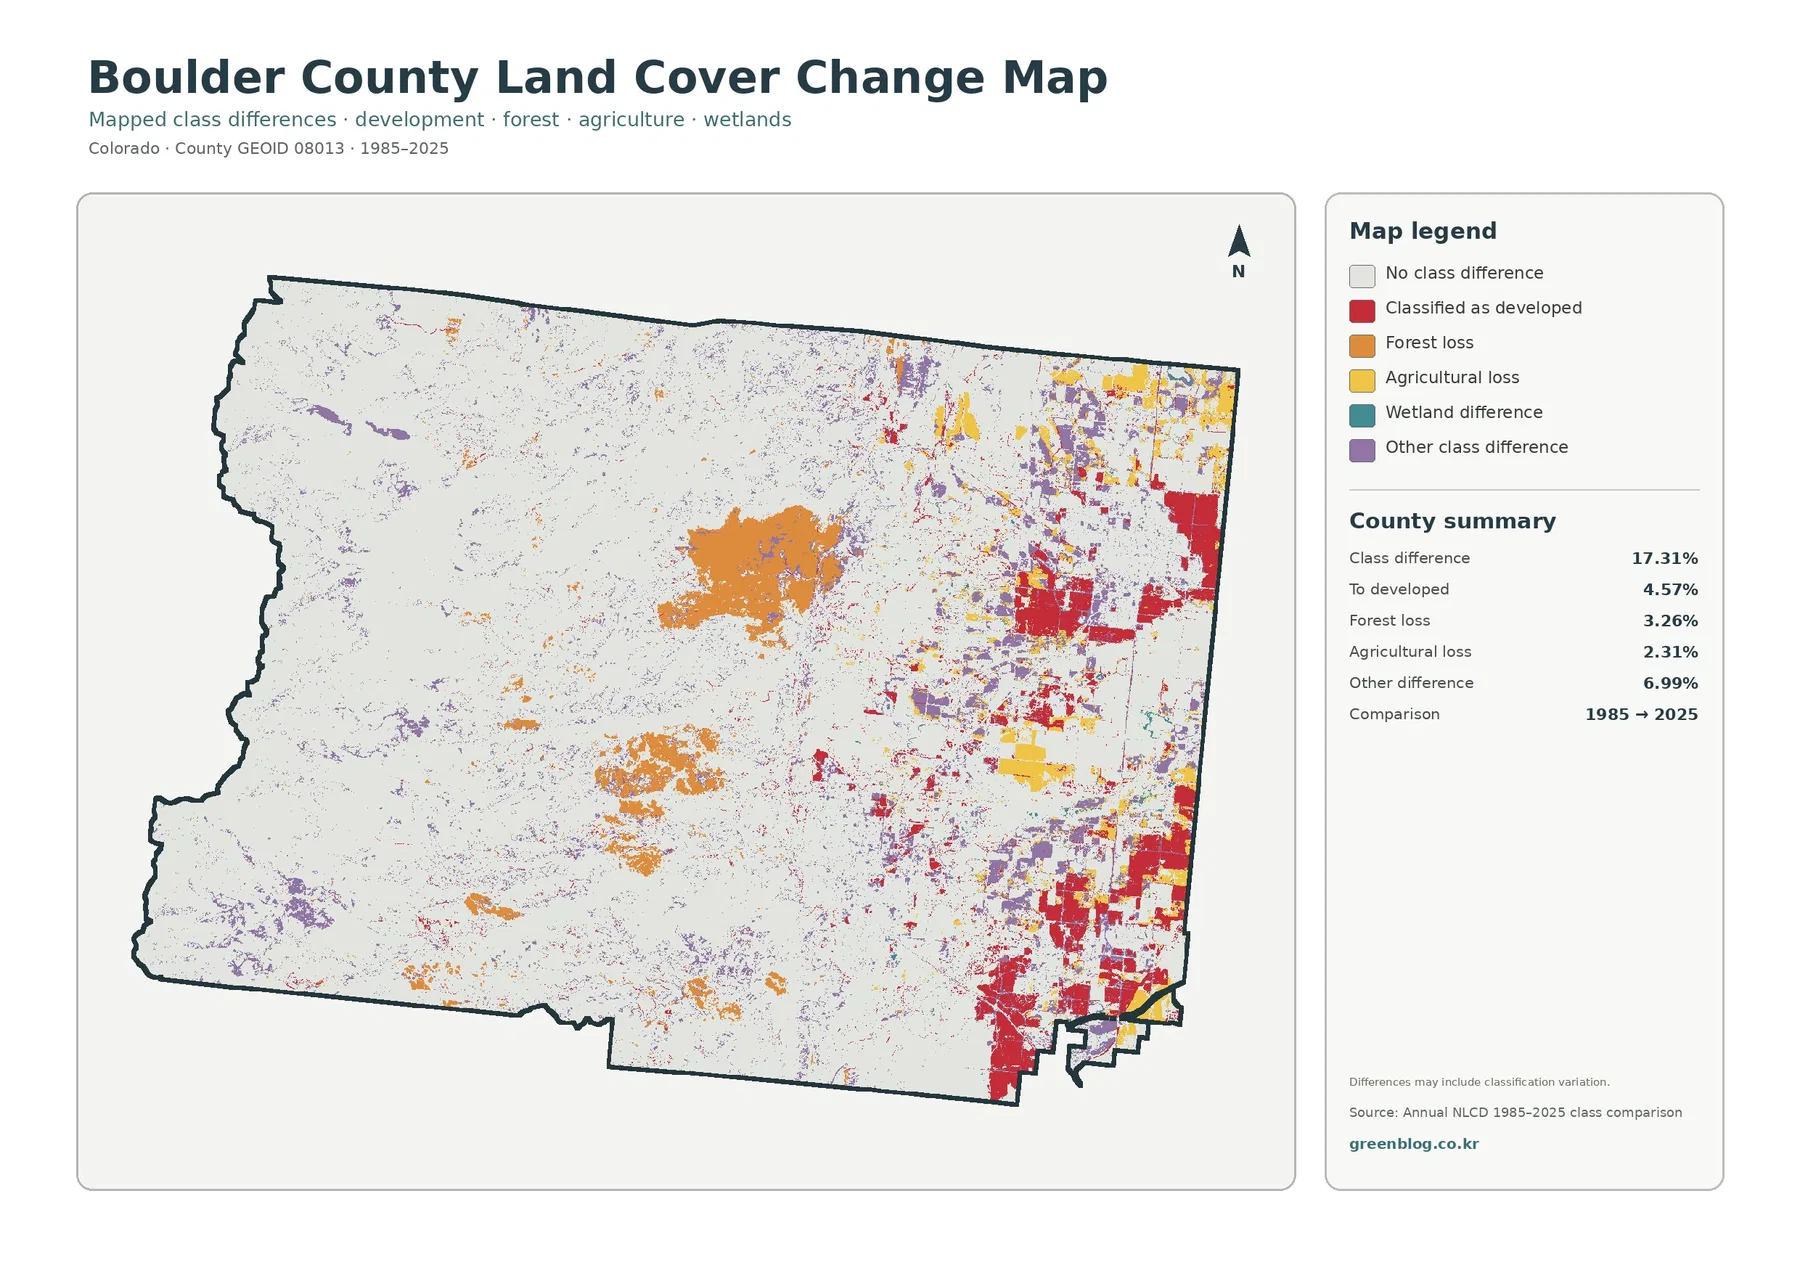
“Forest loss” also needs careful wording. The 3.26% figure identifies cells that no longer match the forest class between the two comparison endpoints; it is not automatically an acreage of permanent deforestation or timber harvest. Fire, tree mortality, thinning, vegetation recovery stage, classification differences, or real conversion to another cover can all affect a long-term class comparison. Boulder County’s forestry program documents active forest-health work, fuels reduction, prescribed burning, and restoration, but those program descriptions do not identify the cause of each mapped change cell.
The same caution applies to the 2.31% agricultural-loss category. It shows a change away from the agricultural class in the two-endpoint comparison. It does not by itself demonstrate that farming permanently ended, that a parcel changed ownership, or that zoning changed. A field may appear differently because it was fallow, converted, revegetated, developed, or classified differently at one observation. To investigate a particular site, the change layer should be paired with annual imagery, agricultural records, and parcel or planning information.
The map also contains a large “other class difference” component at 6.99%. That broad category is a reminder not to reduce forty years of surface change to only development and forest. Shrubland, grassland, barren land, water, wetlands, and other classes can shift between endpoints, and the map itself warns that differences may include classification variation. The safest use is to locate areas worth closer study, then bring in a more specific dataset for the question being asked.
Reading all four maps turns a simple county outline into a landscape transect
A practical reading order starts with the general land-cover map. Use it to establish the broad west-to-east contrast and the relative importance of forest, developed land, grassland, shrubland, agriculture, water, and wetlands. Move next to the forest-and-farmland view to simplify that picture and isolate the mountain forest edge, the plains farm blocks, and the open grass/shrub areas between them. This makes the foothills transition easier to describe without losing the countywide setting.
The impervious map then answers a different question: where are hard surfaces actually concentrated within the broader developed class? In Boulder County, the answer is overwhelmingly the eastern side. Finally, the change map adds time by showing where the 1985 and 2025 classifications differ. Keeping those four questions separate prevents a common problem in map interpretation, where current cover, hard-surface intensity, and long-term change are blended into one conclusion even though they are separate measurements.
For classroom use, the county is a strong example of how topography and settlement can be compared without assuming that one directly causes every pattern on the map. Students can describe the broad forested mountain west, the mixed foothills, and the urban/agricultural east, then ask what additional evidence would be needed to explain the history behind those patterns. The exercise works equally well for discussing land-cover classification, map scale, mixed pixels, and the difference between a visual association and a proven causal relationship.
For environmental or planning presentations, the maps can provide context before more specialized layers are introduced. The forest map can frame a discussion of mountain resources, the agriculture view can show where farm cover occurs on the plains, and the impervious layer can show concentrations of built surface. A watershed project can use water and wetland classes as a broad background, but it should switch to hydrography, floodplain, or wetland inventory data when exact channel or regulatory boundaries matter.
Boulder County’s open-space program reports more than 100,000 acres of protected open space and emphasizes natural, cultural, and agricultural resource conservation. That information helps explain why local land management involves more than a simple urban-versus-rural divide. Still, an open-space ownership or conservation-easement map is a different dataset from the land-cover images here. A forest pixel can be public or private, and agricultural cover can occur inside or outside protected land. The maps should be used to describe surface cover, not ownership status.
Scale, mixed pixels, and observation dates matter when the pattern gets small
Annual NLCD is raster data, meaning the landscape is divided into grid cells and each cell receives a class or a percentage value. A real location can contain several materials within one cell: tree canopy, grass, pavement, a roof, and exposed soil may all be present together. The final map simplifies that mixture. This is why a narrow road, small pond, thin riparian strip, or single building may not match its exact real-world outline at the county scale.
The 2025 map is also a dated observation, not a live land-status display. Fire, construction, vegetation recovery, agricultural rotation, reservoir levels, and other surface conditions can change after the source year. The 1985–2025 comparison is even more specific: it compares two endpoints and does not describe every event that happened in the forty years between them. A site that changed several times may appear simply as one endpoint difference, while another site may look unchanged even though temporary changes occurred in the middle of the period.
Legal land use is another separate issue. Boulder County’s Land Use Code guides development in unincorporated parts of the county, but the maps on this page do not display those regulations. Forest cover does not mean development is legally prohibited, and developed cover does not prove that every structure or use is permitted. Questions about zoning, parcel ownership, conservation restrictions, permits, or buildability require the relevant county or municipal records.
Those limitations do not make the land-cover set less useful. They define the scale at which it is strongest. At county level, the four images provide a clear way to compare the mountain forest, plains agriculture, urbanized eastern edge, water and wetland patches, hard-surface concentrations, and broad long-term class differences. They are best treated as a regional reference and a starting point for more detailed investigation.
Boulder County Colorado Land Cover Map: Four JPG files to download
The download ZIP contains the original supplied JPG versions of the general land-cover, forest-and-farmland, impervious/developed-land, and 1985–2025 change maps. Each JPG is 2480×1754 pixels. The package does not mark these source files as meeting its A3 high-resolution reference, so they are provided at their original dimensions rather than being enlarged or re-encoded and described as higher resolution. Check text legibility at your intended print or document size before final output.
Frequently Asked Questions
What is the largest land-cover class in Boulder County?
Forest is the largest 2025 class at 41.48%. It is concentrated mainly in the western mountain part of the county. Developed land is 14.67%, grassland 14.60%, shrubland 12.40%, and agriculture 8.59%. The important visual feature is not only the size of the forest class but the sharp shift from that forested west to the mixed urban, grassland, and agricultural east.
Why is developed cover 14.67% when mean impervious surface is only 5.84%?
They measure different properties. Developed land-cover cells can include lawns, trees, soil, and other vegetation mixed with roads and buildings. Impervious surface estimates the share of a cell covered by hard materials such as pavement and rooftops. A low-density developed area can therefore count as developed without being mostly impervious, so the two countywide values should not be expected to match.
Does the 3.26% forest-loss value mean that much forest was permanently cleared?
No. It means 3.26% of the county is represented in the comparison as a change away from the forest class between the 1985 and 2025 endpoints. Real forest loss may be part of that result, but fire, management, recovery stage, observation conditions, and classification differences can also matter. Determining the cause at a specific site requires additional imagery, forest records, and time-series data.
Sources and Reference Material
- MRLC Annual NLCD Data — official access point for Annual NLCD land-cover data.
- USGS Annual NLCD Land Cover Classification — official explanation of the land-cover classes used to interpret the maps.
- Boulder County – About Boulder County — county overview of the mountains, foothills, plains, and major drainage setting.
- Boulder County Forest Management — local information on county-managed forest, forest health, restoration, and fire-related management.
- Boulder County Agricultural Lands on Open Space — local information on county-owned agricultural land and agricultural management.
Map File Information
The ZIP includes four original Boulder County JPG maps: general land cover, forest and farmland, impervious/developed land, and 1985–2025 land-cover change.
- File Type: Four JPG files in one ZIP archive
Related Maps
- Adams County Colorado Land Cover Map
- Alamosa County Colorado Land Cover Map
- Arapahoe County Colorado Land Cover Map
Green Map creates custom-edited map images using open geographic data sources such as geoBoundaries, Natural Earth, OpenStreetMap, and government open data.
These maps are edited visual materials, not raw data files, and are provided for education, documents, presentations, and graphic reference.