Palm Beach County has a land-cover pattern that changes dramatically from west to east. The supplied 2025 summary lists wetlands at 32.66%, agriculture at 31.11%, developed land at 23.15%, water at 12.03%, and grassland at 0.42%. The Palm Beach County Florida Land Cover Map makes those percentages easier to understand because the major classes occupy large, distinct parts of the county rather than being evenly mixed.
This page includes four related views: 2025 land cover, forest and farmland, impervious surface and developed land, and a 1985–2025 class comparison. The WebP images are shown in the article for quick reference, and the four original JPG maps are available together in one ZIP download. Use the set to compare broad surface cover, working land, hard-surface intensity, and locations where the mapped class differs between the two dates.
Table of Contents
Water and farmland dominate the west while developed land fills much of the east
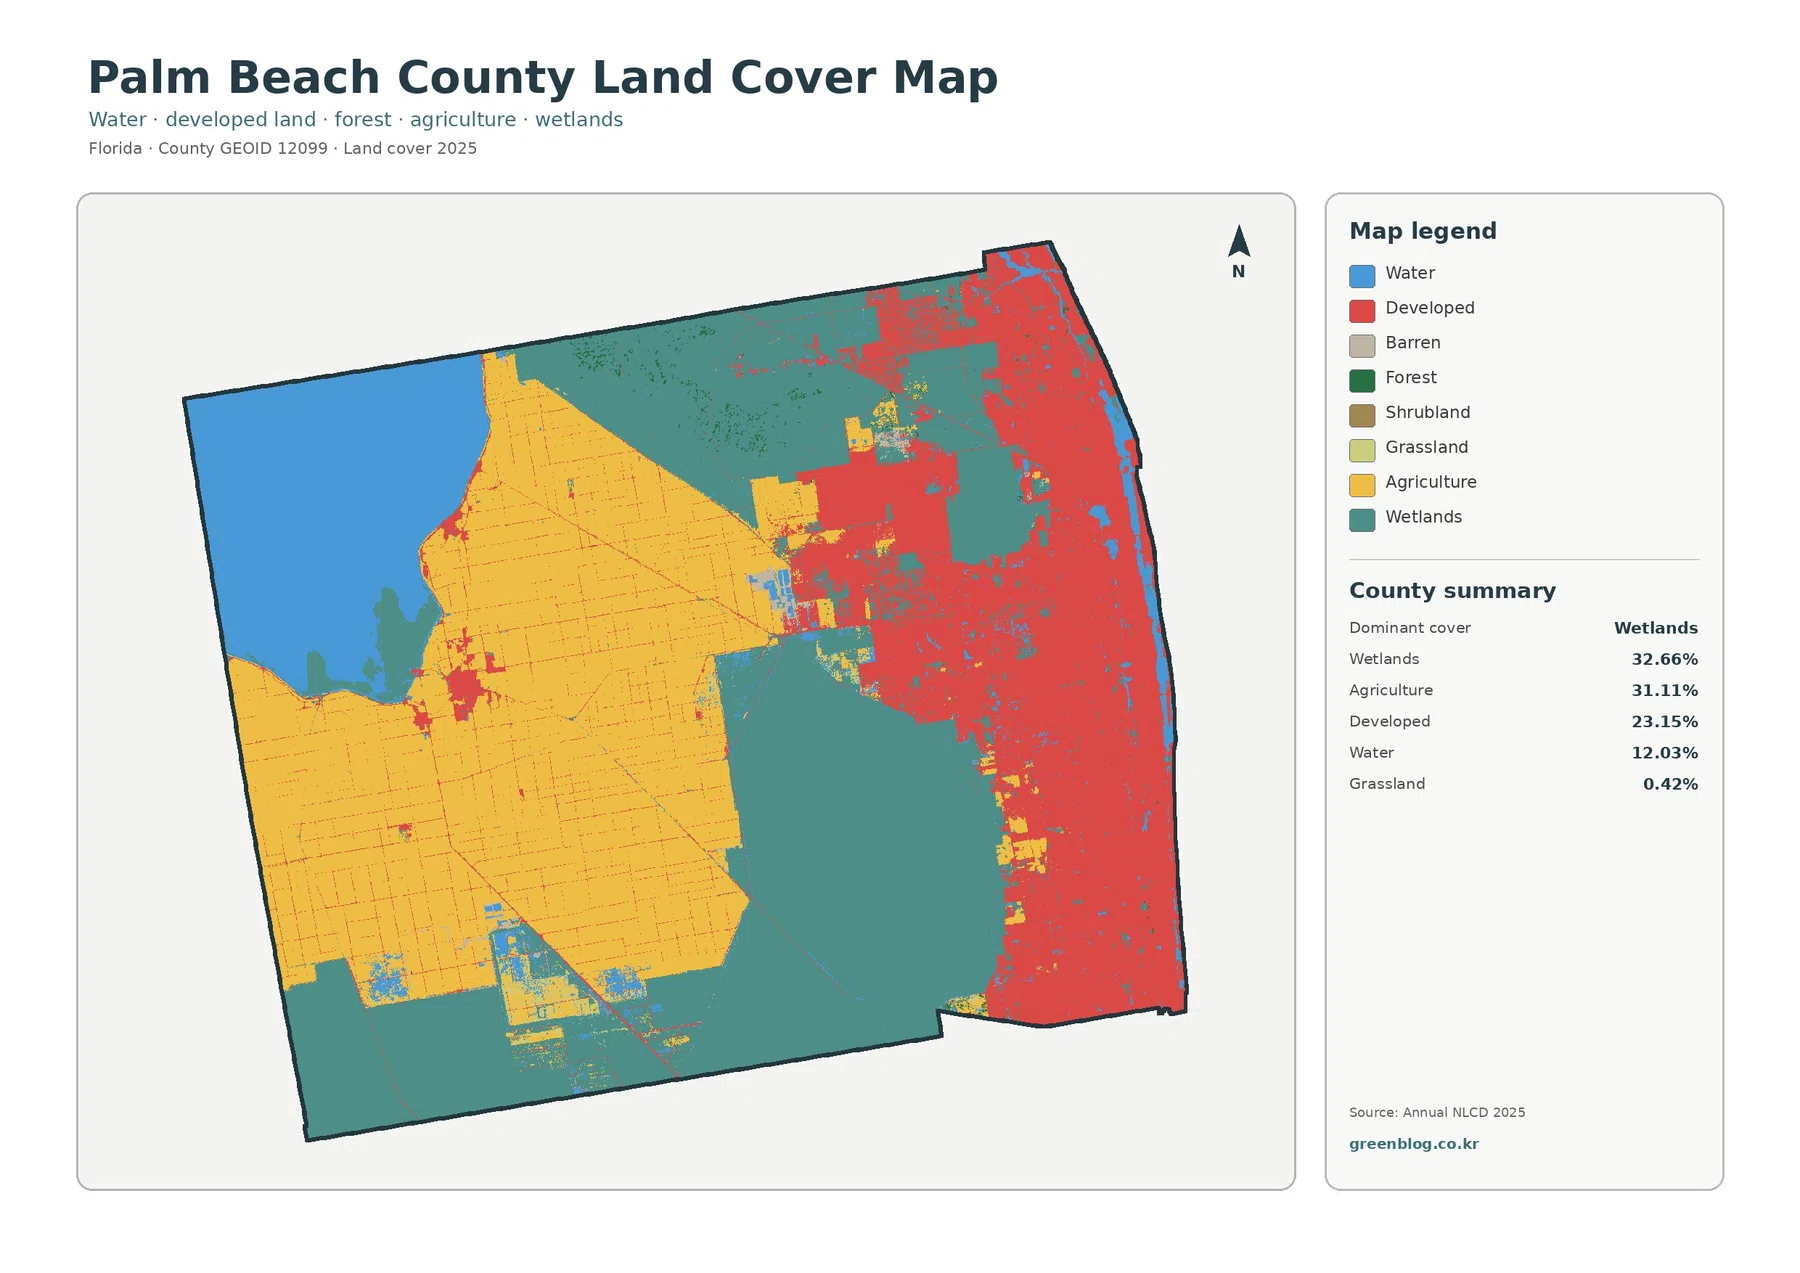
The western side of the general map is anchored by a large water area, with extensive agricultural cover immediately to the south and east. Water accounts for 12.03% of the county summary, and agriculture reaches 31.11%. The agricultural color spreads across a broad western and southwestern area rather than appearing as a few isolated fields. Smaller agricultural sections continue toward the center, where they meet wetlands and developed land.
Wetlands are the largest single class at 32.66%. They occupy large areas through the center and south, with additional wet sections farther north. Open water and wetlands should be read separately. A wetland may contain saturated ground, seasonal water, and wetland vegetation without being mapped as a blue open-water surface, so the 32.66% wetland share is not another way of stating the 12.03% water share.
Developed land covers 23.15%, but its location makes it especially prominent. Much of the eastern side is shown as developed, and the red class extends inland in several broad areas. This category describes surface cover, not zoning or legal land use. A developed land-cover cell can contain buildings and pavement along with lawns, trees, or other permeable surfaces. It does not identify property ownership, allowable development, or a parcel boundary.
The vegetation view is most useful for separating farmland from the surrounding wetlands
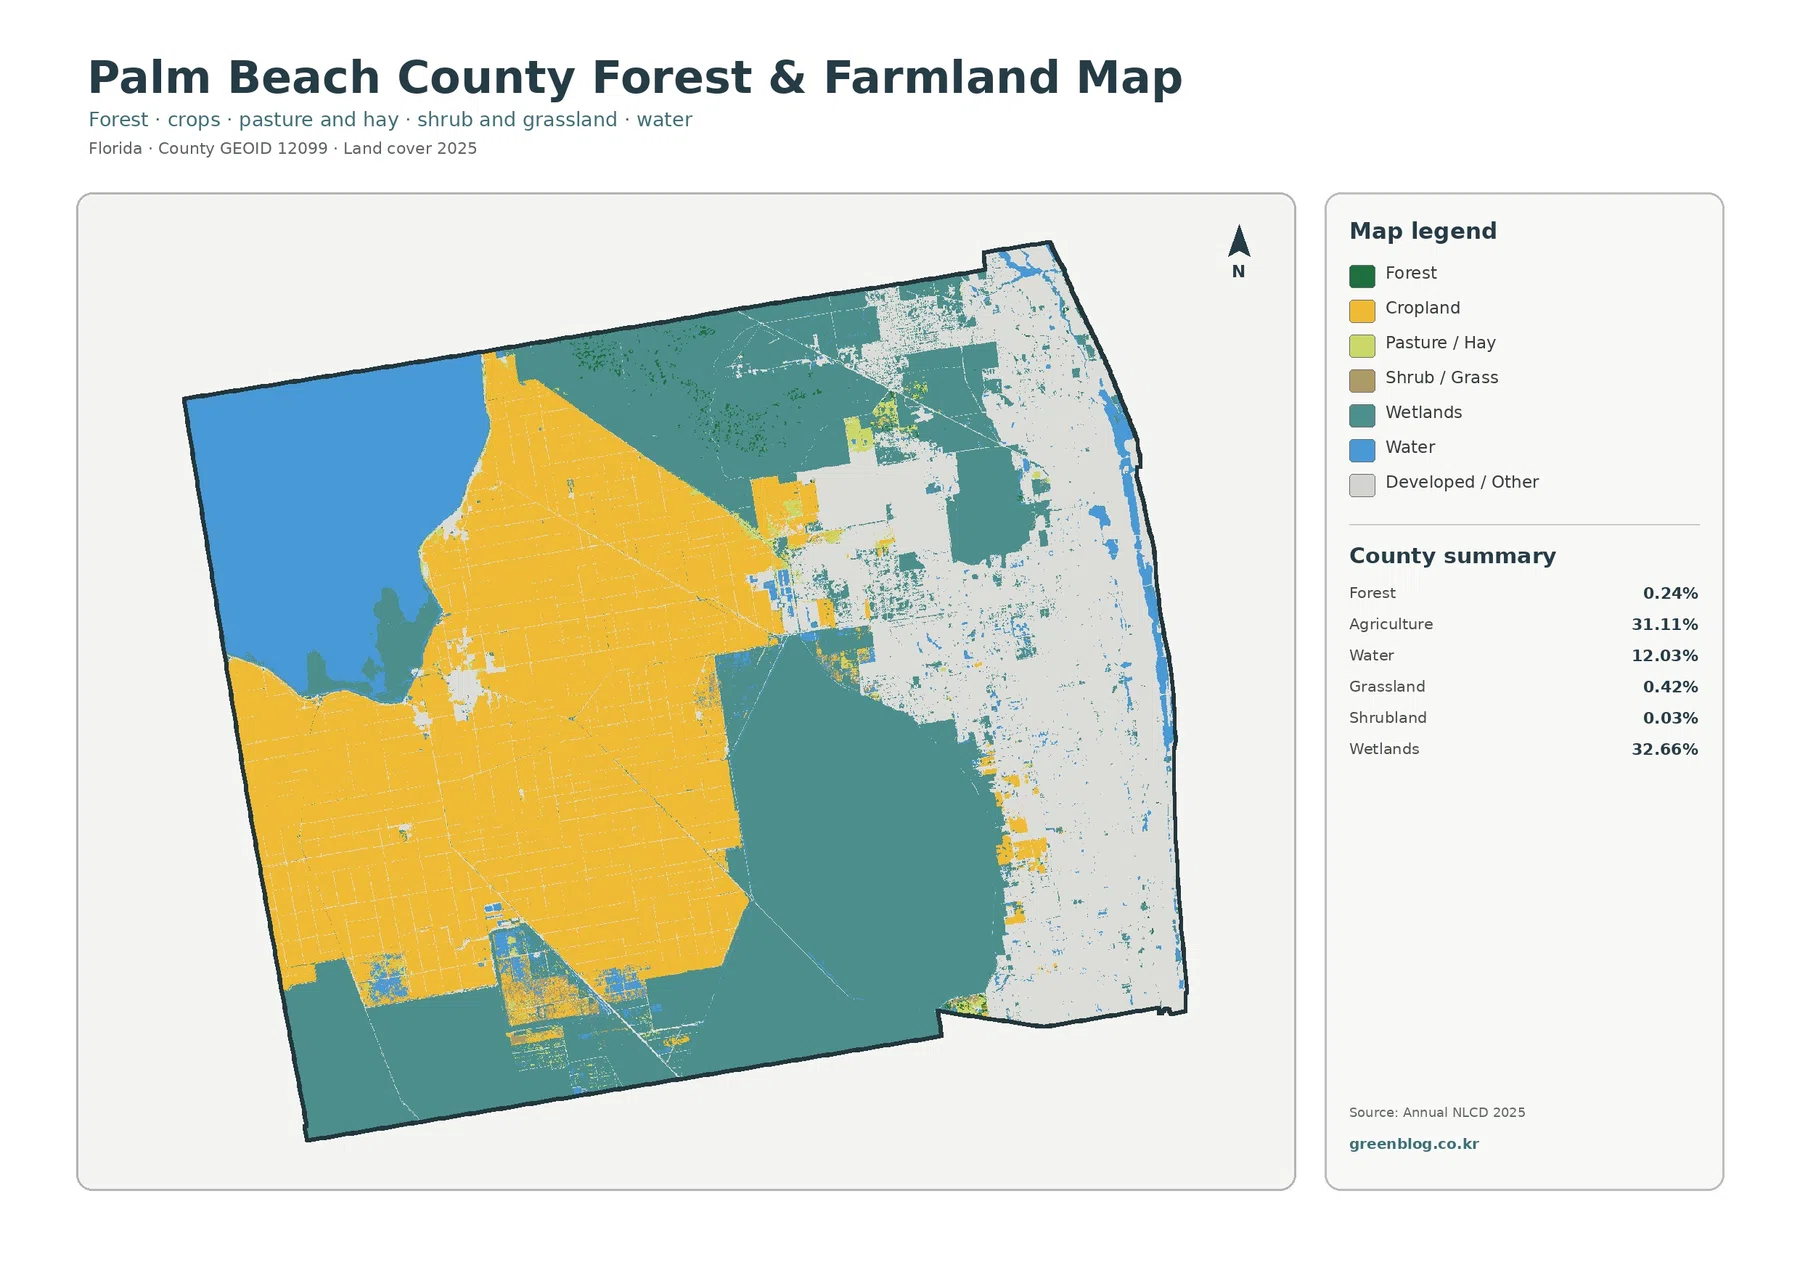
The forest-and-farmland map makes the western agricultural area easier to follow because developed land is no longer the main visual emphasis. Agriculture remains 31.11%, while wetlands account for 32.66% and water for 12.03%. The western and southwestern agricultural area forms one of the largest continuous mapped surfaces, but broad wetland areas remain close by in the center and south.
Forest is summarized at only 0.24%, grassland at 0.42%, and shrubland at 0.03%. Those values are useful precisely because they prevent the reader from assuming that every green-looking or vegetated area belongs to the forest class. In this county, the mapped vegetation story is much more about agriculture and wetlands than about upland forest. Wetland vegetation can still be extensive even when the forest category itself is very small.
Palm Beach County also has an officially recognized Agricultural Reserve that is managed through county planning policy. That context helps explain why agriculture remains important in local planning, but the yellow land-cover class should not be treated as the legal boundary of the Agricultural Reserve. A planning tier is defined by policy maps and regulations, whereas this 2025 image classifies what covers the ground.
Hard surfaces are concentrated in the east rather than spread across the county
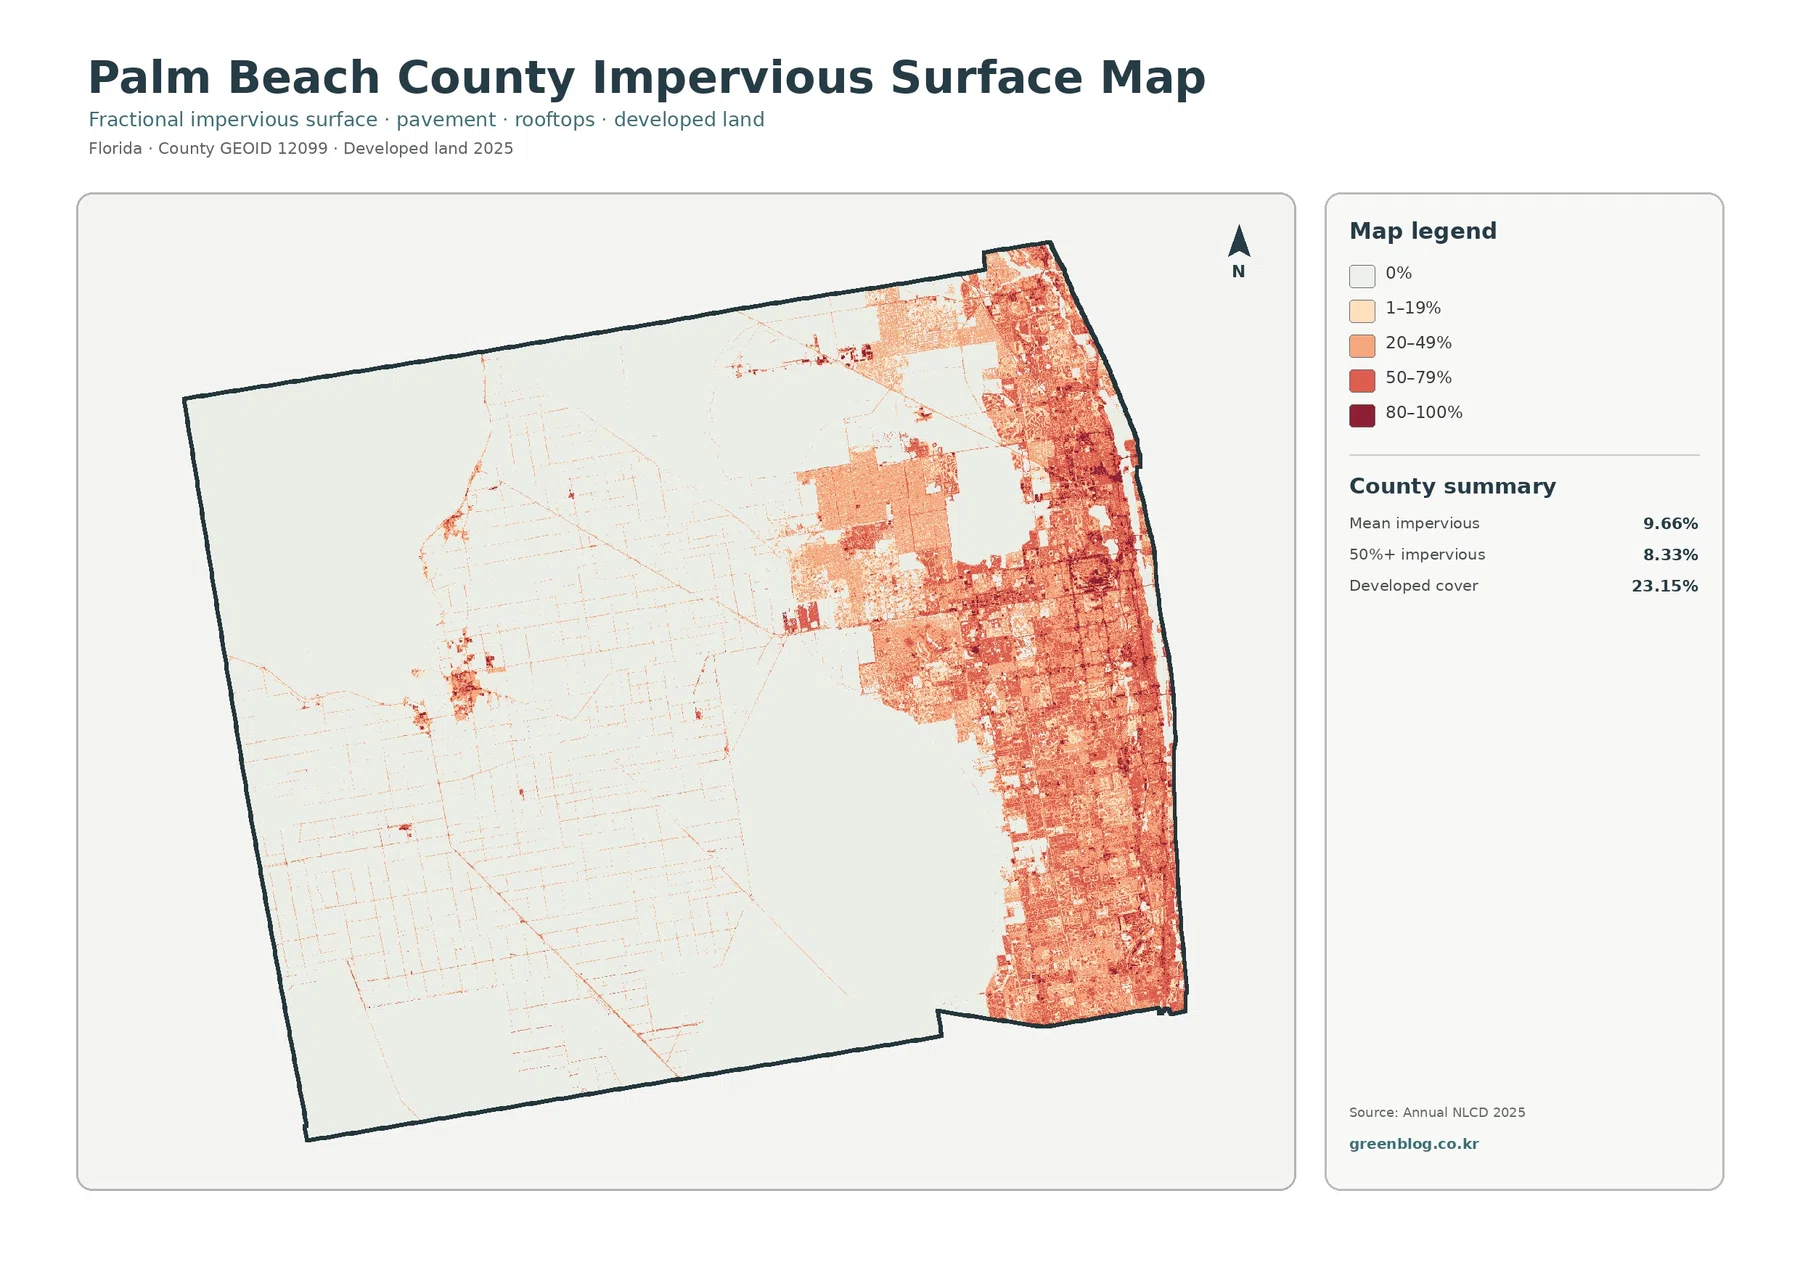
Impervious surface means ground cover that does not readily absorb water, such as building roofs, paved roads, and parking lots. Palm Beach County has a mean impervious value of 9.66%. The area mapped at 50% or greater impervious cover is 8.33%, while developed land as a broader land-cover class is 23.15%. These measures describe related but different conditions.
The strongest impervious values are concentrated across the eastern part of the county. Red and darker orange areas fill much of that side, with medium values extending through surrounding developed areas. In contrast, the western agricultural area and the broad central wetlands are mostly at or near the lowest end of the scale. Narrow higher-value lines and small concentrations also appear farther west, but they do not form the same broad hard-surface area seen in the east.
The difference between 23.15% developed cover and a 9.66% countywide impervious mean is an important reading lesson. Developed cells can contain yards, trees, open space, and other permeable ground along with buildings and pavement. A place can therefore be classified as developed without being mostly sealed by hard materials. The impervious map is better when the question is specifically about the intensity of hard surfaces.
It is also important not to turn impervious cover into a flood-risk map. High hard-surface values can affect how rainfall runs off, but flooding depends on many other factors, including rainfall intensity, elevation, soils, drainage systems, canals, and nearby wetlands or water bodies. This image identifies surface hardness; it does not calculate flood probability or replace local drainage and flood-zone information.
The 1985–2025 comparison highlights development and agricultural differences
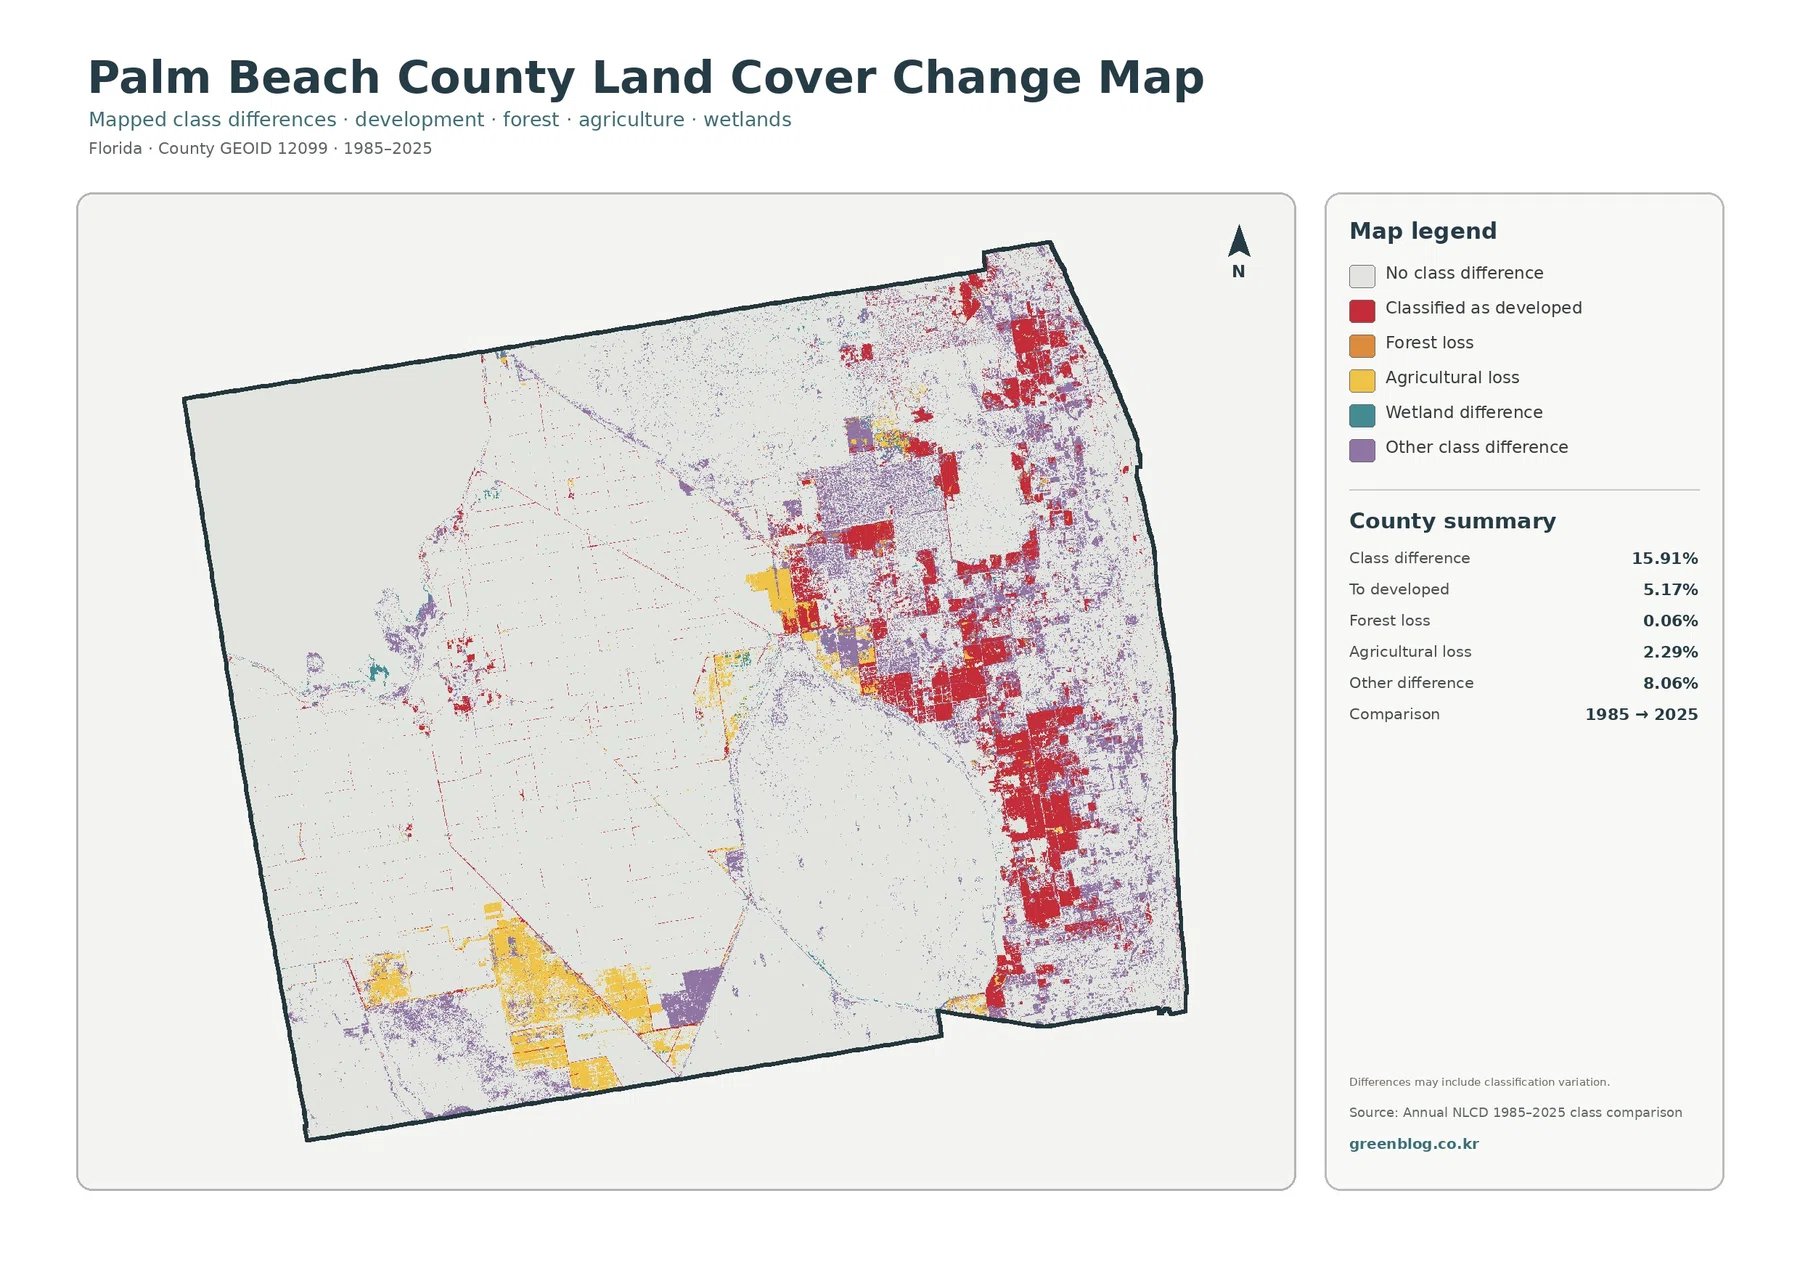
The supplied change summary reports a total class difference of 15.91%. This number is the share of cells whose mapped class differs between 1985 and 2025. It should not be rewritten as a statement that 15.91% of Palm Beach County was physically destroyed or permanently transformed. The map itself notes that classification variation may be included.
Cells classified as developed account for 5.17% of the comparison. They are most visible in the eastern half and in several areas extending toward the center. This value is not the same as the current 23.15% developed-land share. The 23.15% figure describes the 2025 surface, while 5.17% identifies one category of difference between the two selected dates.
Agricultural loss is listed at 2.29%, with noticeable yellow areas in parts of the south and center. Forest loss is only 0.06%. The largest separately reported category is other difference at 8.06%, shown in purple across many scattered locations. The legend also includes wetland difference, but the package does not provide a separate wetland-difference percentage, so a precise value should not be estimated from the image.
A two-date map is best used to identify places worth checking more closely. A red cell tells the reader that the later classification falls into the highlighted developed category, but it does not explain whether the underlying reason was housing, commercial construction, transportation work, or another change. The same caution applies to agricultural loss. Causes require intermediate imagery, local records, or other evidence.
Three cross-map comparisons explain the county better than percentages alone
The first comparison is wetlands versus agriculture. Their shares are close—32.66% and 31.11%—but their locations are not the same. Agriculture is especially extensive in the west and southwest, while large wetland areas occupy the center and south and appear in additional sections farther north. Reading the two percentages without the map would miss that geographic separation.
The second comparison is developed land versus impervious surface. Developed land reaches 23.15%, yet the mean impervious value is 9.66%, and only 8.33% of the county is at least 50% impervious. The eastern concentration is therefore both a land-cover pattern and an intensity pattern. Some developed areas contain far more hard surface than others.
The third comparison is open water versus wetlands. Water represents 12.03%, much of it visible as the large western water area, while wetlands reach 32.66%. Those categories should remain separate in watershed or environmental lessons. Open water is not the only land cover connected with wet conditions, and wetlands are not simply shallow extensions of every mapped water body.
Choose the map that matches the question before adding detail
Use the general 2025 map when the goal is to introduce the county’s overall surface composition. It is the best starting point for comparing wetlands, agriculture, development, and water in one frame. The forest-and-farmland view is better when the audience needs to see agricultural location without the stronger developed-land color dominating the page.
Map scale and classification limits matter when the image is enlarged
These maps are designed for county-scale interpretation, not parcel decisions. Annual land-cover datasets generalize the landscape into grid cells and assign a representative class to each cell. A real location may contain pavement, grass, trees, water, and bare ground at the same time, especially near boundaries. The map simplifies that mixture so broad patterns can be compared consistently.
The original JPG size supplied for each map is 2480 × 1754 pixels, and the asset manifest does not mark it as meeting the package’s A3 high-resolution reference. Enlarging the image can make small shapes easier to see, but it cannot create detail that was not present in the source. Survey boundaries, individual buildings, narrow canals, and small vegetation strips may be generalized or missed.
The 2025 maps represent the supplied observation year. Development, farming changes, restoration, vegetation loss, or other changes after that date may not appear. The 1985–2025 comparison is also a two-date snapshot rather than a year-by-year history. A location could change several times between those dates and still finish in a class similar to its starting class.
Frequently Asked Questions
What is the largest land-cover class in Palm Beach County?
Wetlands are the largest class in the supplied 2025 summary at 32.66%, followed closely by agriculture at 31.11%. Developed land is 23.15%, water is 12.03%, and grassland is 0.42%. The map also shows that these large classes occupy distinct parts of the county rather than being evenly distributed.
Why is developed land 23.15% while mean impervious cover is only 9.66%?
Developed land is a broad land-cover category that can include lawns, trees, open space, and other permeable ground in addition to buildings and pavement. Impervious cover isolates the share occupied by hard surfaces such as roofs, paved roads, and parking areas. The two percentages therefore measure different characteristics.
Does the 15.91% class difference mean that 15.91% of the county was physically changed?
No. It is the share of mapped cells classified differently in the 1985 and 2025 comparison. Real land-cover change may contribute to the result, but imagery, mixed cells, seasonal conditions, and classification variation can also affect a two-date comparison. Specific causes need additional evidence.
Sources and Reference Data
- MRLC Annual NLCD Data — source data for the 2025 land-cover and 1985–2025 comparison views.
- USGS Annual NLCD Land Cover Classification — definitions for developed, agricultural, wetland, water, and other land-cover classes.
- U.S. Census Bureau TIGER/Line Shapefiles — official geographic boundary reference for Palm Beach County.
- Palm Beach County Environmental Resources Management — county information about natural areas and environmental programs.
- Palm Beach County Agricultural Reserve FAQ — official planning context for the Agricultural Reserve and its preservation goals.
Map File Information
The ZIP contains the four original JPG land-cover maps used for this Palm Beach County article.
- Included Files: Use only the versions confirmed in the article and supplied images
- File Type: Use the confirmed download contents
- Intended Use: Printing, education, presentations, and map-based projects
Related Maps
- Alachua County Florida Land Cover Map
- Baker County Florida Land Cover Map
- Bay County Florida Land Cover Map
Green Map creates custom-edited map images using open geographic data sources such as geoBoundaries, Natural Earth, OpenStreetMap, and government open data.
These maps are edited visual materials, not raw data files, and are provided for education, documents, presentations, and graphic reference.