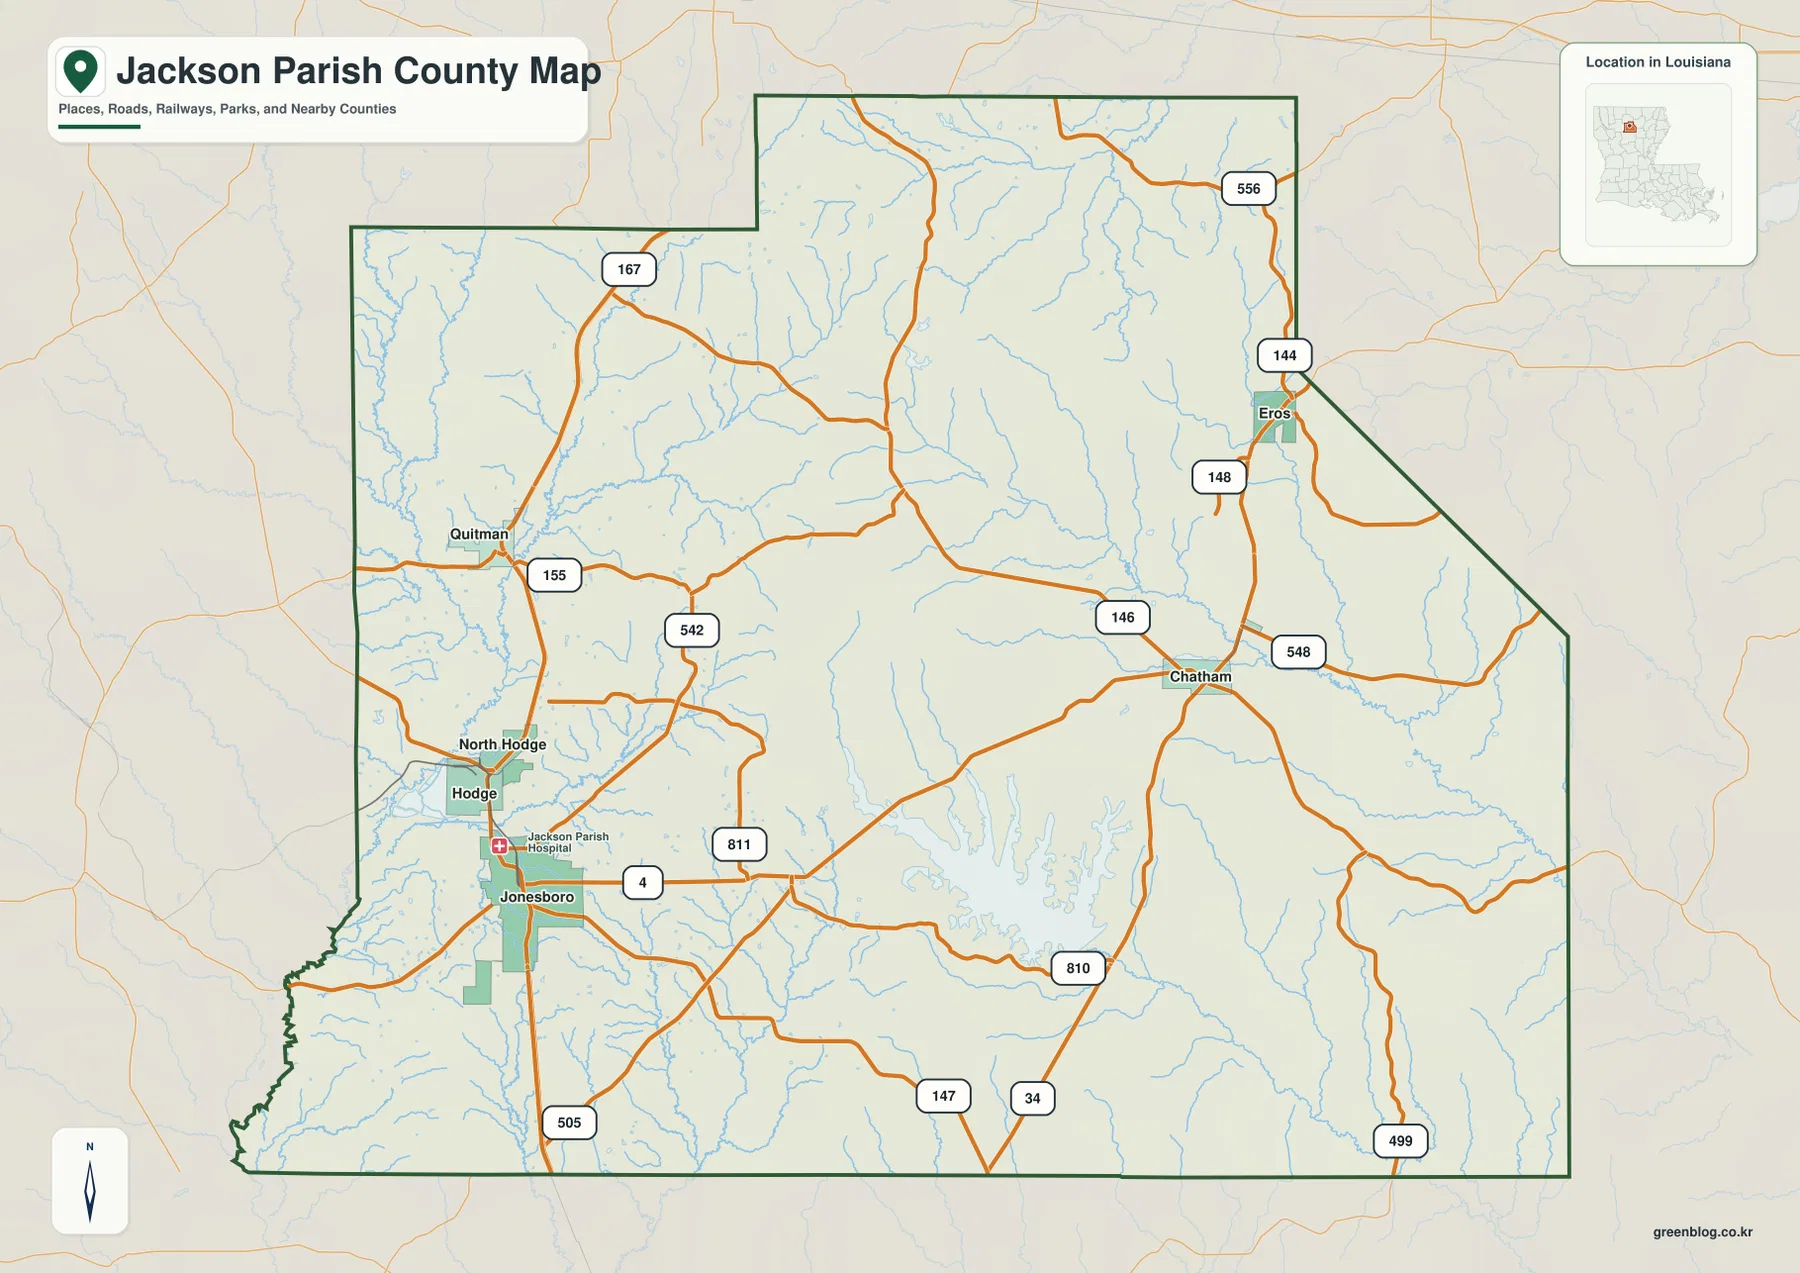
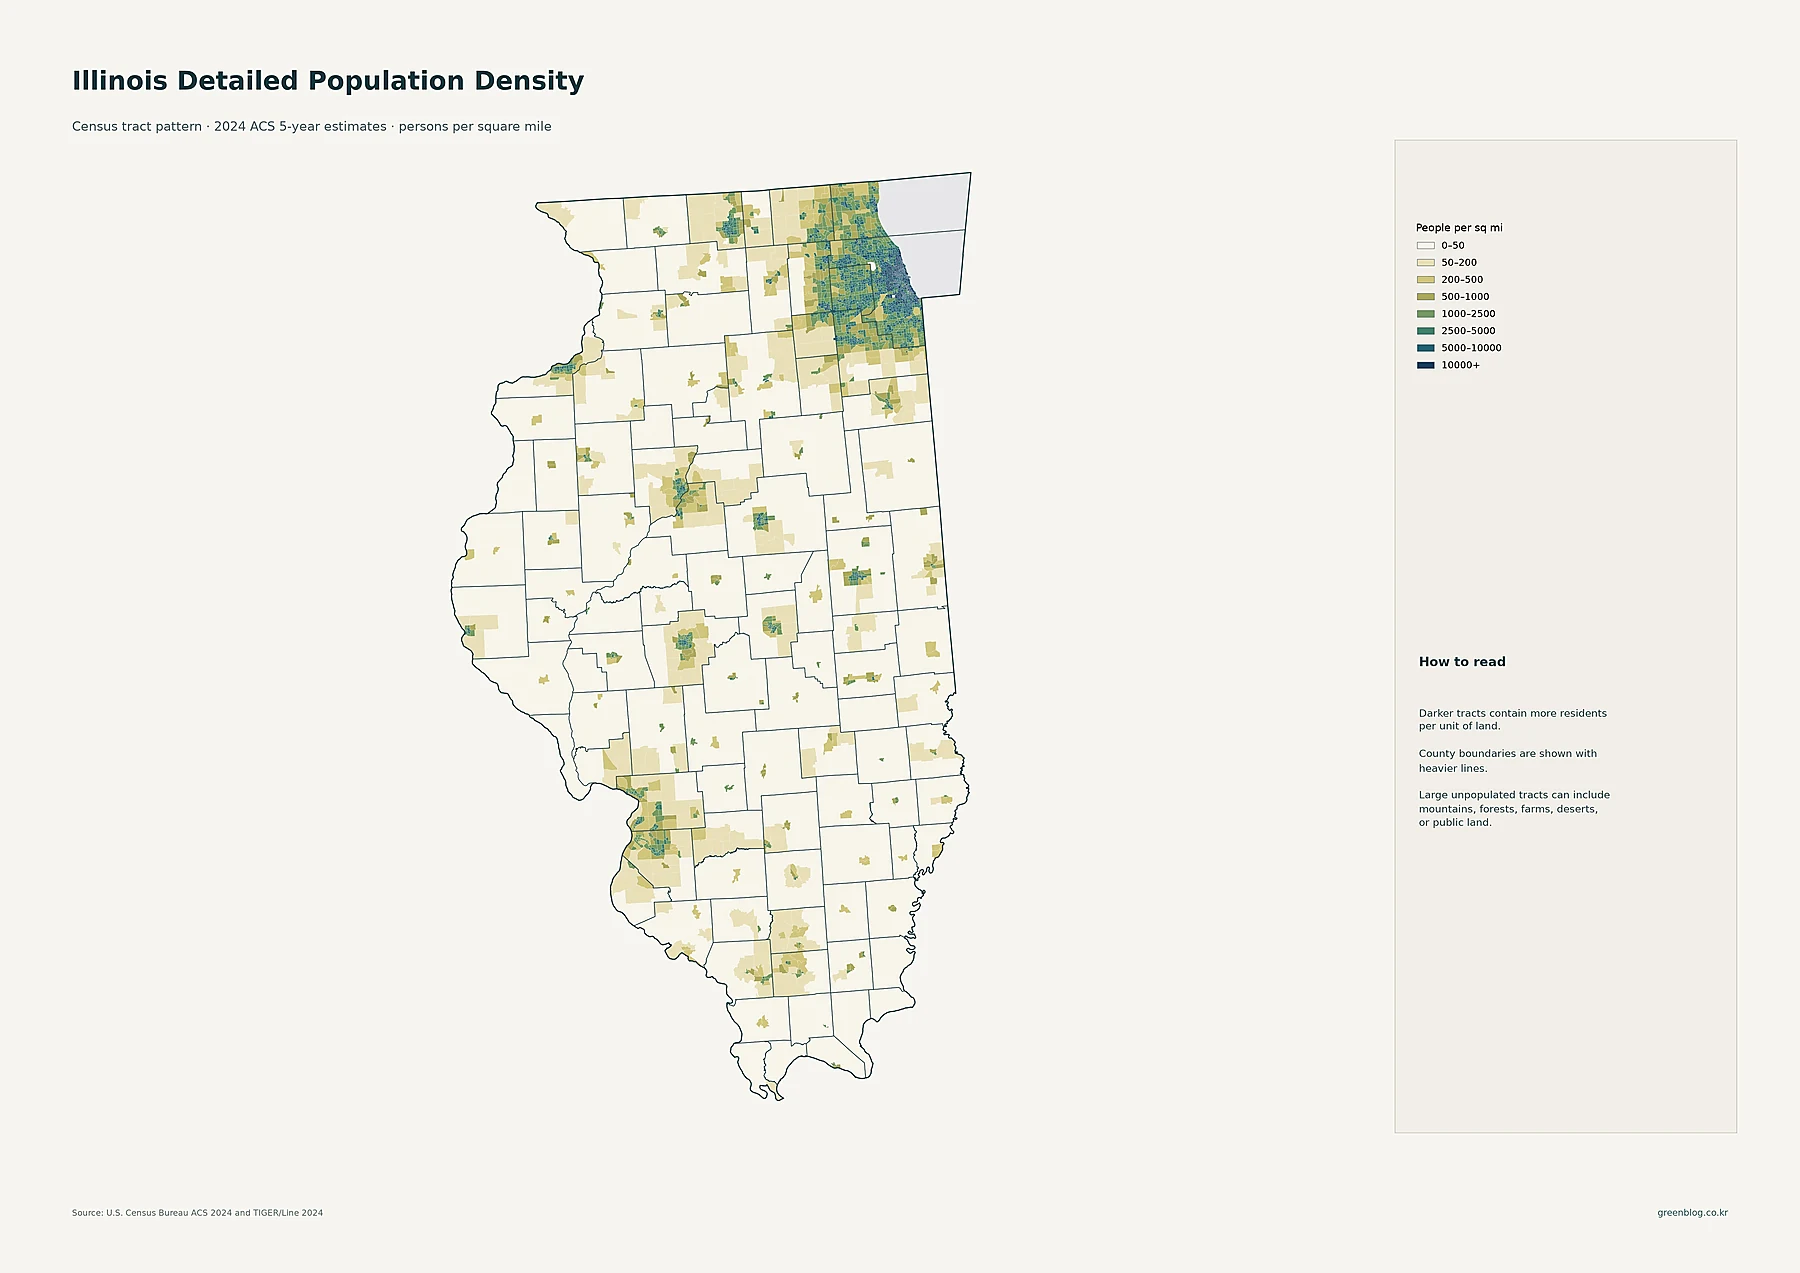
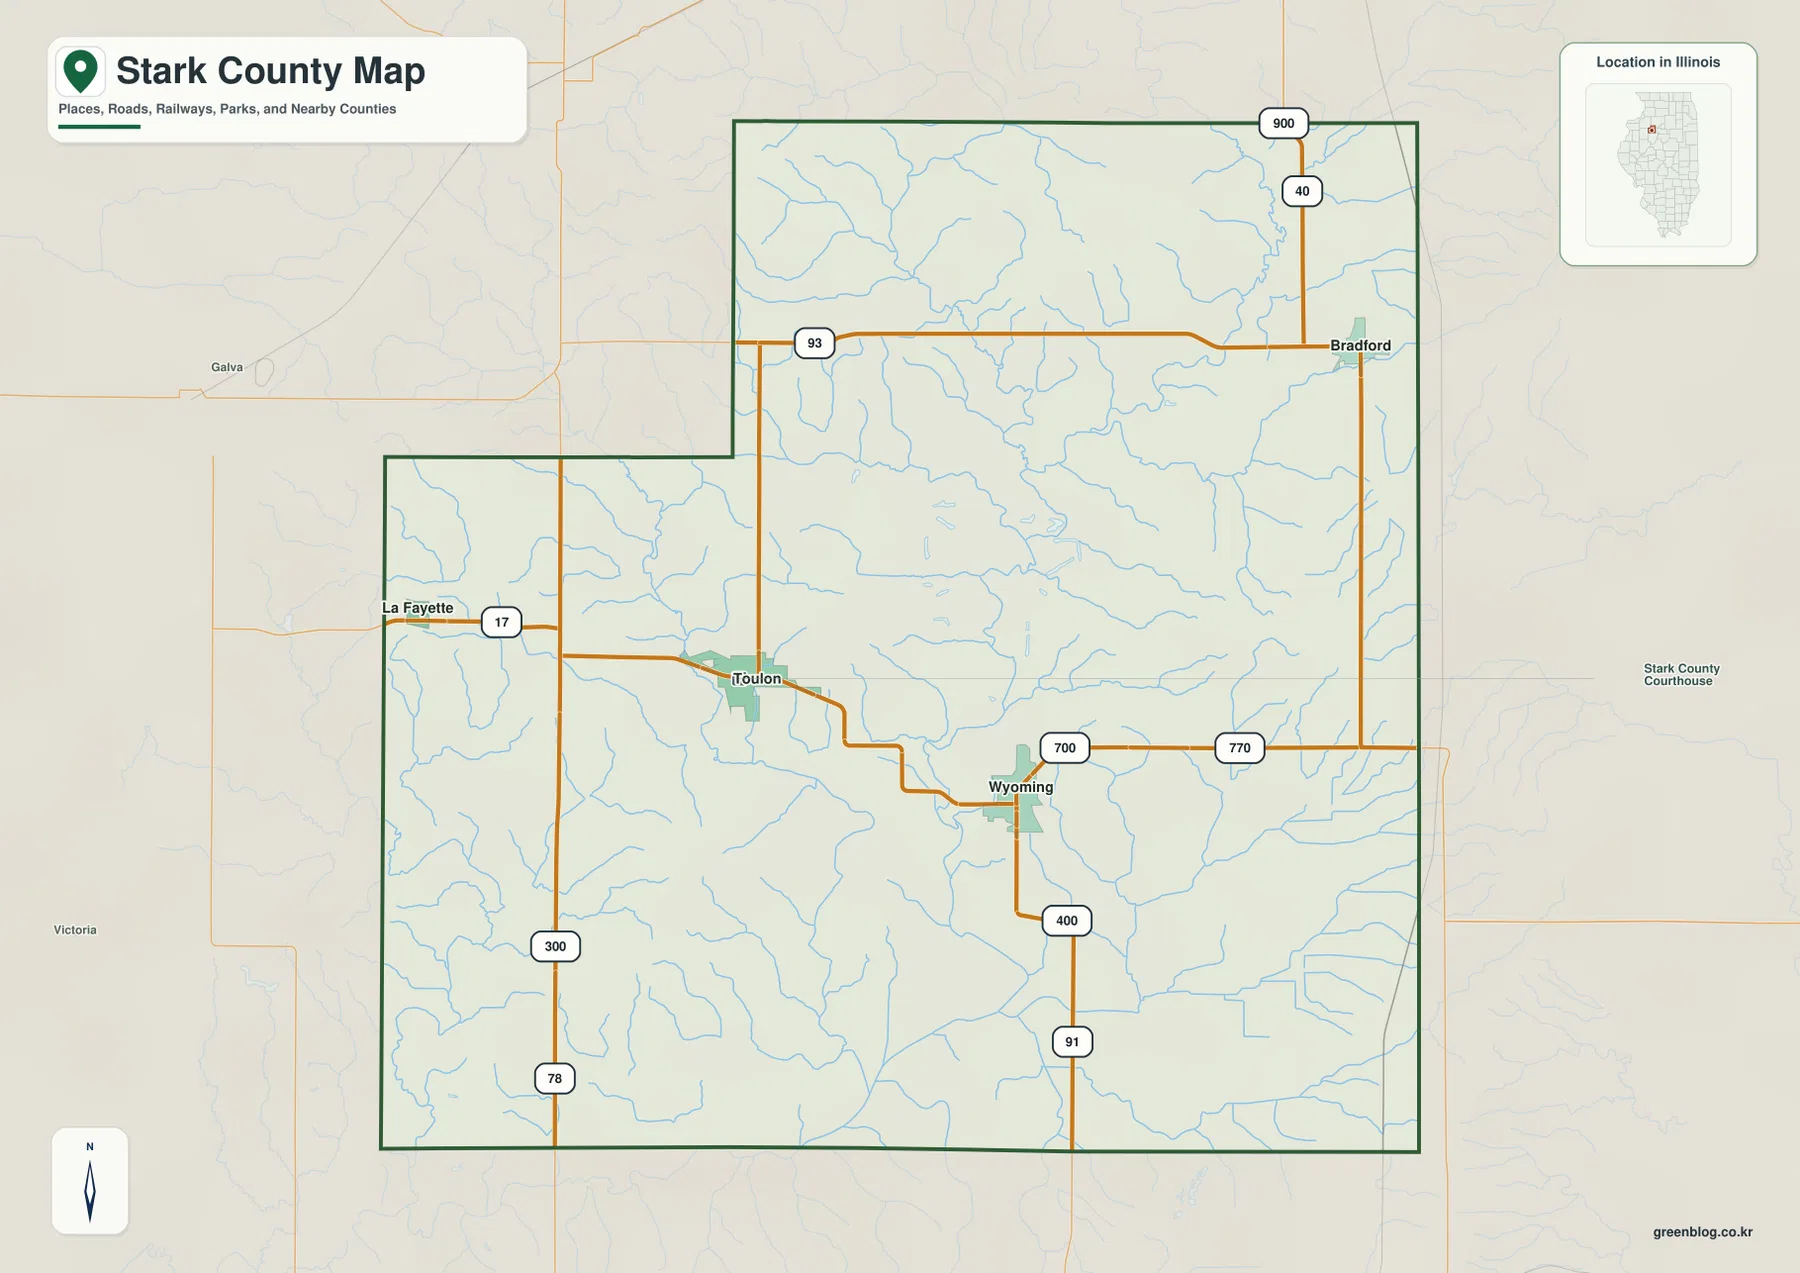
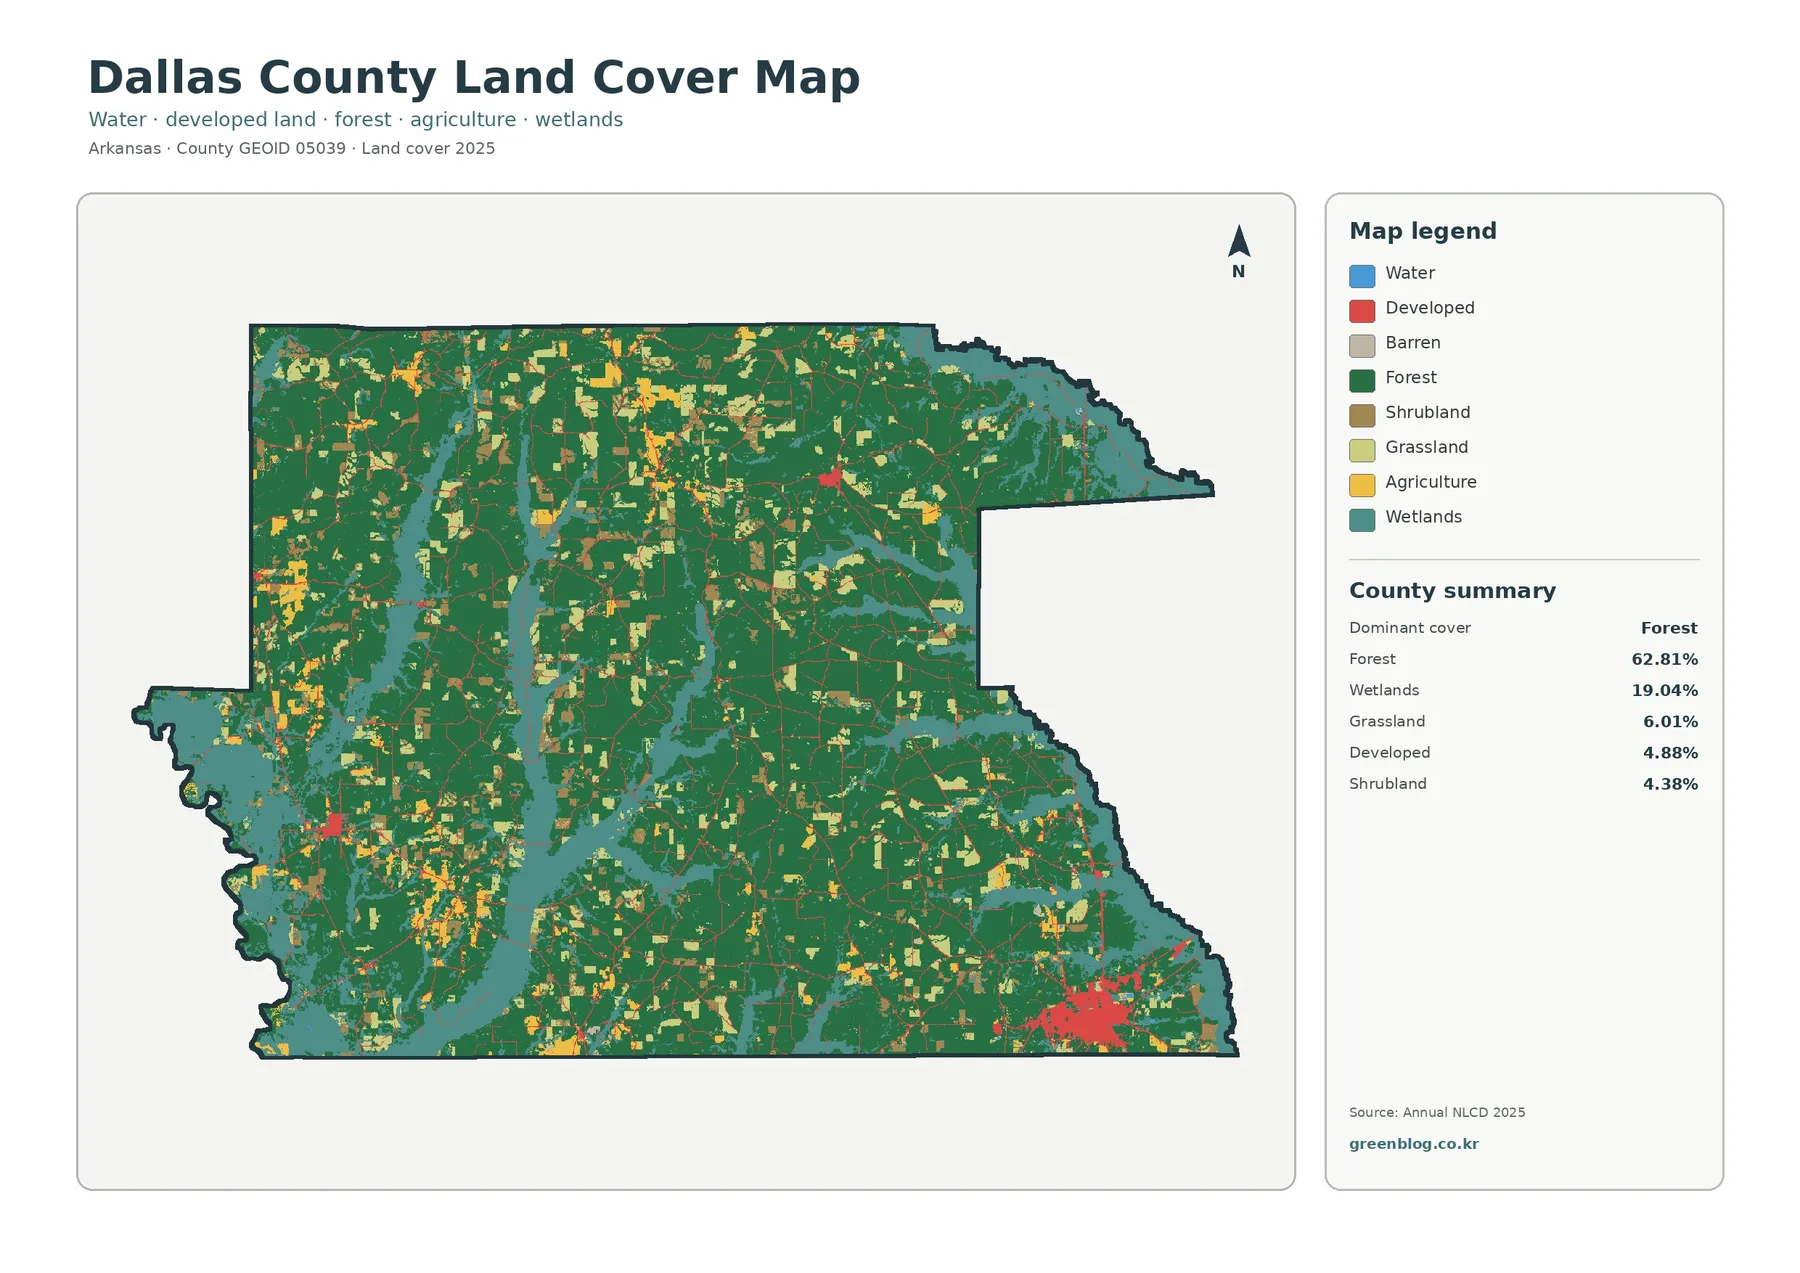
Newton County in east-central Mississippi is easiest to understand by using Decatur and Newton as two different reference points. Decatur is the county seat on the north-south MS 15 corridor, while Newton sits farther south where MS 15 meets the I-20 and US 80 east-west route. The supplied maps also place Union, Lake, Hickory, Chunky, and Conehatta in context and show the county’s stream network and rolling relief. You can view the WebP maps on this page and download the county, city, water, and elevation maps as high-resolution A3 JPG files in one ZIP archive.
The county does not form a single continuous settlement strip. Union, Decatur, and Newton create a north-south sequence, while Lake, Newton, Hickory, and Chunky lie along the southern transportation corridor. Between those places, many small streams cut through rolling ground, and the eastern drainage becomes more prominent near the Chunky River system. The elevation layer adds another useful piece of context: higher ridges are widespread across the north and in parts of the west, while lower valleys extend through the central and southeastern drainage corridors.
Table of Contents
Decatur on MS 15 and Newton at the southern road crossroads
Start with the general county map when you need to orient yourself. Decatur lies near the middle of the county and is marked with the Newton County Sheriff’s Office, reinforcing its role as the county seat. MS 15 runs through Decatur and continues north toward Union and south toward Newton. Newton occupies a different kind of center: it is close to the major east-west highway corridor, so it becomes the natural reference point for trips along I-20 and US 80.
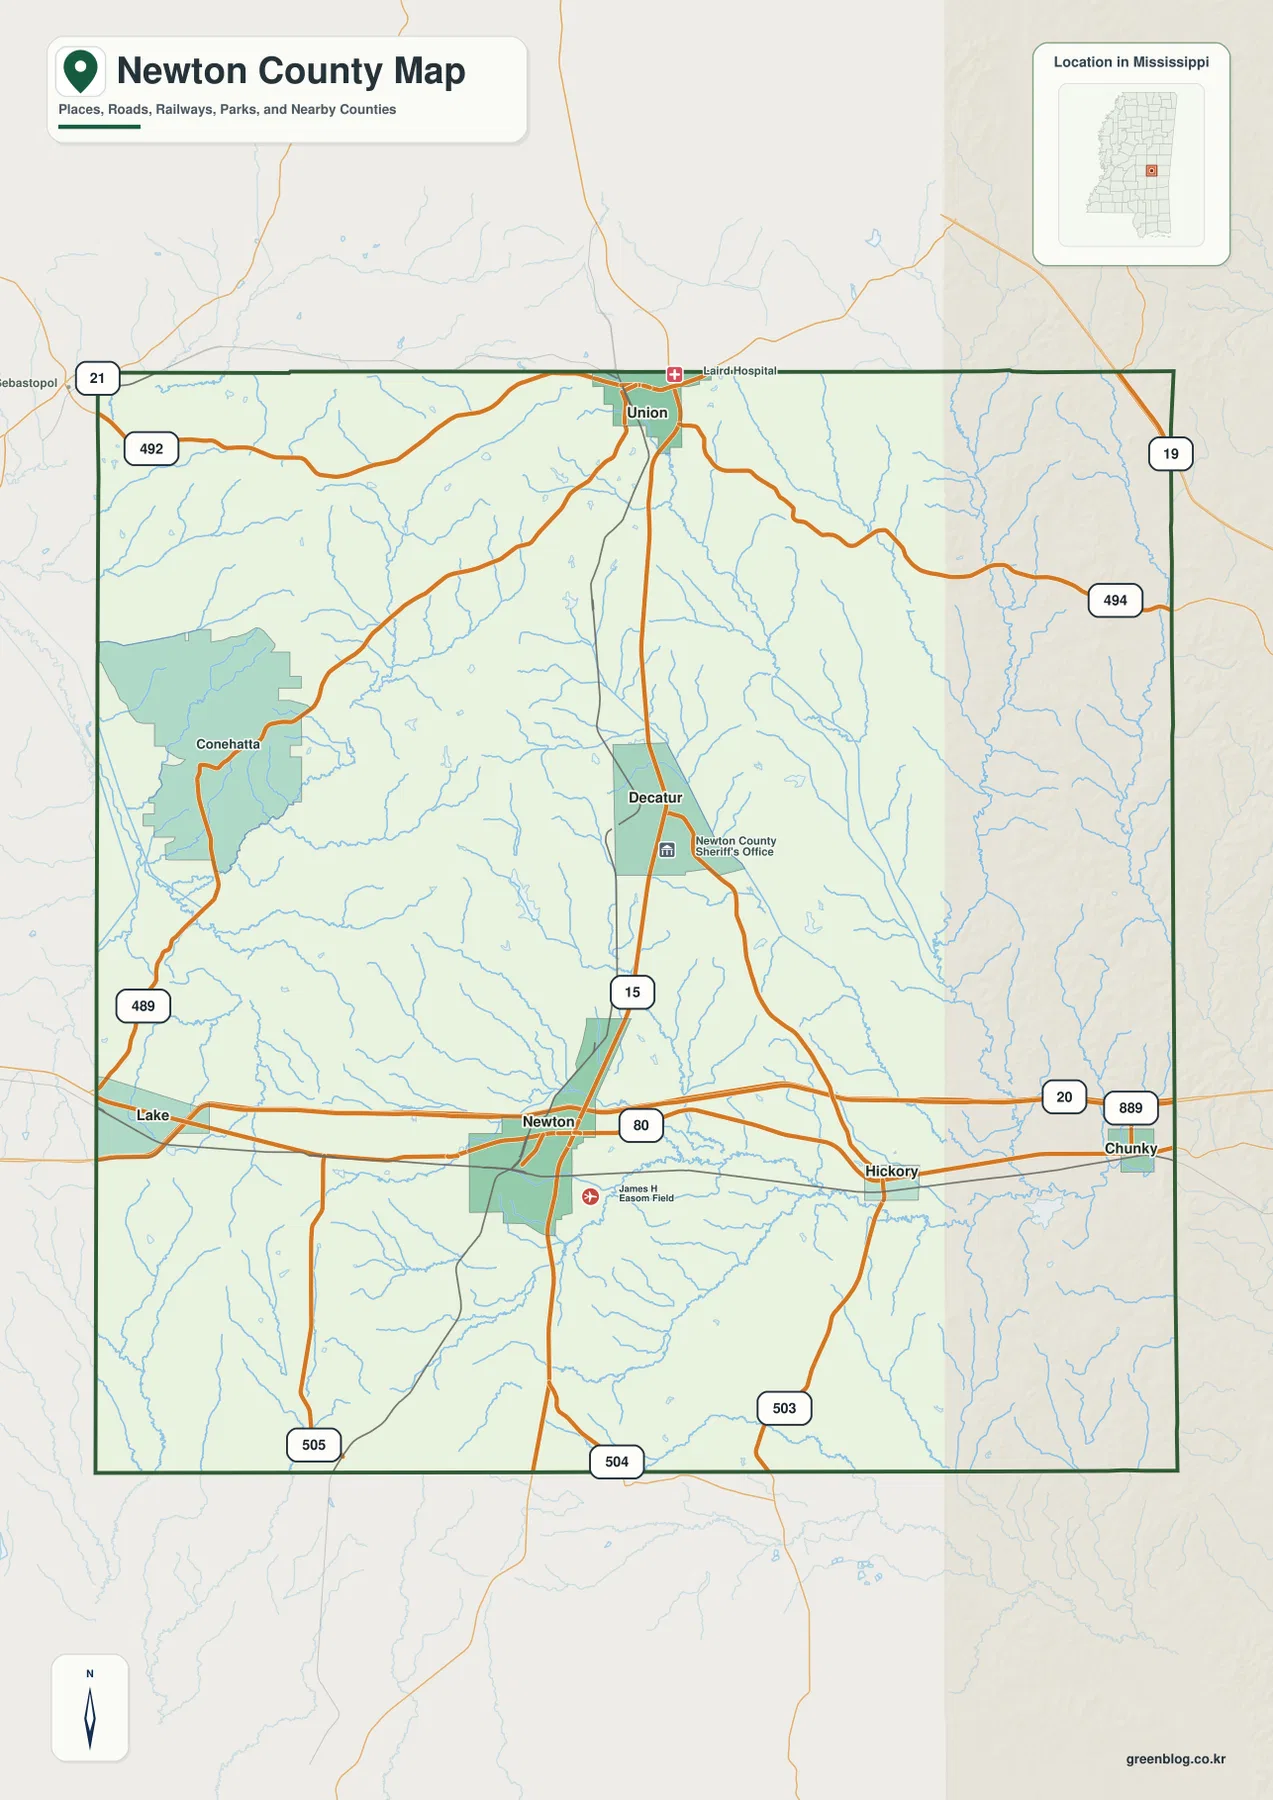
The southern corridor is easy to follow across the map. Lake appears west of Newton, then the route continues east through Hickory toward Chunky and the Lauderdale County side. I-20 and US 80 provide the clearest east-west frame for this part of Newton County. MS 15 crosses that corridor at Newton, which helps explain why the city stands out as a transportation reference even though it is not the county seat. The road pattern also shows why Decatur and Newton should not be treated as interchangeable centers: one represents administration in the middle of the county, while the other sits on the strongest southern travel axis.
Union anchors the northern part of the map. Route 492 extends west from the Union area and Route 494 continues toward the east. On the western side, Conehatta is reached along Route 489 and is shown with a shaded community area. That shading is useful for orientation but should not be read as a survey-grade legal boundary for tribal or private land. The general map is designed to explain places, roads, waterways, and regional position; it is not a parcel ownership or jurisdiction map.
Roads continue beyond the thick county outline in a lighter background, which keeps neighboring travel directions visible rather than making the boundary look like the end of the road network. For most readers, the most useful approach is to focus first on MS 15 and the I-20/US 80 corridor, then use the smaller numbered roads only when a local place requires them. A detailed transportation or engineering task should rely on the Mississippi Department of Transportation’s official maps, but this county view works well for geographic orientation and place relationships.
Six ranked cities reveal two different settlement patterns
The city map strips away much of the road detail and emphasizes six ranked places. Its displayed values are Newton 3,116, Union 2,090, Decatur 1,929, Lake 522, Hickory 471, and Chunky 242. These are city-level values used by the supplied City Index, not the population of Newton County as a whole. The ranking makes Newton visually dominant, but the map should not be used to infer that Newton is the county seat; Decatur retains that administrative role.
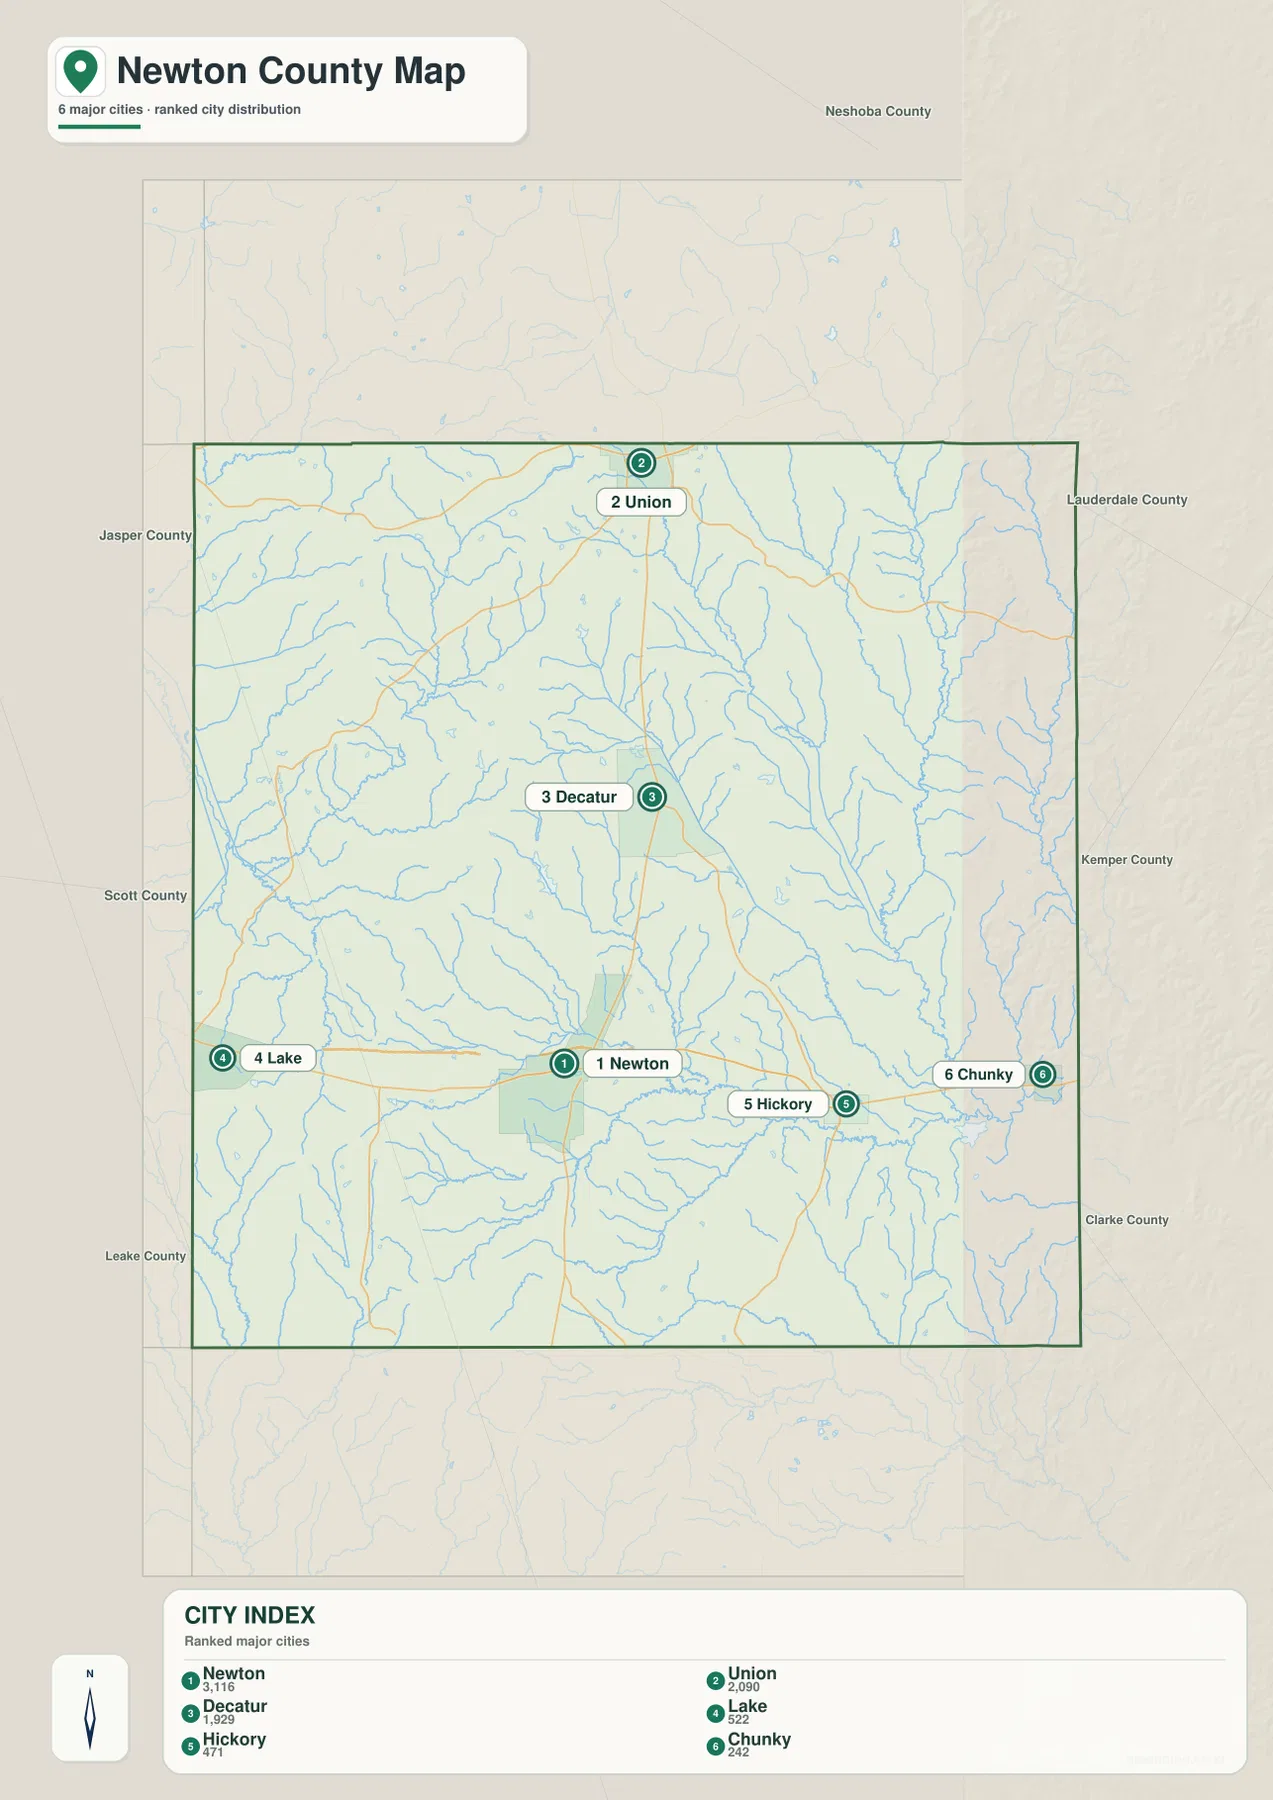
The six markers form two clear geographic arrangements. Union, Decatur, and Newton create a north-south sequence through the middle of the county. Lake, Newton, Hickory, and Chunky create an east-west sequence farther south. Those two patterns meet near Newton, making it a strong transportation reference point. Decatur is set apart from the interstate corridor, so its importance is better understood through county government and its position on MS 15 rather than through the size of its City Index marker alone.
The city map also labels the surrounding counties: Neshoba to the north, Lauderdale and Kemper to the east, Clarke to the southeast, Leake to the southwest, Scott to the west, and Jasper along the western side. That outer ring gives Newton County a useful statewide context without requiring a separate Mississippi map. If your question is simply which county lies beyond a particular side of Newton County, this cleaner city layer is often easier to read than the general road map.
Conehatta is a good example of why the city layer should not be mistaken for a complete list of communities. It is labeled on the general county map but does not appear among the six ranked City Index entries. Different layers select different information. Use the general map when you need a broader set of local place names and route references, and use the city map when the relative position and rank of the six displayed cities is the main point.
Chunky River, creek valleys, and scattered ponds
The water map changes the emphasis completely. Instead of making roads the main visual feature, it exposes the dense drainage network running through the county. The Chunky River is the strongest named water feature in the southeast, with the Chunky Creek system feeding through the eastern half. Tallahatta Creek is labeled farther east, Conehatta Creek crosses the western side, and Potterchitto Creek becomes important in the southern drainage. Numerous unnamed tributaries branch between those larger channels, showing that Newton County is shaped more by many stream valleys than by one dominant large lake.
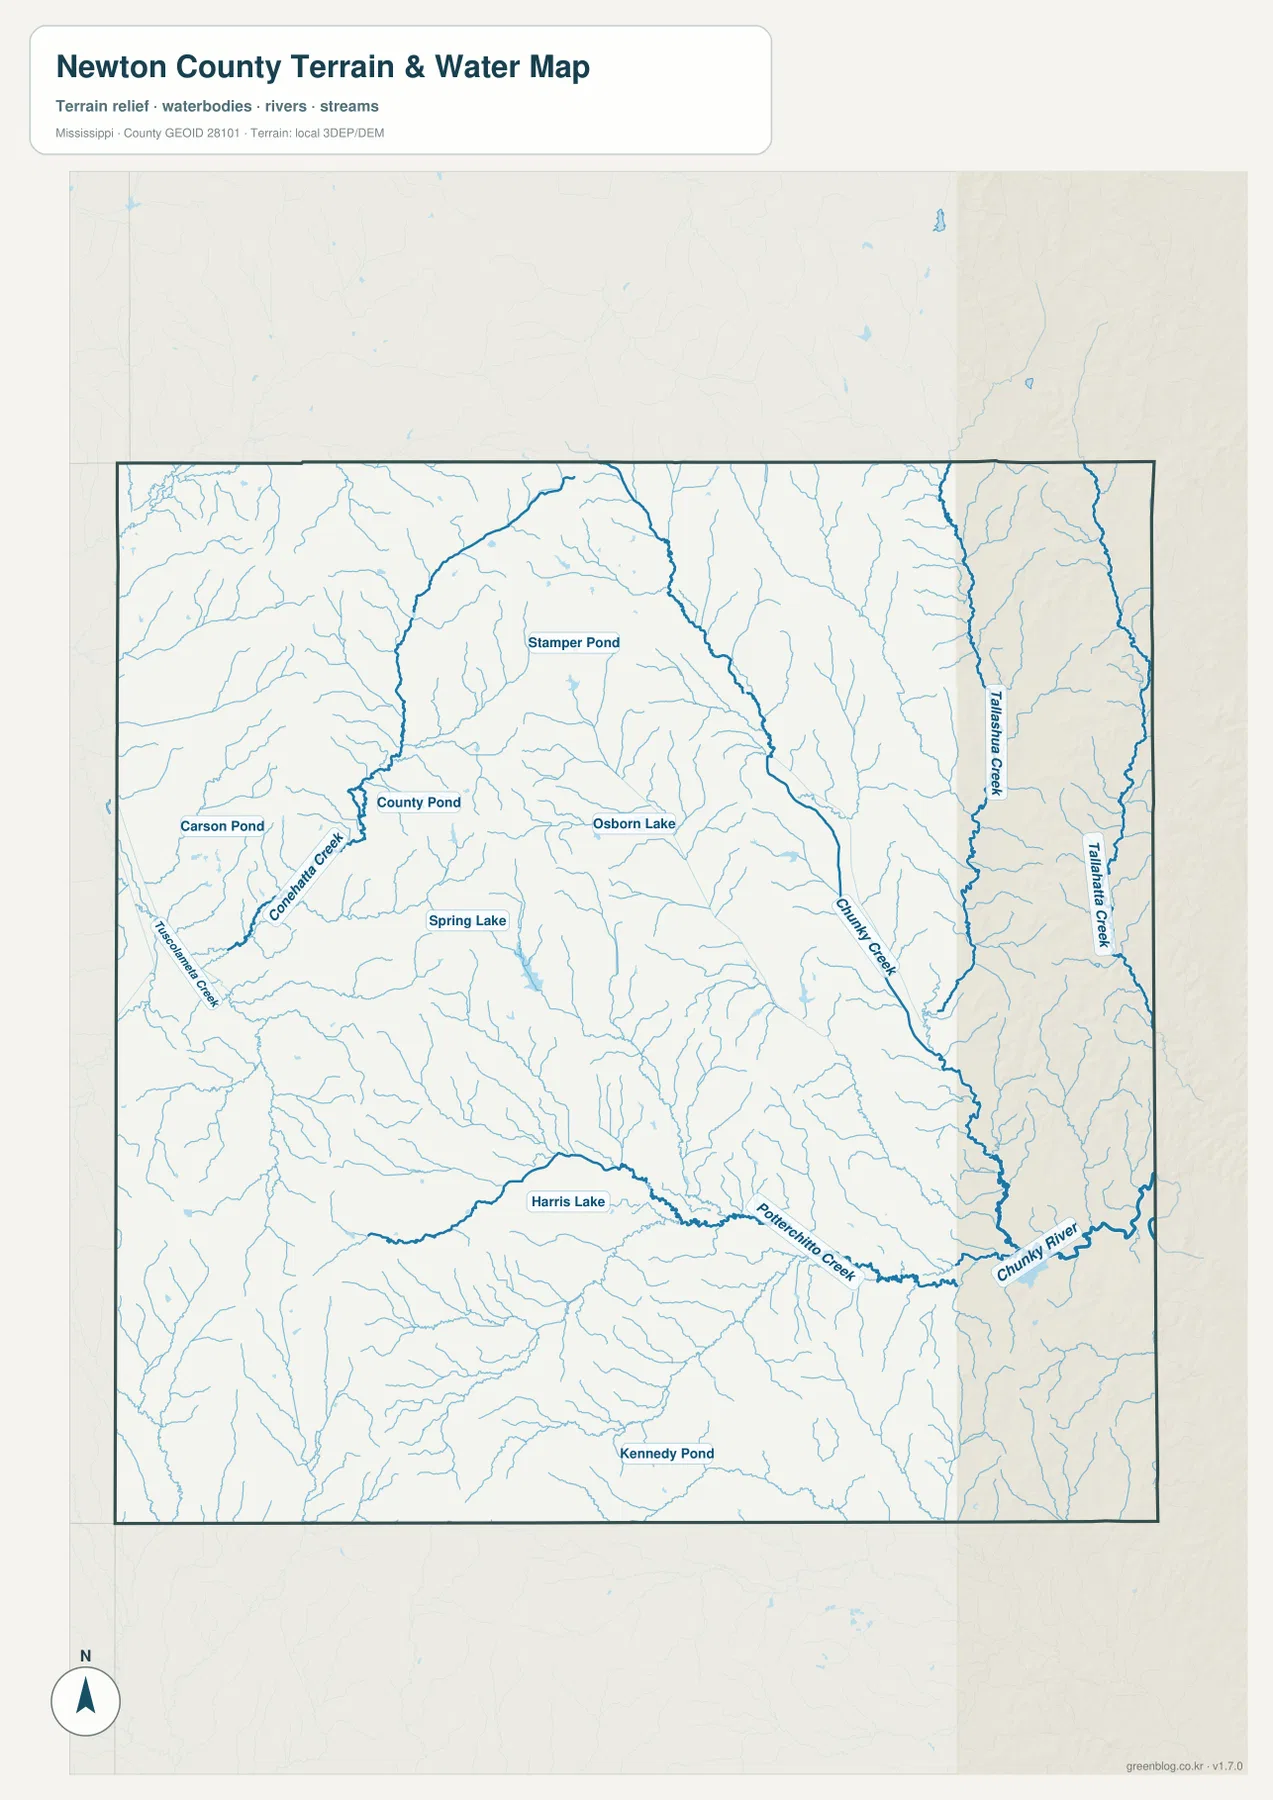
Several small water bodies provide additional landmarks. Stamper Pond is labeled in the northern interior. Carson Pond and County Pond appear in the northwest, while Osborn Lake and Spring Lake sit nearer the central-western part of the county. Harris Lake is farther south and Kennedy Pond appears in the southern portion. None of these dominates the county the way a major reservoir would, but together they help distinguish local drainage areas and make the water map more informative than a simple outline of the Chunky River alone.
The eastern side is especially useful for comparing tributaries. Tallahatta Creek and the Chunky Creek system run through a network of smaller branches before the drainage reaches the southeastern Chunky River. Potterchitto Creek also follows a strong eastward course across the south. When this layer is compared with the road map, the I-20/US 80 settlement corridor can be seen crossing several stream valleys rather than following one uniform flat belt. That relationship between roads and drainage is one of the more distinctive features of the supplied Newton County maps.
This is a hydrography reference map, not a flood-risk or navigation product. A blue line shows the mapped position of a watercourse but does not provide flood probability, water depth, water quality, seasonal flow, or a safe crossing location. Anyone working on floodplain, engineering, or environmental decisions should use the appropriate official datasets. For general readers, the layer is best used to identify the major named streams and to understand how smaller tributaries connect across the county.
Rolling ridges above lower central and southeastern valleys
The elevation map uses a local color scale to show relief rather than roads or town names. Its legend reports an actual range of about 83 to 197 meters and a mean elevation of 131 meters. Greens indicate the lower parts of the local range, while yellows and browns mark higher ridges and hills. Broad areas of stronger brown relief appear across the northern part of Newton County, with additional high ground in the west and northeast. Lower green corridors extend through the center and become especially noticeable toward the southeastern drainage.
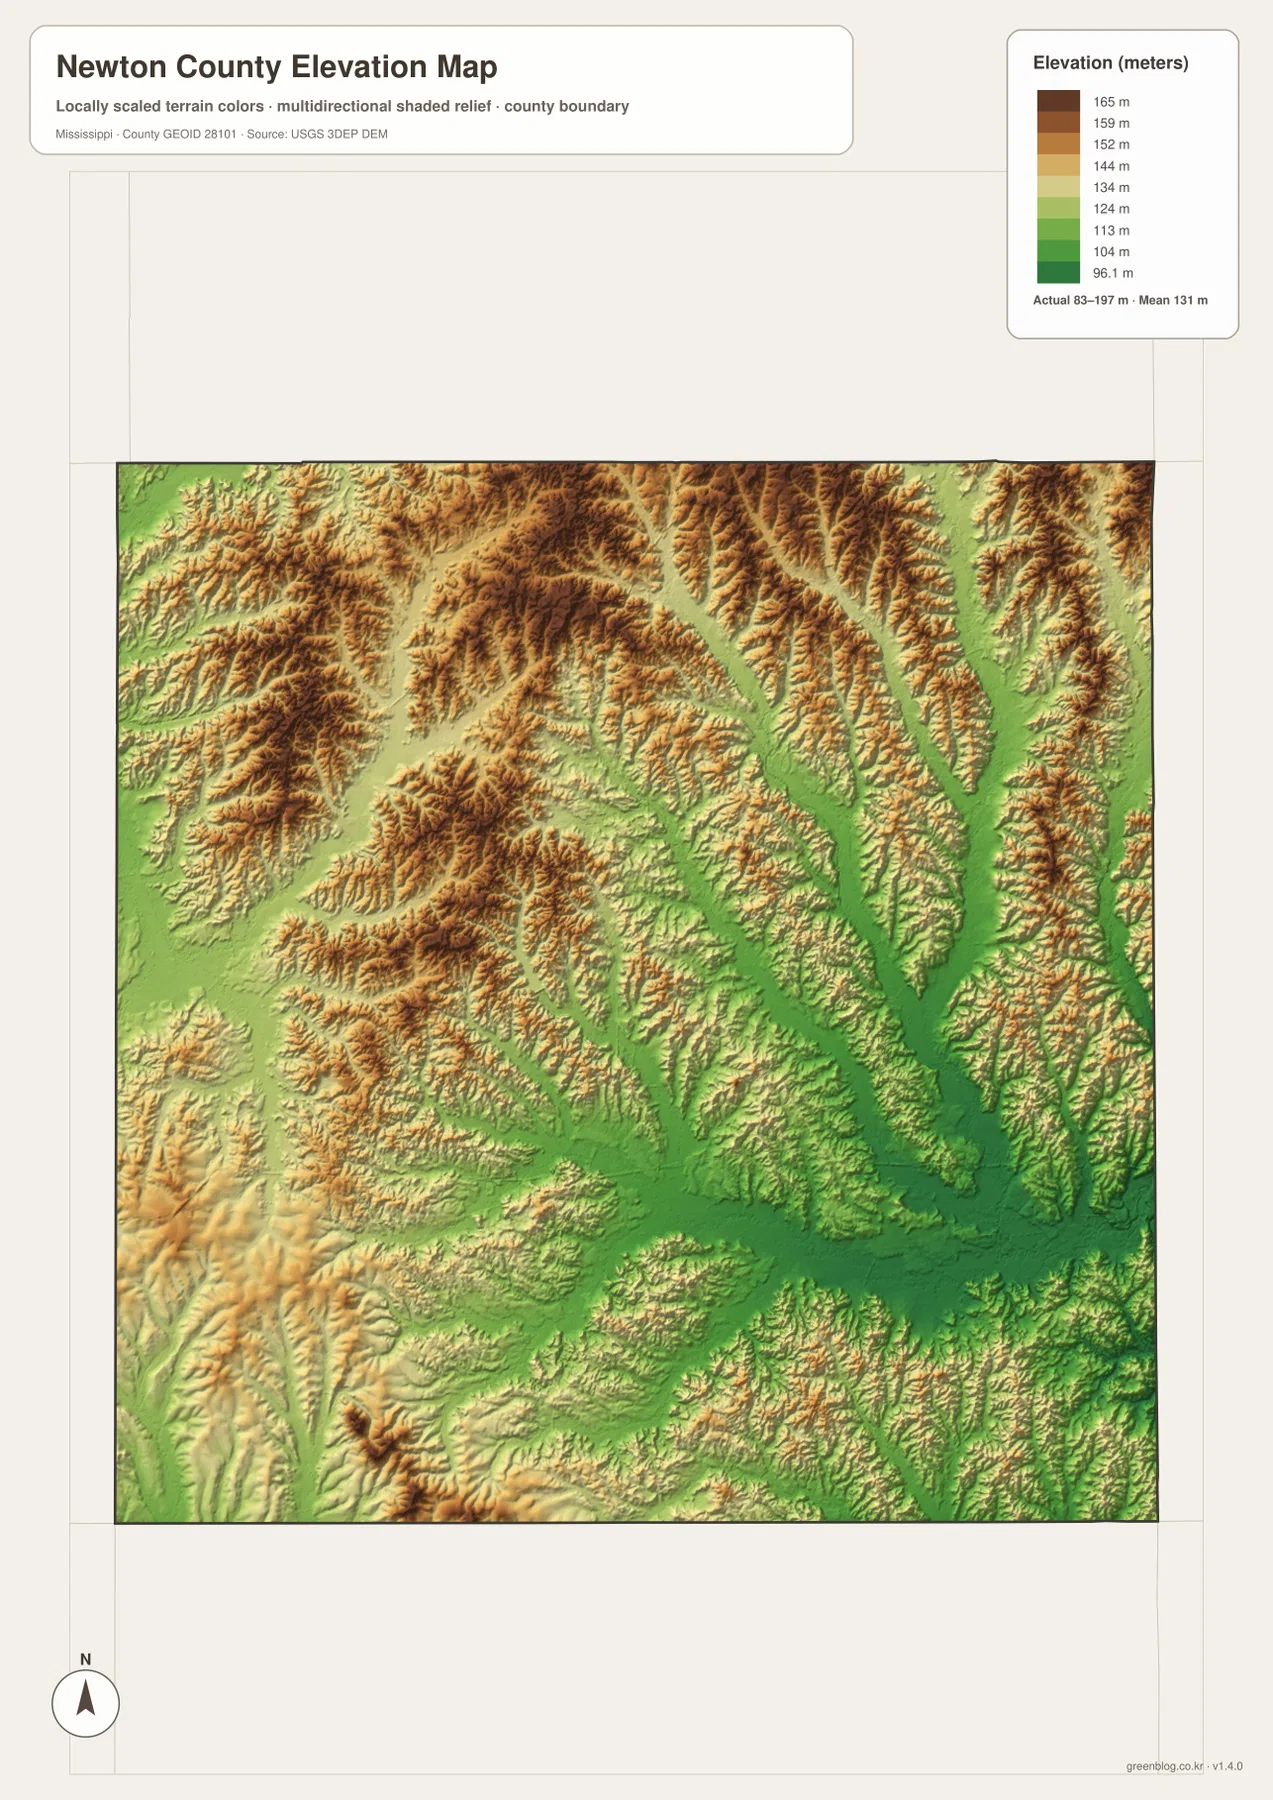
The water layer helps explain those colors. Lower green corridors often follow the same valleys occupied by the Chunky Creek and Tallahatta Creek drainage, and the southeastern Chunky River sits within a broader low area. In the west and northwest, Conehatta Creek and smaller tributaries cut between higher ridges. The result is a landscape of short ridges and branching valleys rather than a flat plain that slopes evenly in one direction.
The elevation colors are generalized for county-scale comparison. They are useful for seeing which parts of the county are relatively high or low and for understanding why streams follow certain valleys. They should not be used for construction grades, lot drainage, road engineering, or survey measurements. A point that appears in the same color band as another point can still differ in precise elevation. For exact work, the USGS 3D Elevation Program should be consulted directly.
Population and area numbers in geographic context
The existing county package records a 2020 census population of 21,291 and a July 2025 population estimate of 20,960. Those figures have different reference dates and should not be treated as two identical measurements. The difference is 331 people, roughly 1.6 percent of the 2020 count, but the countywide numbers do not identify where change occurred. The maps are useful here because they show several distinct settlement centers rather than one large urban area that could explain the entire county total.
| Item | Value used in the package |
|---|---|
| County | Newton County, Mississippi; FIPS 28101 |
| County seat | Decatur |
| 2020 census population | 21,291 |
| July 2025 population estimate | 20,960 |
| 2025 Gazetteer land area | 577.771 square miles |
| 2025 Gazetteer water area | 1.747 square miles |
| 2020 population / land-area average | about 36.9 residents per square mile |
| Elevation legend | about 83–197 m; mean 131 m |
The 2025 Gazetteer values separate 577.771 square miles of land from 1.747 square miles of water. Using the 2020 population with that land-area figure gives the package’s countywide average of about 36.9 residents per square mile. It is only an average across all land in the county. Newton neighborhoods, Decatur, the I-20 corridor, wooded uplands, farms, and stream valleys are not expected to have the same settlement density.
The city map helps keep that statistic in perspective. Newton has the largest displayed City Index value, but Union and Decatur are also substantial markers, and smaller places continue along the southern corridor. The county map adds Conehatta, which is not part of the six-city ranking. A single density number therefore cannot replace the geographic information in the maps; it is more useful as a broad measure of county scale than as a description of where people actually live.
Choose the layer that matches the question
For general orientation, use the county map first. It combines Decatur, Newton, Union, Conehatta, Lake, Hickory, and Chunky with major roads and the county outline, so it works well when you need to explain where a place sits within Newton County. If the main question is how the six ranked cities are distributed or which counties surround Newton County, the cleaner city map is easier to read because it removes much of the route detail.
The water map is the better choice for the Chunky River system, named creeks, small lakes, and branching tributaries. It reveals far more hydrographic detail than the general road layer. The elevation map should be used when the focus is on rolling hills, lower valleys, or the relationship between relief and drainage. Comparing the water and elevation views is particularly helpful in eastern and southeastern Newton County, where low valleys line up with the main creek and river corridors.
For printing, keep the original JPG files reasonably large so that road numbers and small water labels remain legible. The hydrography layer contains many fine tributary lines that can disappear when heavily reduced, and the elevation layer depends on its color ramp to distinguish local height differences. The WebP images in the article are intended for quick viewing; the downloadable ZIP provides the larger JPG versions for print, editing, classroom, or presentation use.
Limits of the road, water, and elevation layers
The county and city maps are reference products, not legal boundary or parcel maps. They are appropriate for road orientation, community relationships, neighboring counties, and the general position of labeled places. They do not establish property ownership, municipal annexation, tribal land status, or jurisdiction. This distinction is important around Conehatta, where a shaded community area can look more precise than the purpose of the map actually allows.
The water map has similar limits: it identifies water features but does not show flood zones, navigability, water quality, or depth. The elevation layer is not a survey surface and should not be used for site design or engineering. These maps are most useful as a readable geographic overview. The official Census, transportation, hydrography, and elevation sources linked below are better starting points when a task requires regulatory, legal, or technical precision.
Frequently Asked Questions
Is Newton or Decatur the county seat of Newton County?
Decatur is the county seat. Newton has the largest value in the supplied City Index and sits at the important MS 15 and I-20/US 80 crossroads, but city rank and county-seat status are different things. The general map marks the Newton County Sheriff’s Office in Decatur and places the town near the center of the county.
How can I tell the town of Chunky from the Chunky River on these maps?
Chunky the community appears on the general and city maps along the southeastern I-20/US 80 corridor. The Chunky River appears as a bold blue water feature on the hydrography map near the southeastern side of the county. Use the road or city symbols for the settlement and the blue line and water label for the river.
Where does the elevation map show the strongest high-and-low contrast?
The strongest broad contrast is between the higher brown ridges across much of the north and the lower green valleys extending through the center and southeast. The supplied legend spans about 83 to 197 meters with a mean of 131 meters. Exact point elevations should be checked in USGS source data rather than estimated from the generalized color surface.
Sources and reference data
The population, area, transportation, hydrography, and elevation context on this page is based on the supplied county package and the official sources below. Use the original agencies when you need the latest or most detailed version of a dataset.
- U.S. Census Bureau QuickFacts for Newton County
- U.S. Census Bureau Gazetteer Files
- Mississippi Department of Transportation official highway map
- USGS National Hydrography
- USGS 3D Elevation Program
- East Central Community College
Map File Information
Download the map files associated with this page for reference, printing, and compatible visual projects.
- Included Files: 4 high-resolution A3 JPG maps described on this page
- File Type: JPG files in a ZIP archive
- Intended Use: Printing, education, presentations, and map-based projects
Related Maps
Green Map creates custom-edited map images using open geographic data sources such as geoBoundaries, Natural Earth, OpenStreetMap, and government open data. These maps are edited visual materials, not raw data files, and are provided for education, documents, presentations, and graphic reference.