Cook County stretches from Chicago’s Lake Michigan shoreline across a broad suburban belt and far into the northwest and south. Chicago is the obvious eastern anchor, but the county map also contains major suburban centers around Schaumburg, Palatine, Arlington Heights, and Des Plaines, plus southern places such as Orland Park, Tinley Park, and Chicago Heights. That range makes Cook County unlike the more compact Illinois counties: a dense urban core, large suburban districts, river corridors, and noticeably higher terrain in the northwest all fit inside one boundary.
The maps on this page are easiest to use by keeping Chicago fixed while changing what information you emphasize. The overview connects roads and suburbs, the city graphic compares six selected population centers, the terrain sheet follows Lake Michigan and the major rivers, and the elevation image shows the drop from the northwest toward the central and lakeshore lowlands. High-resolution JPG originals are bundled in one ZIP download so smaller suburb names, creek labels, road numbers, and terrain colors remain useful when enlarged or printed.
Cook County’s official history page states that the county was created on January 15, 1831. The Fort Dearborn settlement at the mouth of Chicago River became the new county seat, and Chicago remains the seat today. That history matches the geography on the supplied maps: Chicago sits along the eastern lakeshore while the county extends far beyond the city into a large network of suburban municipalities.
Table of Contents
Chicago connects to a wide ring of suburbs
The detailed overview places Chicago along Lake Michigan in the east-central part of the county. Roads marked 55 and 57 extend southwest and south from the city, while 94 and 41 continue north close to the lakeshore side. West and northwest of Chicago, 290, 294, 90, and 53 connect the dense suburban belt. These corridors make it possible to move through the map without treating every municipality as a separate starting point.
The northwest contains Schaumburg, Hoffman Estates, Palatine, and Arlington Heights, followed farther east by Mount Prospect, Des Plaines, Glenview, and Northbrook. Elk Grove Village sits near the major road junctions around 90 and 294. Because so many municipal names are packed into a relatively small area, the major roads are just as useful as the place labels for understanding this part of Cook County.
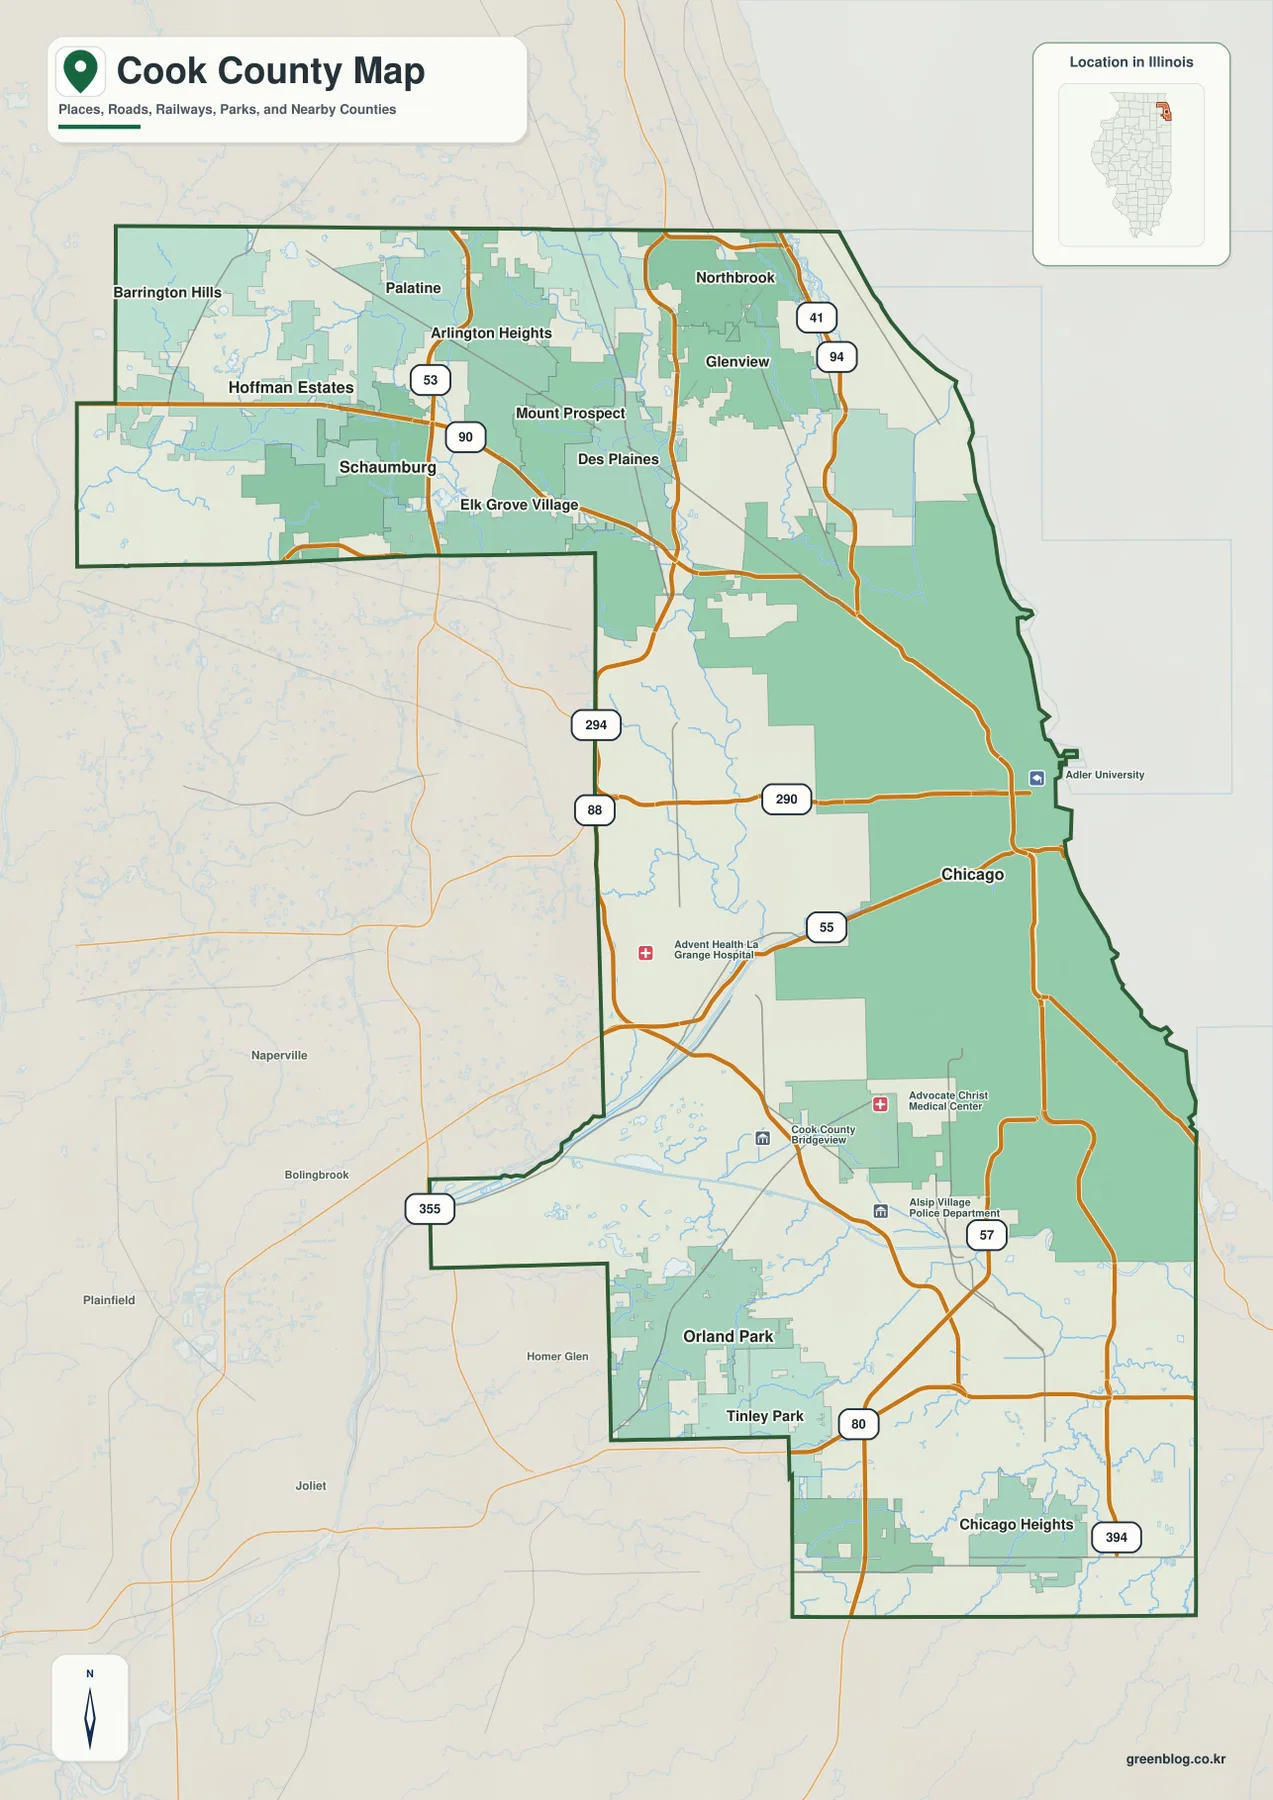
The southern county has a different pattern. Orland Park and Tinley Park sit together in the southwest, while Chicago Heights occupies the southeast. Roads 80 and 394 provide strong southern references, and 355 appears near the western edge. Green areas and smaller streams become more visible away from the Chicago core, so the map shifts from extremely dense urban labeling to a more open mixture of municipalities, waterways, and preserved land.
Chicago is the county seat, but not the whole county
Cook County government identifies Chicago as the county seat. On the supplied map, Chicago is also the most prominent city label, but the county reaches far to the northwest and deep into the southern suburbs. A practical orientation is to keep Chicago on the eastern edge and add Schaumburg or Palatine in the northwest, Orland Park in the southwest, and Chicago Heights in the southeast as outer reference points.
Six city markers span the core and northwest suburbs
The simplified city graphic gives Chicago the dominant marker and places Cicero immediately to its west. Schaumburg, Arlington Heights, and Palatine cluster in the northwest, while Evanston lies along the lakeshore north of Chicago. The printed CITY INDEX lists Chicago at 2,711,226, Cicero at 82,797, Schaumburg at 76,386, Evanston at 76,340, Arlington Heights at 76,005, and Palatine at 66,293.
The image does not display a census year or statistical reference date beside those figures, so they are not presented here as current population counts. They are treated only as values printed on the supplied map. The geographic arrangement is the more dependable message: Chicago and Cicero form the east-central urban reference, Evanston sits north along Lake Michigan, and the three northwest suburbs create a separate cluster well away from the city core.
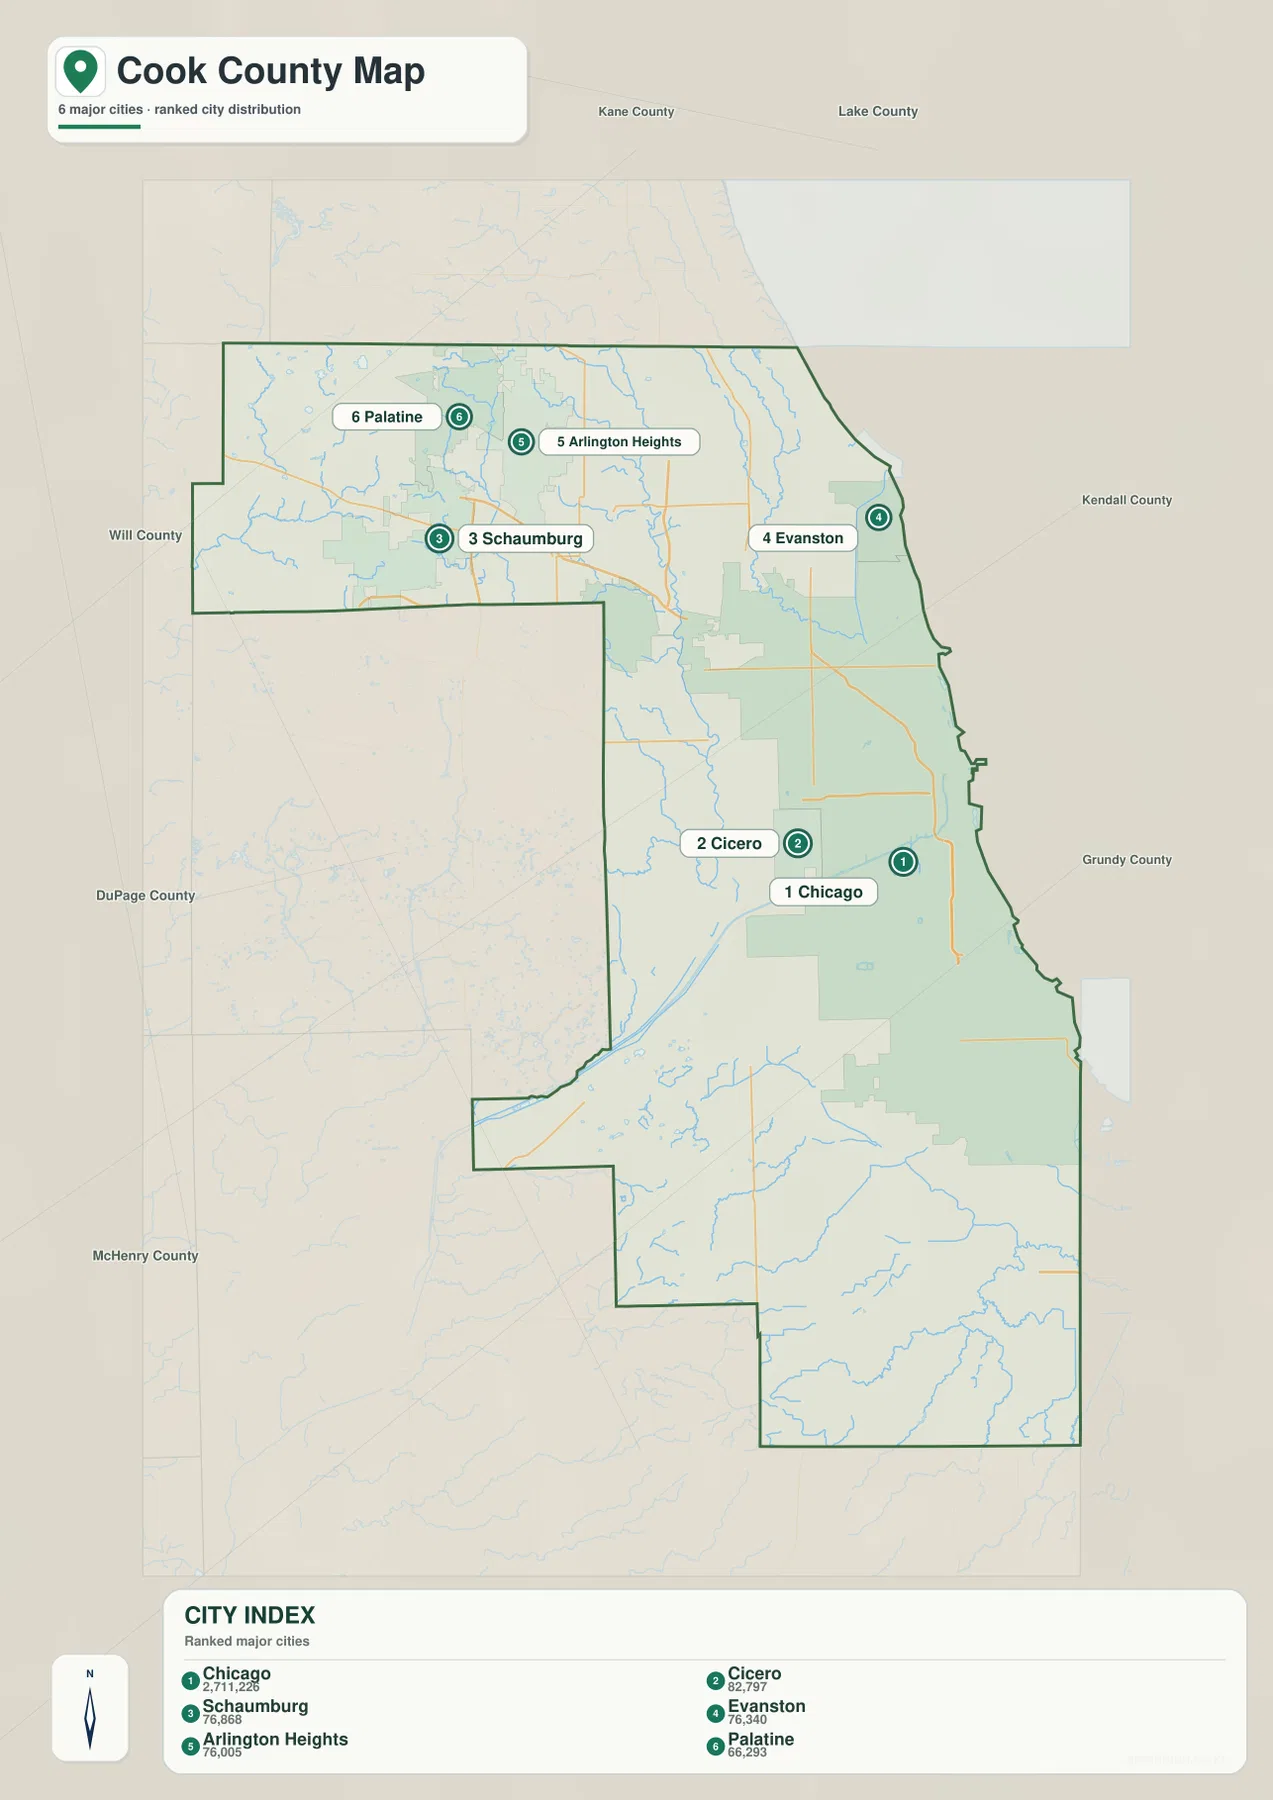
This selected-city view does not attempt to represent every major municipality in Cook County. Its value is the spacing: the Chicago-Cicero core is separated by a large distance from the Schaumburg-Arlington Heights-Palatine cluster, while Evanston occupies a distinct lakeshore position. That simple pattern is useful before returning to the much more crowded overview map.
Use a dated source for current population
A current population table needs an explicit reference year, such as a U.S. Census Bureau release. The CITY INDEX on the supplied graphic does not provide that date. On this page, its numbers are used only to describe the ranking and relative scale shown by the map itself.
Lake Michigan and three major rivers frame the water map
Lake Michigan dominates the entire eastern edge of the terrain-and-water image. Just inland, the Chicago River system descends from the north, with labels for its North Fork and North Branch. Farther west, Des Plaines River forms a long north-south line through the county, joined by Salt Creek. In the northwest, Poplar Creek adds another named tributary before the water network reaches the more urbanized center.
Several smaller water bodies are labeled as well. Goose Lake and Bakers Lake appear in the northwest. Closer to Chicago, Cortez Basin, Sherman Park Lagoon, and Marquette Park Lagoon are printed as urban water features, while Maple Lake lies farther southwest. In the southeastern county, Calumet River and Little Calumet River become the major named channels, creating a water system distinct from the Chicago River branches in the north.
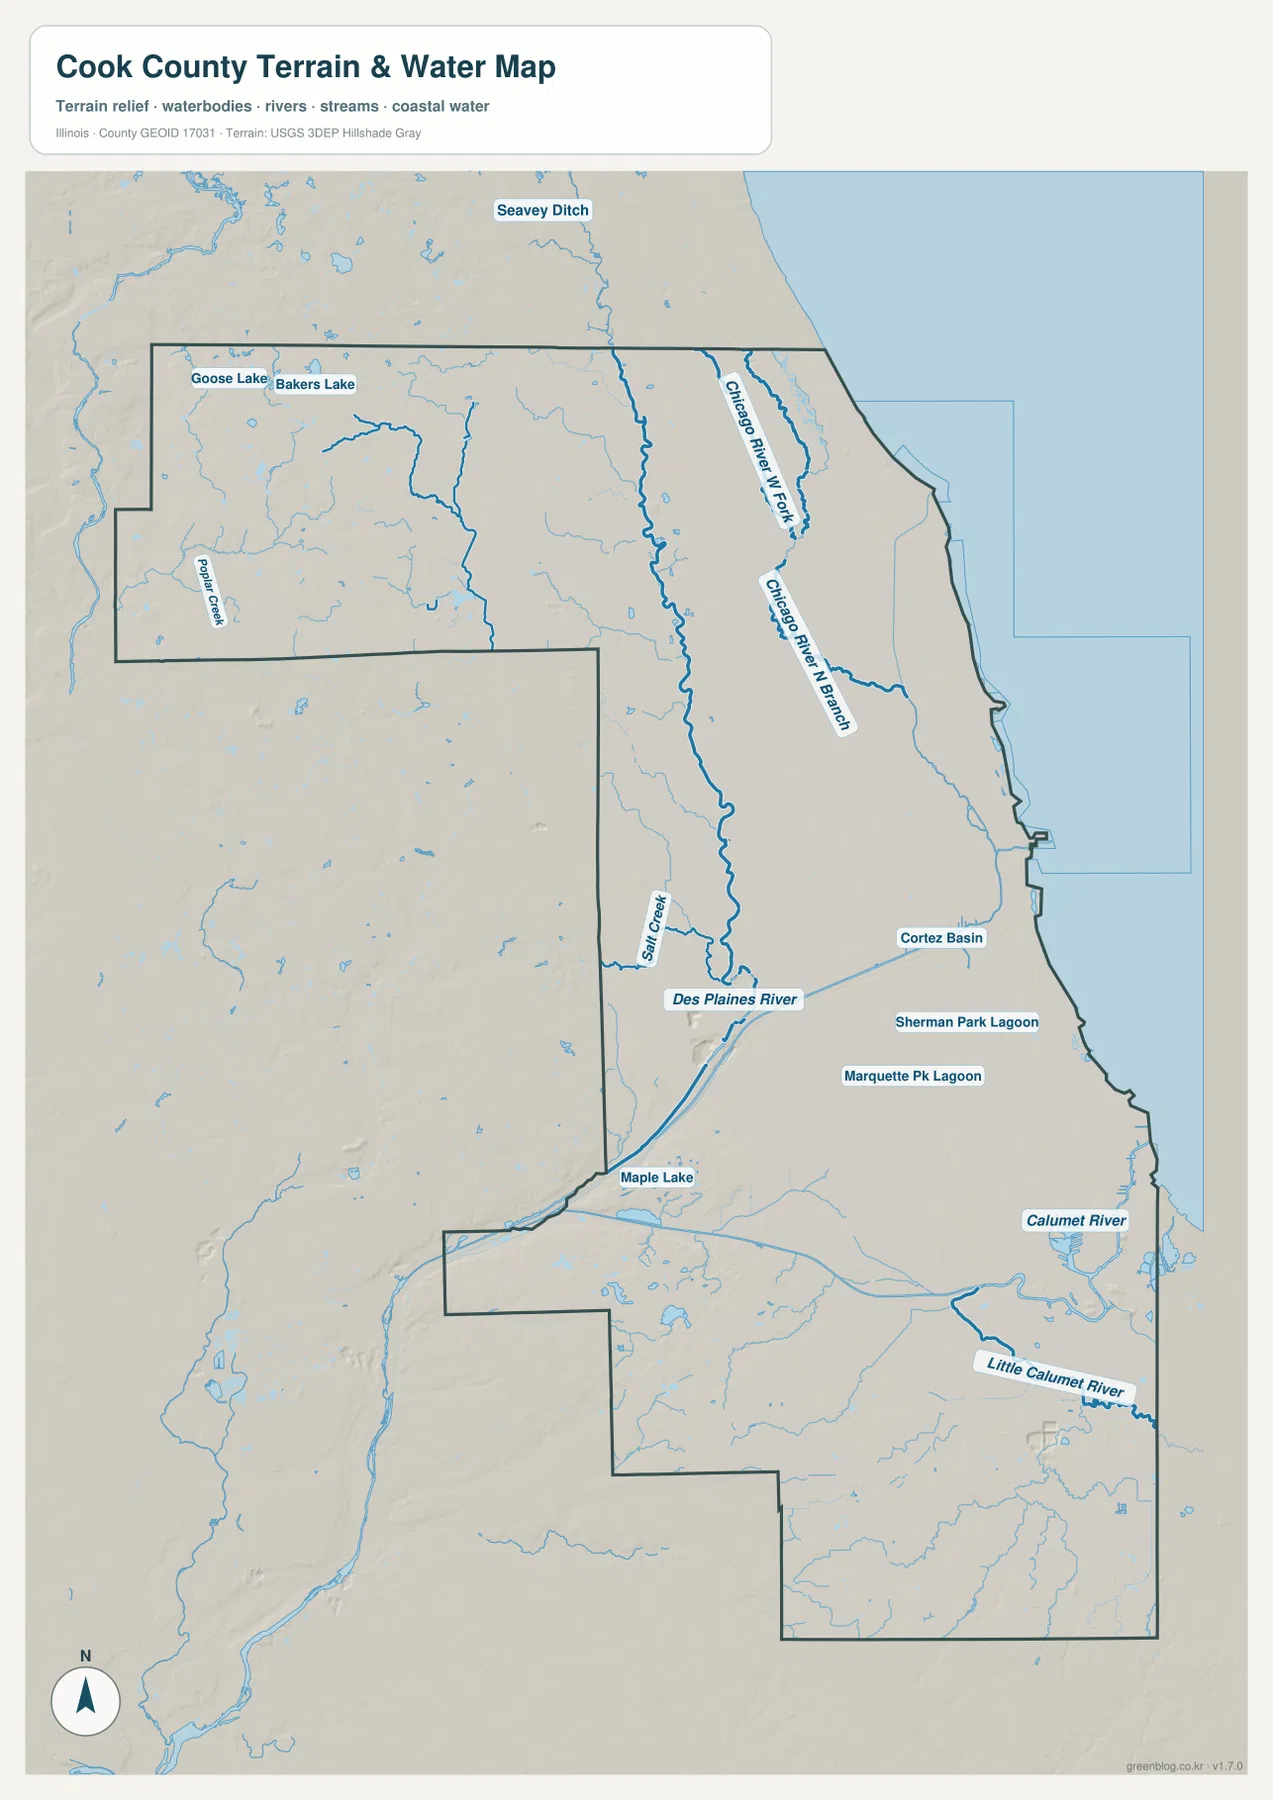
Forest Preserves of Cook County identifies Chicago River, Des Plaines River, and Little Calumet River as three major rivers that run through its preserve system. The agency also names Salt Creek and Poplar Creek among the smaller streams crossing protected lands. Those official local references match the water labels on the supplied map and show that the rivers remain important organizing features even within one of the country’s most heavily urbanized counties.
Water location does not replace current flood or access information
The terrain sheet is useful for locating Lake Michigan, rivers, creeks, lakes, and lagoons relative to the county boundary. It does not report current river stage, flood risk, water depth, navigation conditions, water quality, or access rules. Questions about the Chicago, Des Plaines, or Calumet systems should be checked against current USGS and responsible-agency information.
Northwest high ground stands above the lakefront lowlands
The elevation map shows Cook County’s strongest contrast in the northwest. Brown and orange terrain covers the Barrington Hills-Palatine side, while the colors become progressively greener toward the central county and Lake Michigan. The Chicago side and much of the eastern corridor are broadly low. A separate belt of somewhat higher relief returns near the southwestern edge, so the county is not a simple one-direction slope from northwest to southeast.
The map prints an actual countywide elevation range of about 77 to 288 meters and a mean near 201 meters. Its color legend uses bands from roughly 178 to 260 meters, while the separate “Actual” line records a wider minimum and maximum in the underlying dataset. Those endpoints describe Cook County as a whole; they should not be assigned directly to Chicago, Barrington Hills, Orland Park, or any individual address.
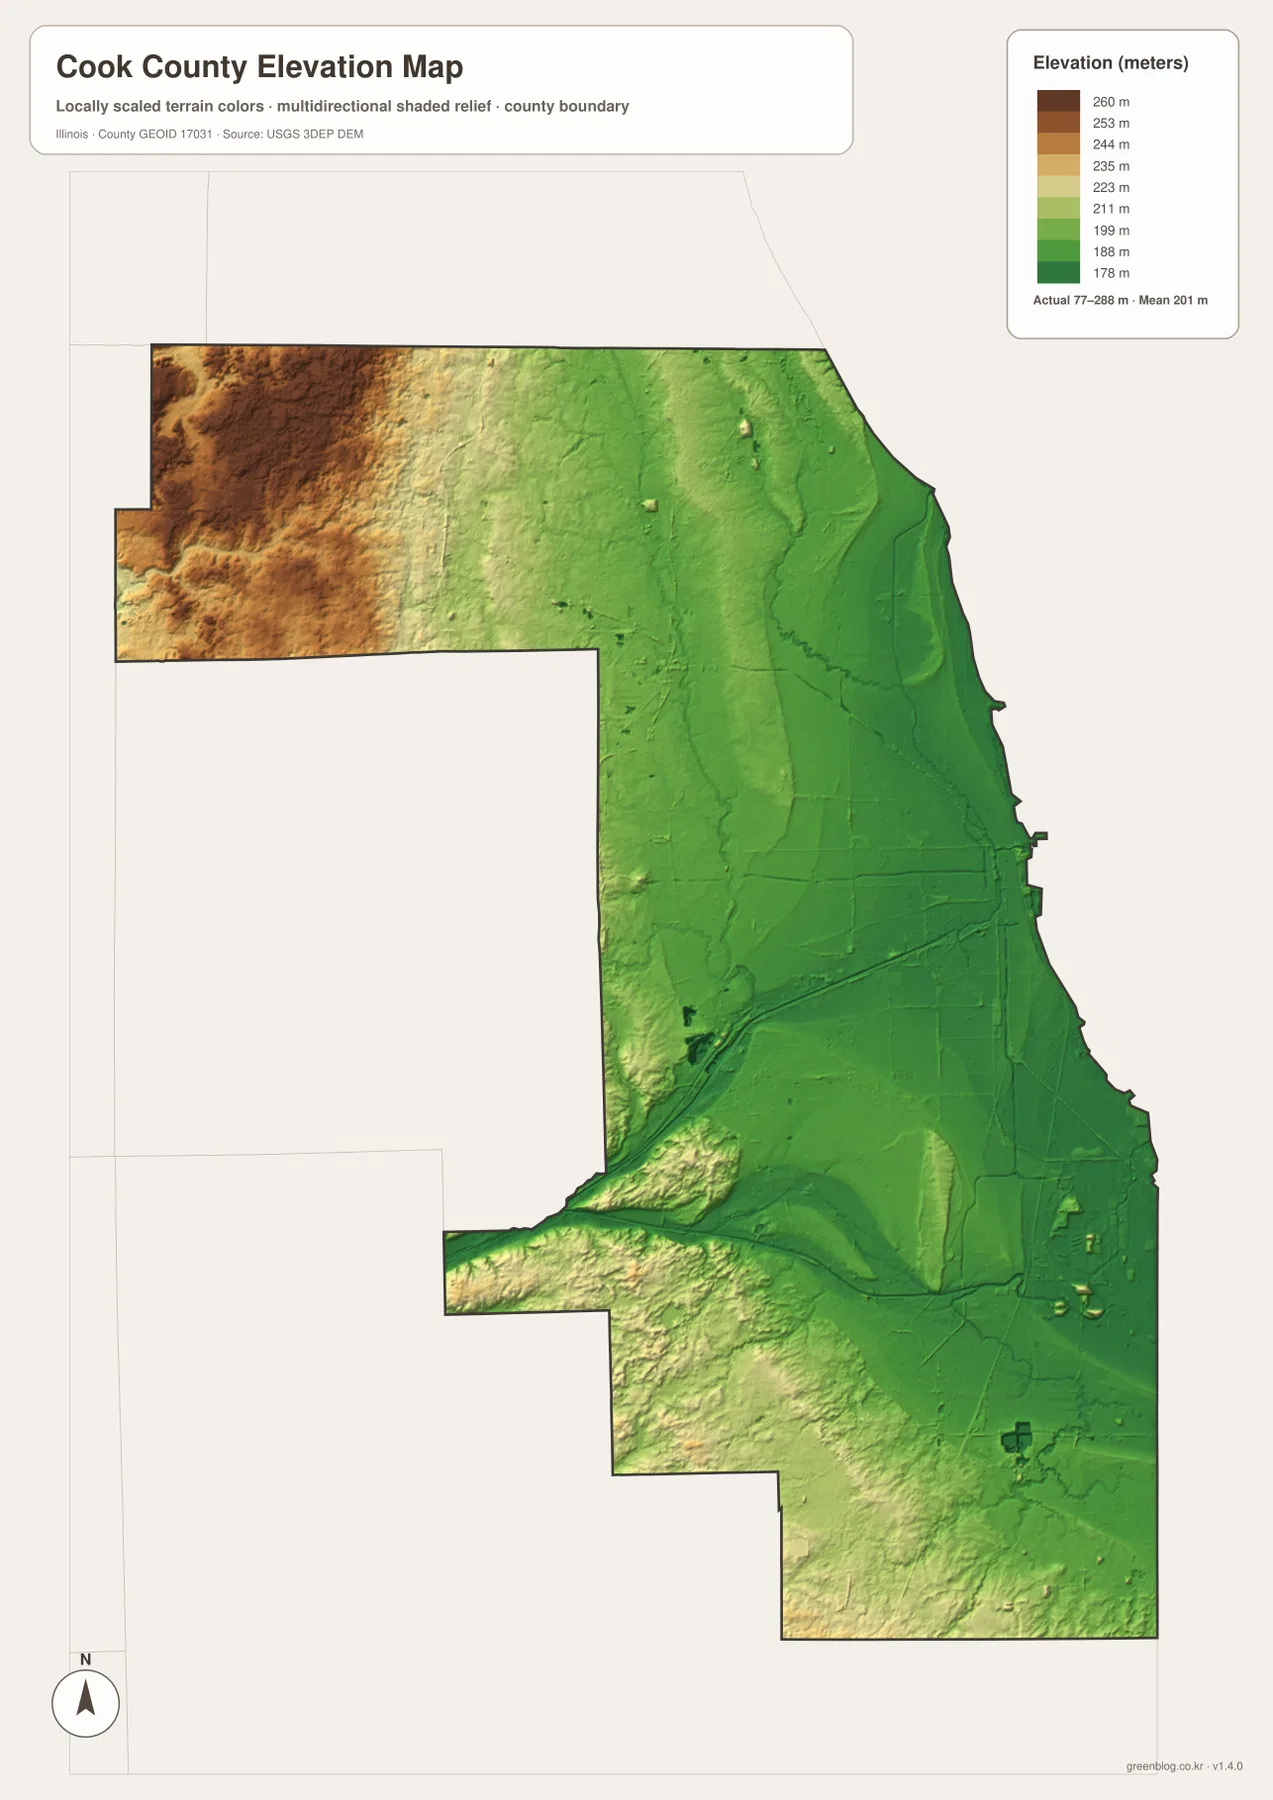
Comparing the elevation and water sheets makes several low corridors easier to recognize. Des Plaines River and Chicago River occupy greener terrain than much of the northwest upland, and the Lake Michigan side is broadly low. Near the southwest, higher relief rises close to the Des Plaines corridor. Even in a strongly urban county, the relationship between rivers and terrain remains visible when the road network is removed.
77 to 288 meters is a countywide data range
A building site, road grade, drainage design, or parcel requires point-specific elevation data or a professional survey. The 77–288 meter range belongs to the countywide dataset printed on the map and is most useful for comparing the northwest uplands, central river corridors, and low Lake Michigan side.
Keep Chicago fixed while switching between suburbs, water, and relief
Cook County contains too many place names to memorize efficiently from one crowded sheet. A better method is to keep Chicago as the eastern anchor and add a few outer reference points: Schaumburg or Palatine to the northwest, Orland Park to the southwest, and Chicago Heights to the southeast. The city map then reduces that complexity to Chicago-Cicero, Evanston, and the northwest suburban cluster.
On the water map, add Chicago River and Des Plaines River to the same mental framework, then look south to the Calumet and Little Calumet rivers. The elevation image completes the comparison by showing lower lakeshore and central terrain against higher northwest ground. Moving through the files this way keeps the urban geography, waterways, and relief connected instead of treating them as unrelated map types.
Use current transportation sources for driving conditions, dated Census data for population, current agencies for flood, river, or lake questions, and point-level elevation or survey data for site work. Within those limits, the Cook County files are useful for printed references, lessons, presentations, and advance geographic orientation across Chicago and its surrounding suburbs.
Frequently Asked Questions
What is the county seat of Cook County, Illinois?
Chicago is the county seat. Cook County’s official history page says the Fort Dearborn settlement at the mouth of Chicago River became the seat when the county was created in 1831, and Chicago remains the location of the county’s central offices.
Is the CITY INDEX value for Chicago a current population count?
This page does not treat it as current population because the supplied city graphic does not show a census year or statistical reference date. The printed value of 2,711,226 for Chicago and the other five CITY INDEX values should be understood only as undated map data unless a separate dated source confirms them.
Does 77 to 288 meters give Chicago’s elevation?
No. The elevation image identifies 77–288 m as the actual range across the Cook County dataset and gives a mean of about 201 m. Exact elevation for Chicago or any specific road, building, or property requires point-specific elevation or survey data.
Sources and Reference Material
The article uses the supplied Cook County maps together with the official references below. For current transportation, river stages, park rules, legal boundaries, or exact point elevations, consult the responsible agency’s latest material rather than relying on a static county reference map.
- Cook County – About Cook County – 1831 county creation, Chicago county-seat history, and county overview
- Forest Preserves of Cook County – Our Ecosystems – Chicago, Des Plaines, and Little Calumet rivers plus major creek context
- U.S. Census Bureau TIGER/Line Shapefiles – county boundaries and geographic reference data
- USGS National Hydrography – river, stream, and lake reference data
- USGS 3D Elevation Program – elevation and terrain data
Map File Information
The ZIP file contains the high-resolution JPG originals for the Cook County overview, city map, terrain-and-water map, and elevation map. Each portrait image measures 2,572 × 3,638 pixels, preserving suburb names, highway numbers, river labels, and terrain colors more clearly when enlarged or printed.
- Included Files: 4 high-resolution JPG maps
- Printable Size: 2,572 × 3,638 pixels each
Related Maps
Green Map creates custom-edited map images using open geographic data sources such as geoBoundaries, Natural Earth, OpenStreetMap, and government open data.
These maps are edited visual materials, not raw data files, and are provided for education, documents, presentations, and graphic reference.