Chickasaw County sits in northeastern Mississippi with two important administrative centers rather than one obvious center on the map. Houston lies in the western half of the county, while Okolona is close to the eastern side. New Houlka and Van Vleet help fill the northern interior, and Woodland occupies the distinctive southwestern extension of the county boundary. Looking at these places together makes the county’s road pattern, waterways, and rolling relief much easier to understand.
This page provides four map views of the same county: a general county map, a Houston-centered city-connections map, a terrain-and-water map, and an elevation map. The WebP images are optimized for reading on the page, while the download box later in the article links to a ZIP containing the four high-resolution JPG originals. You can therefore use the simpler map for place and road orientation, then switch to the water or elevation view when the natural landscape matters more.
Table of Contents
Two centers shape the road layout: Houston in the west, Okolona in the east
The general county map immediately separates Houston from Okolona. Houston is positioned in the western-central part of Chickasaw County, with the Chickasaw County Sheriff’s Office labeled nearby. Okolona sits much farther east, close to the county edge and near the routes numbered 32, 41, and the 45 corridor. The separation matters because a visitor who expects one compact county-seat district could otherwise miss how broadly the county’s main civic references are spread.
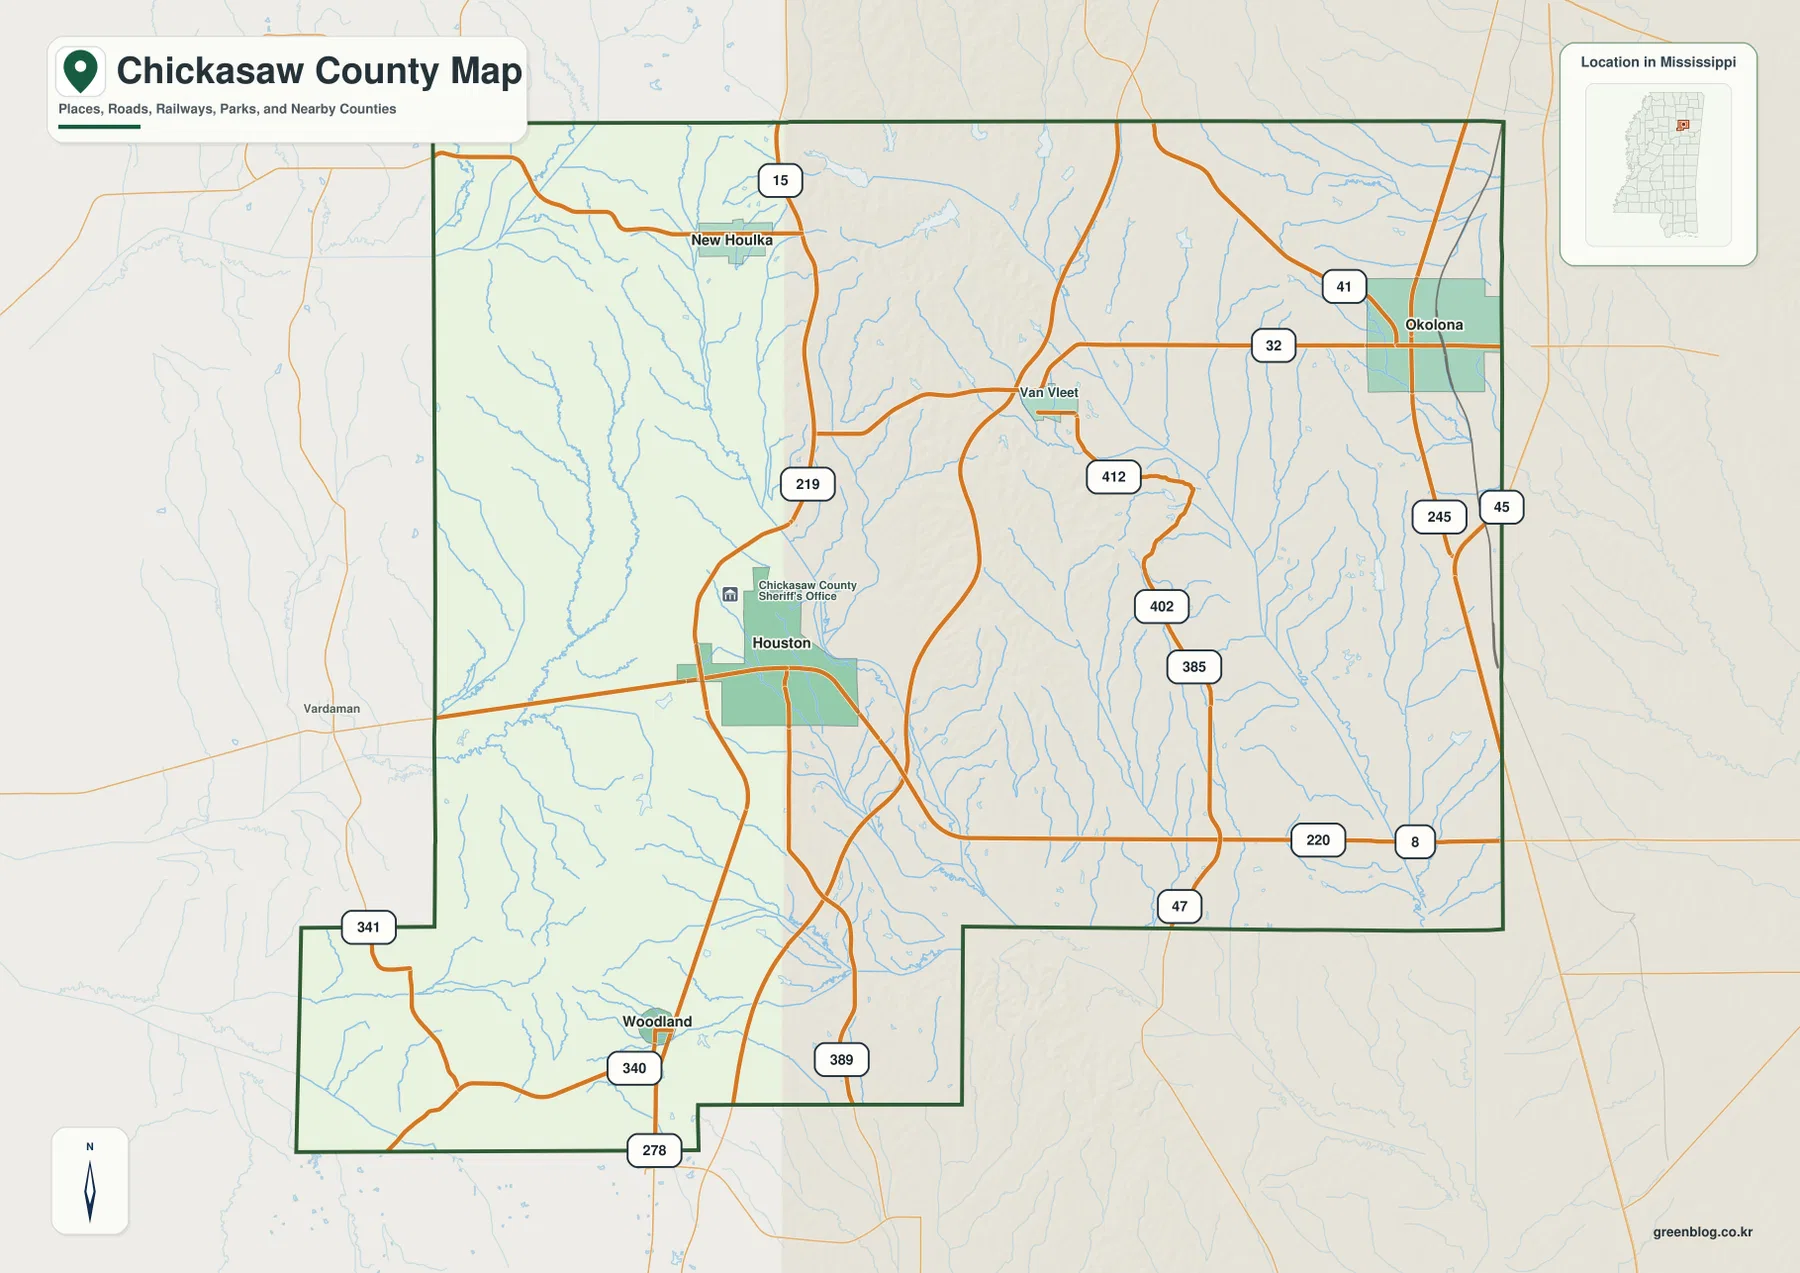
New Houlka appears to the north of Houston along the Route 15 corridor, while Van Vleet provides another northern-interior reference between the two main centers. Woodland is different from all of them because it falls inside the county’s southwestern projection rather than the larger rectangular body. The road shields include 8, 15, 32, 41, 45, 47, and several smaller state or local route numbers. Those labels are useful for regional orientation, but this map is not intended to replace a street-level navigation service.
Population, area, and elevation put the map at a useful scale
The existing county material provides several reference numbers that help place the maps in context. They come from different datasets and reference dates, so they should not be treated as one single-year statistical snapshot. The table below keeps the original values separate and adds the elevation range printed on the supplied relief map.
| Reference | Value | How to read it |
|---|---|---|
| FIPS | 28017 | Identifier for Chickasaw County, Mississippi |
| 2020 census population | 17,106 | Decennial census count |
| July 2025 estimate | 16,730 | Later estimate with a different reference date |
| 2025 Gazetteer area | 501.782 sq mi land; 2.464 sq mi water | County area, not land-cover percentages |
| Elevation map | about 68–178 m; mean 102 m | Generalized county-wide terrain reference |
The earlier county material also gives a 2020 land-area density of 34.1 residents per square mile. That is a county-wide average based on population and land area; it does not mean residents are evenly spread across Houston, Okolona, smaller communities, farms, wooded hills, and creek valleys. The settlement map makes that limitation visible because only a few named communities act as strong reference points across a relatively large county area.
From Houston, Okolona is 16 miles away on the connector map
The city-connections map uses Houston as the hub and compares three named places with it. Okolona is marked 16 miles from Houston, while New Houlka and Woodland are each marked 9 miles away. These are straight-line distances between mapped points, not driving distances along the road network. They are best used to compare relative position and spacing, especially when the general county map feels busy with route numbers and streams.
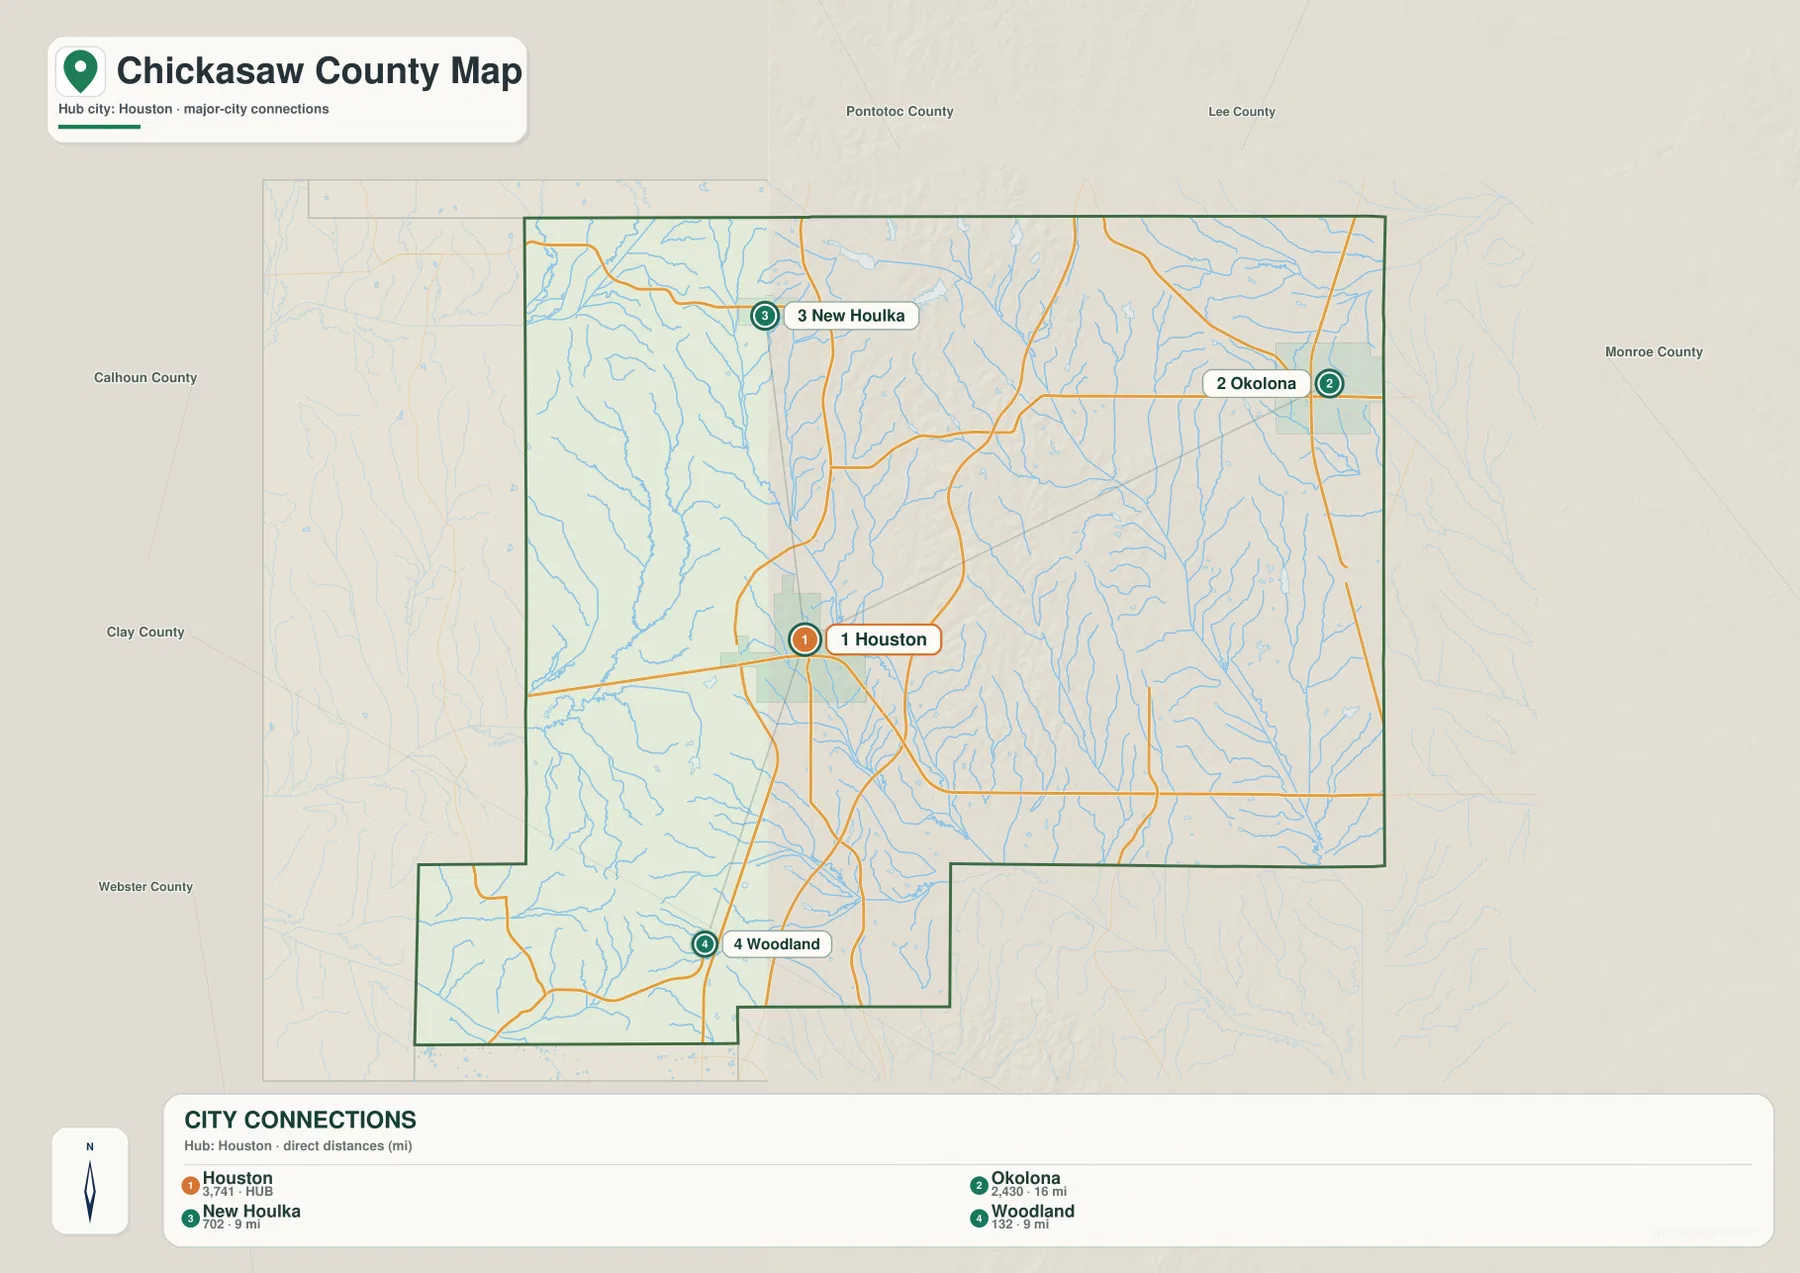
The same map also labels neighboring counties around the outside: Pontotoc to the north, Lee toward the northeast, Monroe to the east, Calhoun to the west, and Clay and Webster toward the southwest side. This surrounding context is especially useful for Okolona, which is visually close to the eastern edge, and for Woodland, which sits low in the southwestern extension. Instead of reading the four towns as an isolated list, the map shows how each one occupies a different part of the county.
The numbered markers on this connector map are not a ranking of cities, seats, or population. Houston is simply the selected hub for measuring the direct connections. For practical travel, the actual road route may be longer because roads bend around terrain, waterways, property lines, and intersections. If the question is “Which community lies closest to Houston on this map?” the connector view is useful; if the question is “Which road should I drive?” the general road map and a current navigation service are better choices.
Yalobusha River and Skuna River frame a dense network of smaller watercourses
The terrain-and-water map changes the emphasis completely. Along the western side, the Yalobusha River forms the most prominent named channel, while the Skuna River appears near the northwestern edge. Smaller creeks branch through the interior, and several named lakes provide local water references. Davis Lake is shown in the northern part of the county; Simpson Lake and Scarborough Lake appear farther west and southwest; Lazy K Lake and Childs Lake are labeled in the southern portion.
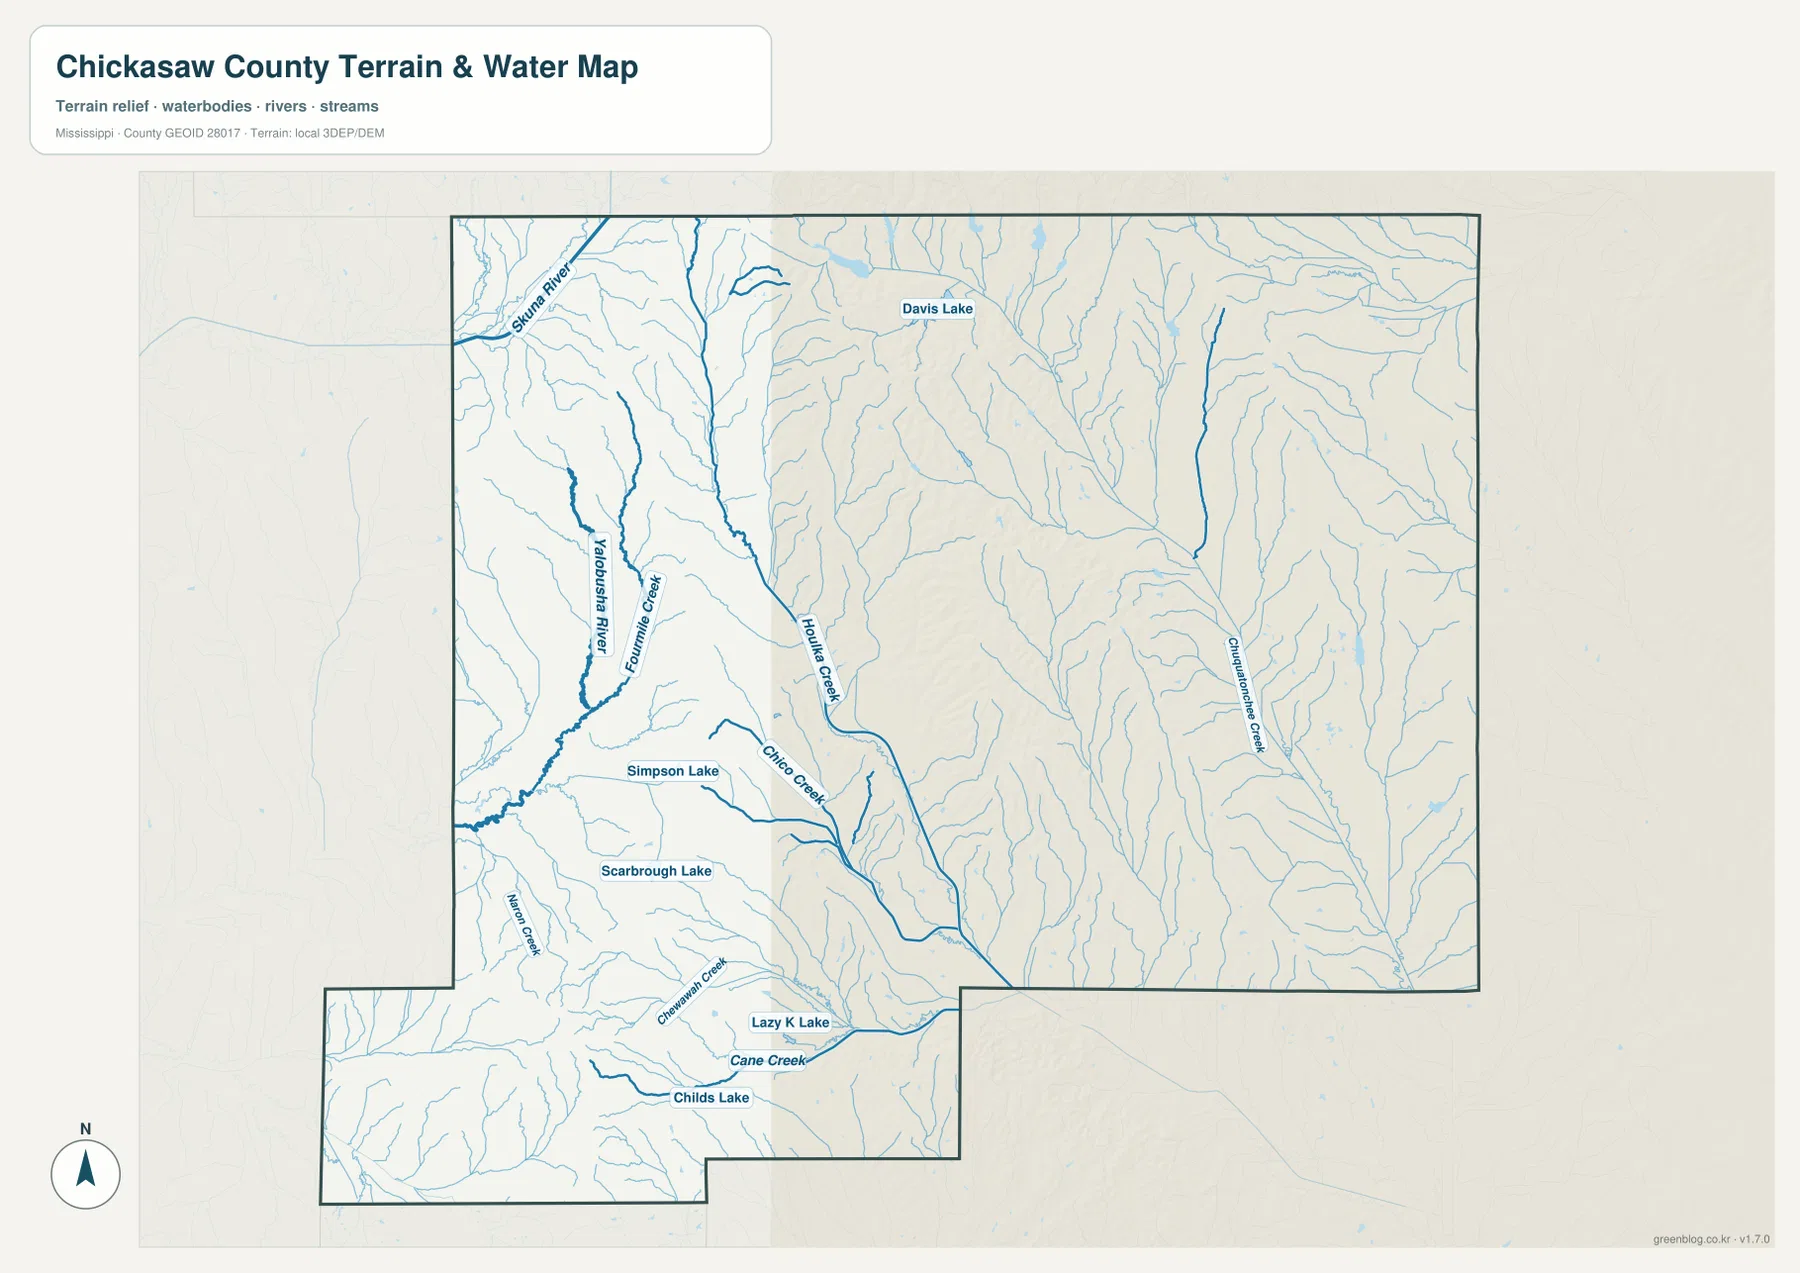
On the general map, many of the small streams are secondary visual details behind roads and place labels. Here they become the organizing feature. Tributaries occupy long, narrow valleys across the county, especially through the central and eastern sections. The western side has the stronger visual anchor of the Yalobusha River, while the interior contains numerous smaller branches. This helps explain why a simple road grid does not tell the whole geographic story.
This water map should be read as a location and terrain reference, not as a flood-risk, parcel, legal, or navigation product. It does not show flood probabilities, expected water depth, property ownership, or safe boating routes. For this article, its value is much simpler: it shows where the larger rivers, named lakes, and smaller drainage lines sit in relation to the county’s shape.
Relief ranges from about 68 to 178 meters, with higher ridges in the middle
The elevation map lists an actual county range of about 68 to 178 meters and a mean elevation of 102 meters. Rather than rising steadily from one edge to another, the county contains a repeated pattern of ridges and valleys. The most prominent higher terrain appears through the central and north-central area, where brown and tan colors form broad, branching hill masses. Lower green corridors cut between them and continue toward the eastern side.
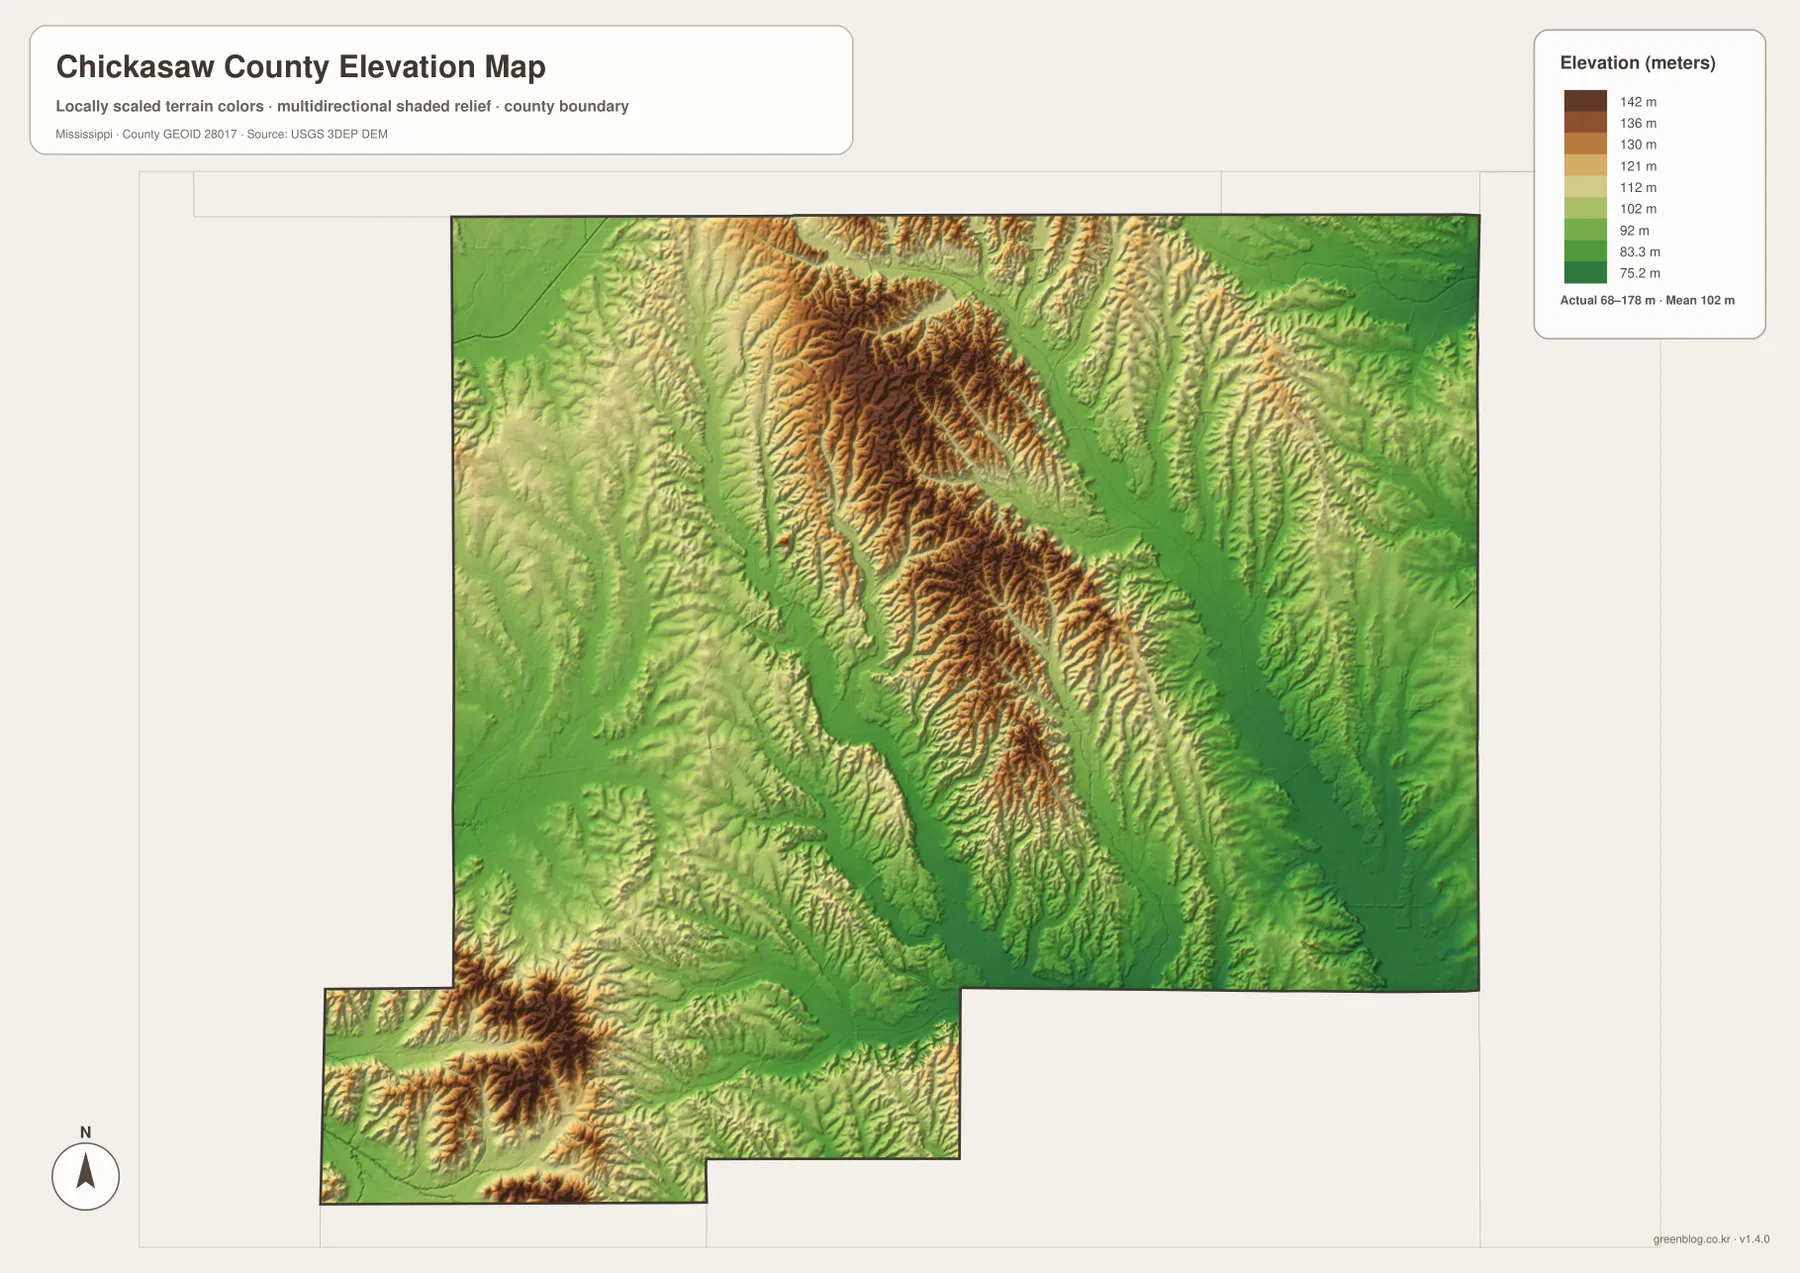
The southwestern projection has its own smaller patches of higher ground, while the eastern half contains several long north-south valley forms. When the elevation and water maps are viewed side by side, many low corridors line up with the places where streams and tributaries are concentrated. That does not mean every green strip is a named stream, but it does show the close relationship between local relief and drainage.
The colors are scaled to make local elevation differences visible inside Chickasaw County. They should not be compared by color alone with a different county map, because another map may use a different local scale. The surface is also a generalized terrain product rather than a survey-grade measurement. Engineering, construction, drainage design, or legal work requires the appropriate original elevation or survey data.
Why Houston and Okolona look different in each map view
Houston is a good example of why the four images are not redundant. On the general map, it is a western road and administrative reference. On the connector map, it becomes the hub used to measure the three straight-line distances. The water map shifts attention away from the town label toward nearby valleys and streams, while the elevation view makes the contrast between lower corridors and the central hill country more important than the road network.
Okolona changes in the same way. The county map makes its eastern position and nearby route corridors clear, and the connector map turns it into a point 16 miles from Houston. The natural-landscape maps, however, show the long valleys and tributary network of the eastern side more strongly than the city itself. A reader preparing a school report, a presentation, or a location handout can therefore choose a map based on the question rather than trying to make one image serve every purpose.
Choose the file by the question you need to answer
Use the general county map when the main task is to place Houston, Okolona, New Houlka, Van Vleet, and Woodland against the county boundary and selected roads. The connector map is cleaner when you need a quick comparison of the three Houston-to-community distances. For rivers, lakes, and branching creeks, the water map removes much of the road emphasis. The elevation map is the best choice when the contrast between ridges and valleys is more important than town names.
- County orientation: compare named communities, road corridors, and the unusual southwestern boundary extension.
- Relative city spacing: compare Houston with Okolona, New Houlka, and Woodland using the printed straight-line distances.
- Water features: locate the Yalobusha River, Skuna River, named lakes, and smaller tributaries.
- Terrain: show the roughly 68–178 m range and the higher central ridges separated by lower valleys.
Three location details that are easy to miss
First, Houston and Okolona should both remain in view when describing county administration because they occupy different sides of the county. Second, New Houlka and Van Vleet are not interchangeable northern labels: New Houlka sits along the Route 15 side north of Houston, while Van Vleet lies farther east near a cluster of connecting roads. Third, Woodland is located in the southwestern projection, so a cropped view of only the large main rectangle could leave out an important named community.
The same caution applies to the natural features. The Yalobusha River is the strongest named western water feature, but it is not the only useful water reference. The Skuna River, multiple interior tributaries, and several named lakes make the drainage picture more complex. On the elevation map, those water-bearing low areas are separated by repeated ridges rather than one continuous plateau. Returning to the general map after viewing the water and elevation layers gives the road and settlement pattern more geographic context.
Frequently Asked Questions
Is Houston or Okolona the county seat of Chickasaw County?
Both Houston and Okolona serve as county seats. They are separated across the county rather than forming one shared urban center, so a useful Chickasaw County map should keep both places visible when administrative geography is being explained.
Are the 9-mile and 16-mile city connections driving distances?
No. The city-connections map uses straight-line distances from Houston. It shows Okolona at 16 miles and New Houlka and Woodland at 9 miles. Actual driving distance and travel time depend on the available road route and will not necessarily match those numbers.
Where does the higher ground appear on the elevation map?
The strongest concentration of higher relief appears through the central and north-central part of the county, with smaller elevated patches elsewhere, including the southwestern extension. The supplied map reports an overall range of about 68–178 meters and a mean of 102 meters. It is a county-scale reference rather than a survey product.
Map File Information
The download contains the four high-resolution JPG originals that match the map topics shown on this page. Use the original files when you need a sharper image for print, documents, or classroom material.
- Included Files: 4 high-resolution JPG maps described on this page
- File Type: JPG files in a ZIP archive
- Intended Use: Printing, education, presentations, and map-based projects
Related Maps
Sources and References
- U.S. Census Bureau QuickFacts for Chickasaw County – population reference
- U.S. Census Bureau Gazetteer Files – land and water area reference
- USGS National Hydrography – hydrography reference
- USGS 3D Elevation Program – elevation reference
- Mississippi Department of Transportation official highway map – route reference
Green Map creates custom-edited map images using open geographic data sources such as geoBoundaries, Natural Earth, OpenStreetMap, and government open data. These maps are edited visual materials, not raw data files, and are provided for education, documents, presentations, and graphic reference.