Horry County Map files on this page show the county from three useful angles: roads and places, the distribution of six major cities, and the network of rivers, creeks, lakes, and coastal water. The same maps are available as a downloadable ZIP containing three high-resolution A3 JPG files. For a quick orientation, Conway serves as the main inland reference while Myrtle Beach, North Myrtle Beach, and Surfside Beach form a clear line of coastal communities. Loris and Aynor add two inland points farther north and west, making it easier to see that Horry County extends well beyond the beach corridor.
The maps are most useful when read together rather than treated as different versions of the same graphic. The county map carries road numbers, place names, county limits, and surrounding references. The city map removes much of that detail so the relative positions of Myrtle Beach, Conway, North Myrtle Beach, Surfside Beach, Loris, and Aynor stand out immediately. The terrain and water map shifts attention away from highways and toward the Waccamaw River, Kingston Lake, smaller creeks, inland lakes, and the broad strip of coastal water along the eastern edge.
Table of Contents
From inland Conway to the long Myrtle Beach shoreline
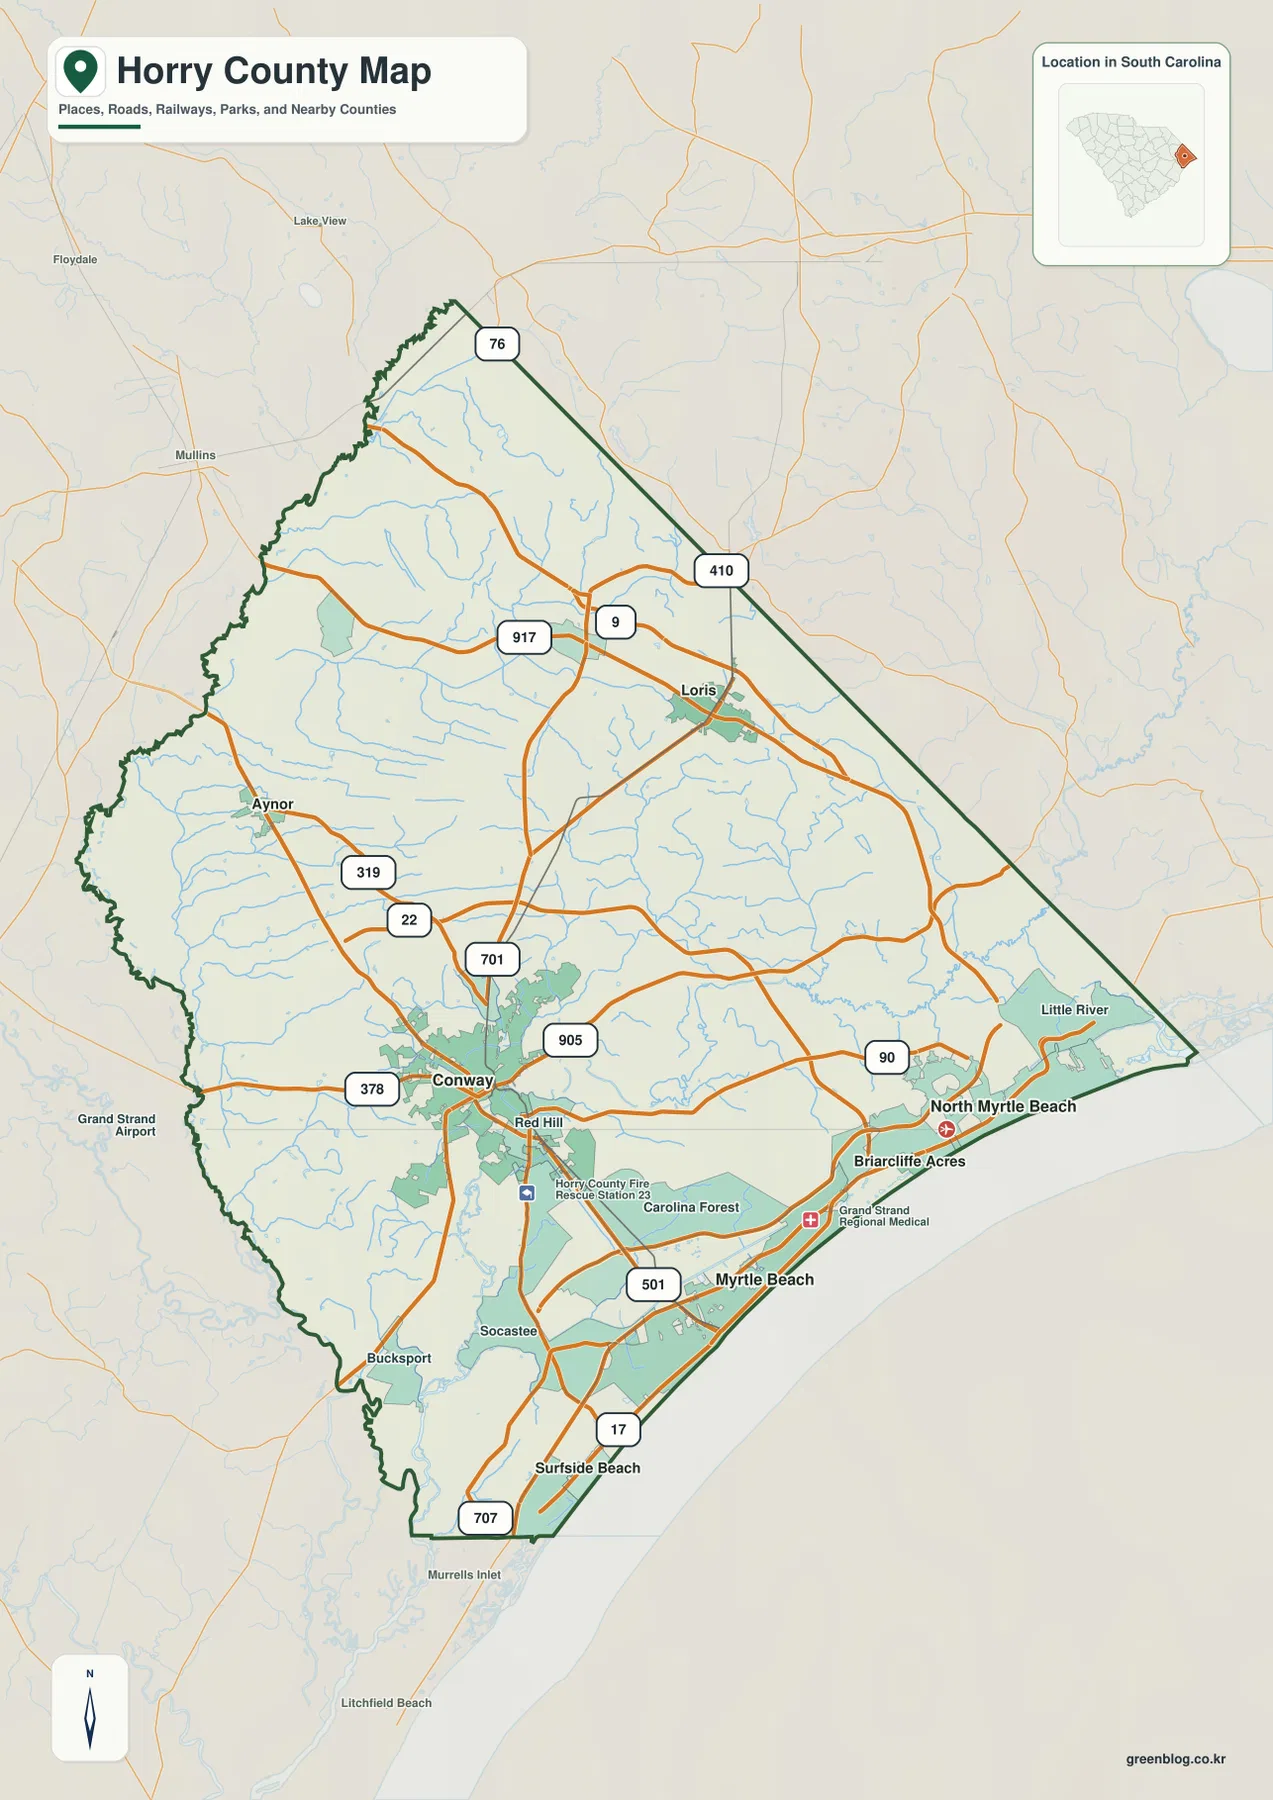
The county map makes the inland-to-coast contrast easy to follow. Conway sits in the southern interior where several numbered roads converge, including 501, 701, 378, and 905. Moving southeast brings the map toward Myrtle Beach, where US 17 runs along the coastal side and 501 approaches from inland. Surfside Beach appears farther south near 17 and 707, while North Myrtle Beach lies to the northeast with Route 90 connecting back toward the interior. Farther north, Loris is surrounded by the 9, 410, and 917 labels. Aynor sits to the west near 319 and the broader inland road network.
This arrangement gives the county a very different visual character from a compact urban county. Roads around Conway spread in several directions, the coastal corridor runs more nearly north and south, and the northern interior has its own group of routes around Loris. Other labels such as Carolina Forest, Socastee, Little River, Red Hill, Bucksport, and Briarcliffe Acres provide additional local reference points. They are useful for orientation because they show that development and named places are not confined to a single center.
The boundary itself is worth noticing. The eastern side follows the long coastal edge, while the northeastern tip narrows near Little River. The western and northwestern sides are more irregular. Background labels outside the dark county outline, including Mullins, Lake View, and Murrells Inlet, should be read as surrounding references rather than Horry County places. A small inset in the upper-right corner shows the county’s position along the eastern side of South Carolina, helping readers connect the detailed county shape to the statewide map.
Six cities reveal a coastal group and a separate inland pattern
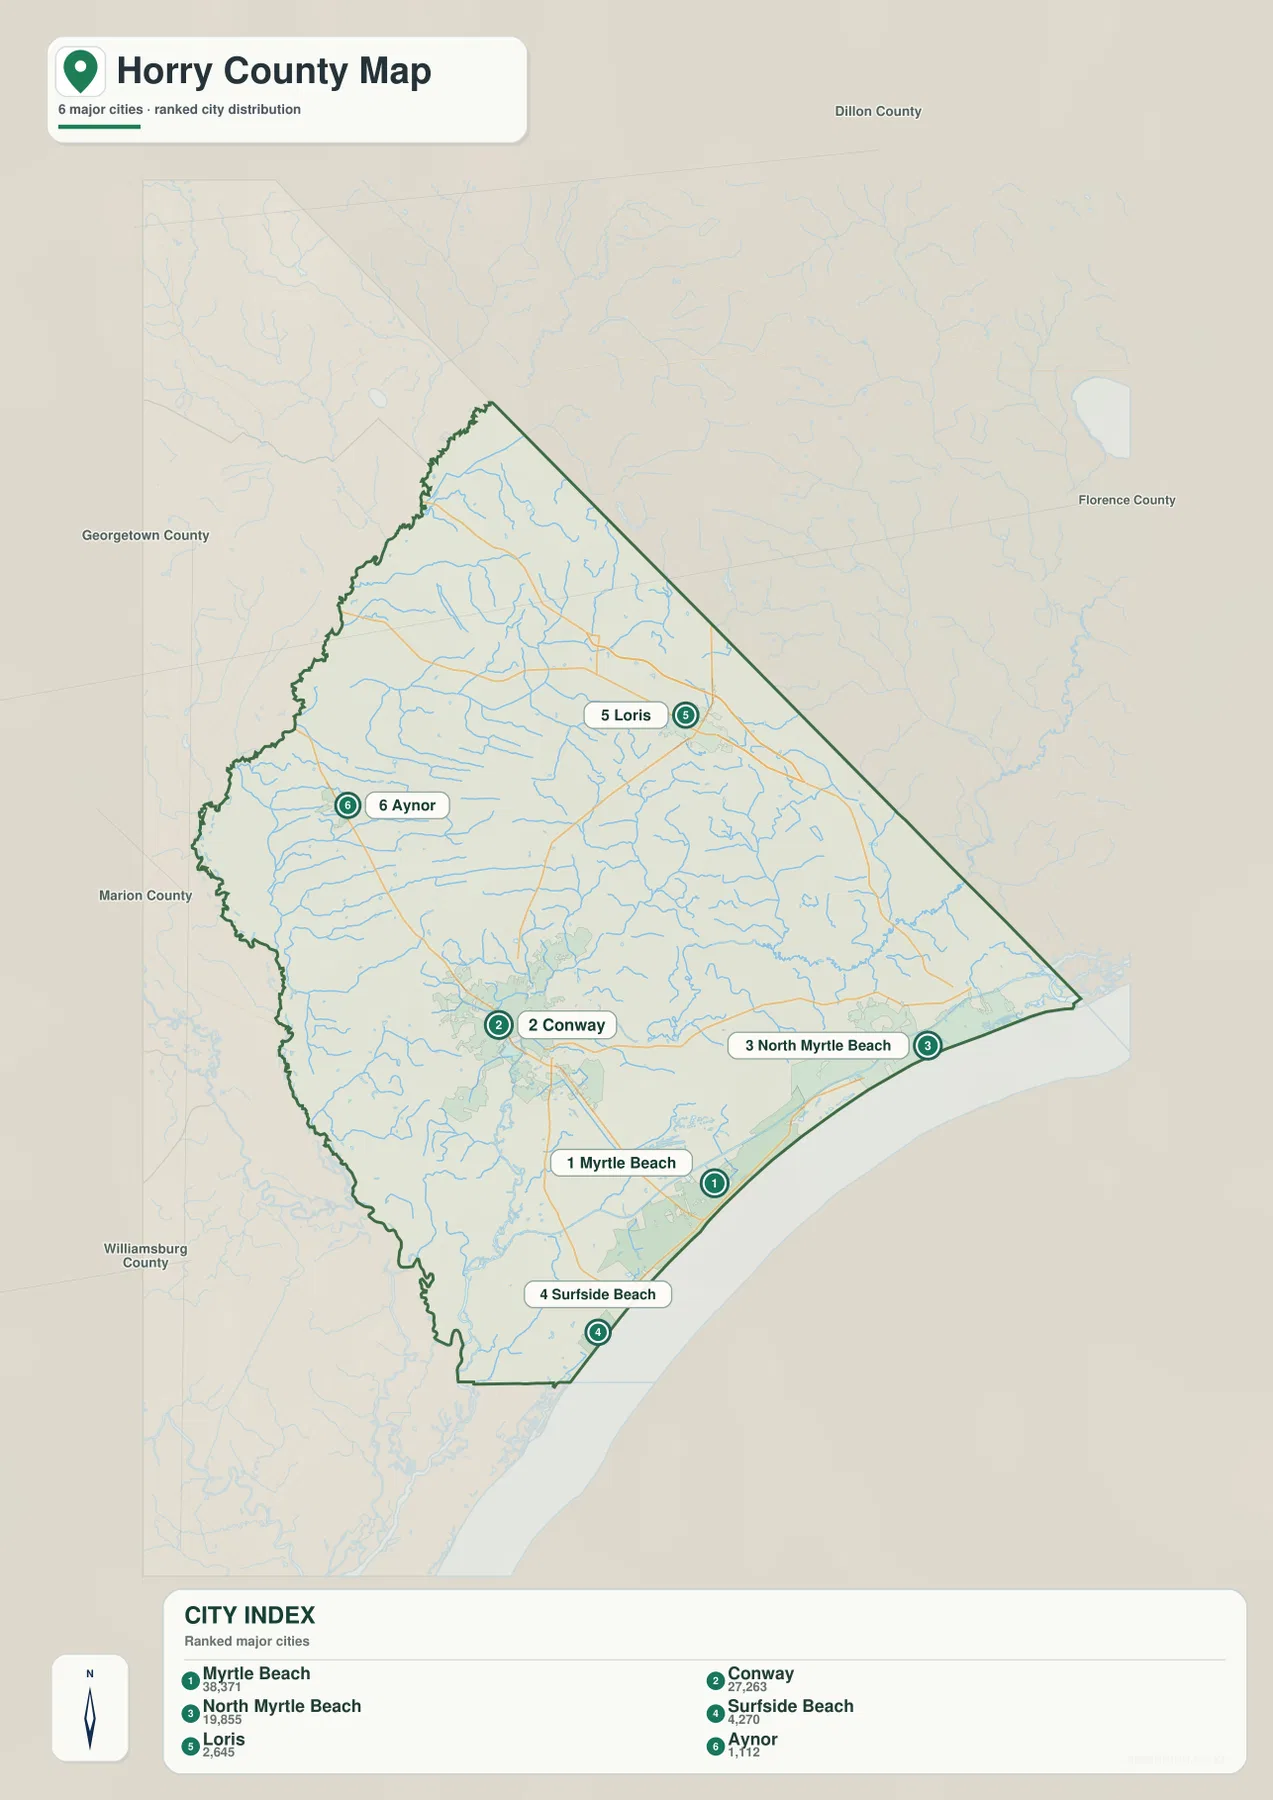
The city map ranks and labels six major cities: Myrtle Beach, Conway, North Myrtle Beach, Surfside Beach, Loris, and Aynor. The index places Myrtle Beach first and Conway second, followed by North Myrtle Beach, Surfside Beach, Loris, and Aynor. The ranking is useful for finding the numbered markers, but the geography is more important than the order. Myrtle Beach, North Myrtle Beach, and Surfside Beach are all positioned on or very close to the eastern coastal edge. Conway sits inland to the west, Loris is farther north, and Aynor is farther west.
That simple layout separates two parts of Horry County that can otherwise blur together on a road-heavy map. The coastal cities form a visible line from Surfside Beach north through Myrtle Beach and on toward North Myrtle Beach. The inland markers are more widely spaced. Conway acts as a central inland reference, while Loris and Aynor show how far the county stretches into the northern and western interior. The city map therefore works well for a presentation or report that needs to explain settlement distribution without requiring readers to sort through every route number or local place label.
Neighboring county names around the outside also provide useful orientation. Georgetown County appears to the west-southwest, Marion County to the west, Dillon County toward the north, Florence County to the north-northeast, and Williamsburg County farther southwest on the background. These labels are not a substitute for a detailed boundary atlas, but they help place Horry County within the surrounding part of South Carolina. The contrast between those landward neighbors and the open coastal side is one of the clearest features of the map.
The Waccamaw River connects a dense inland water network
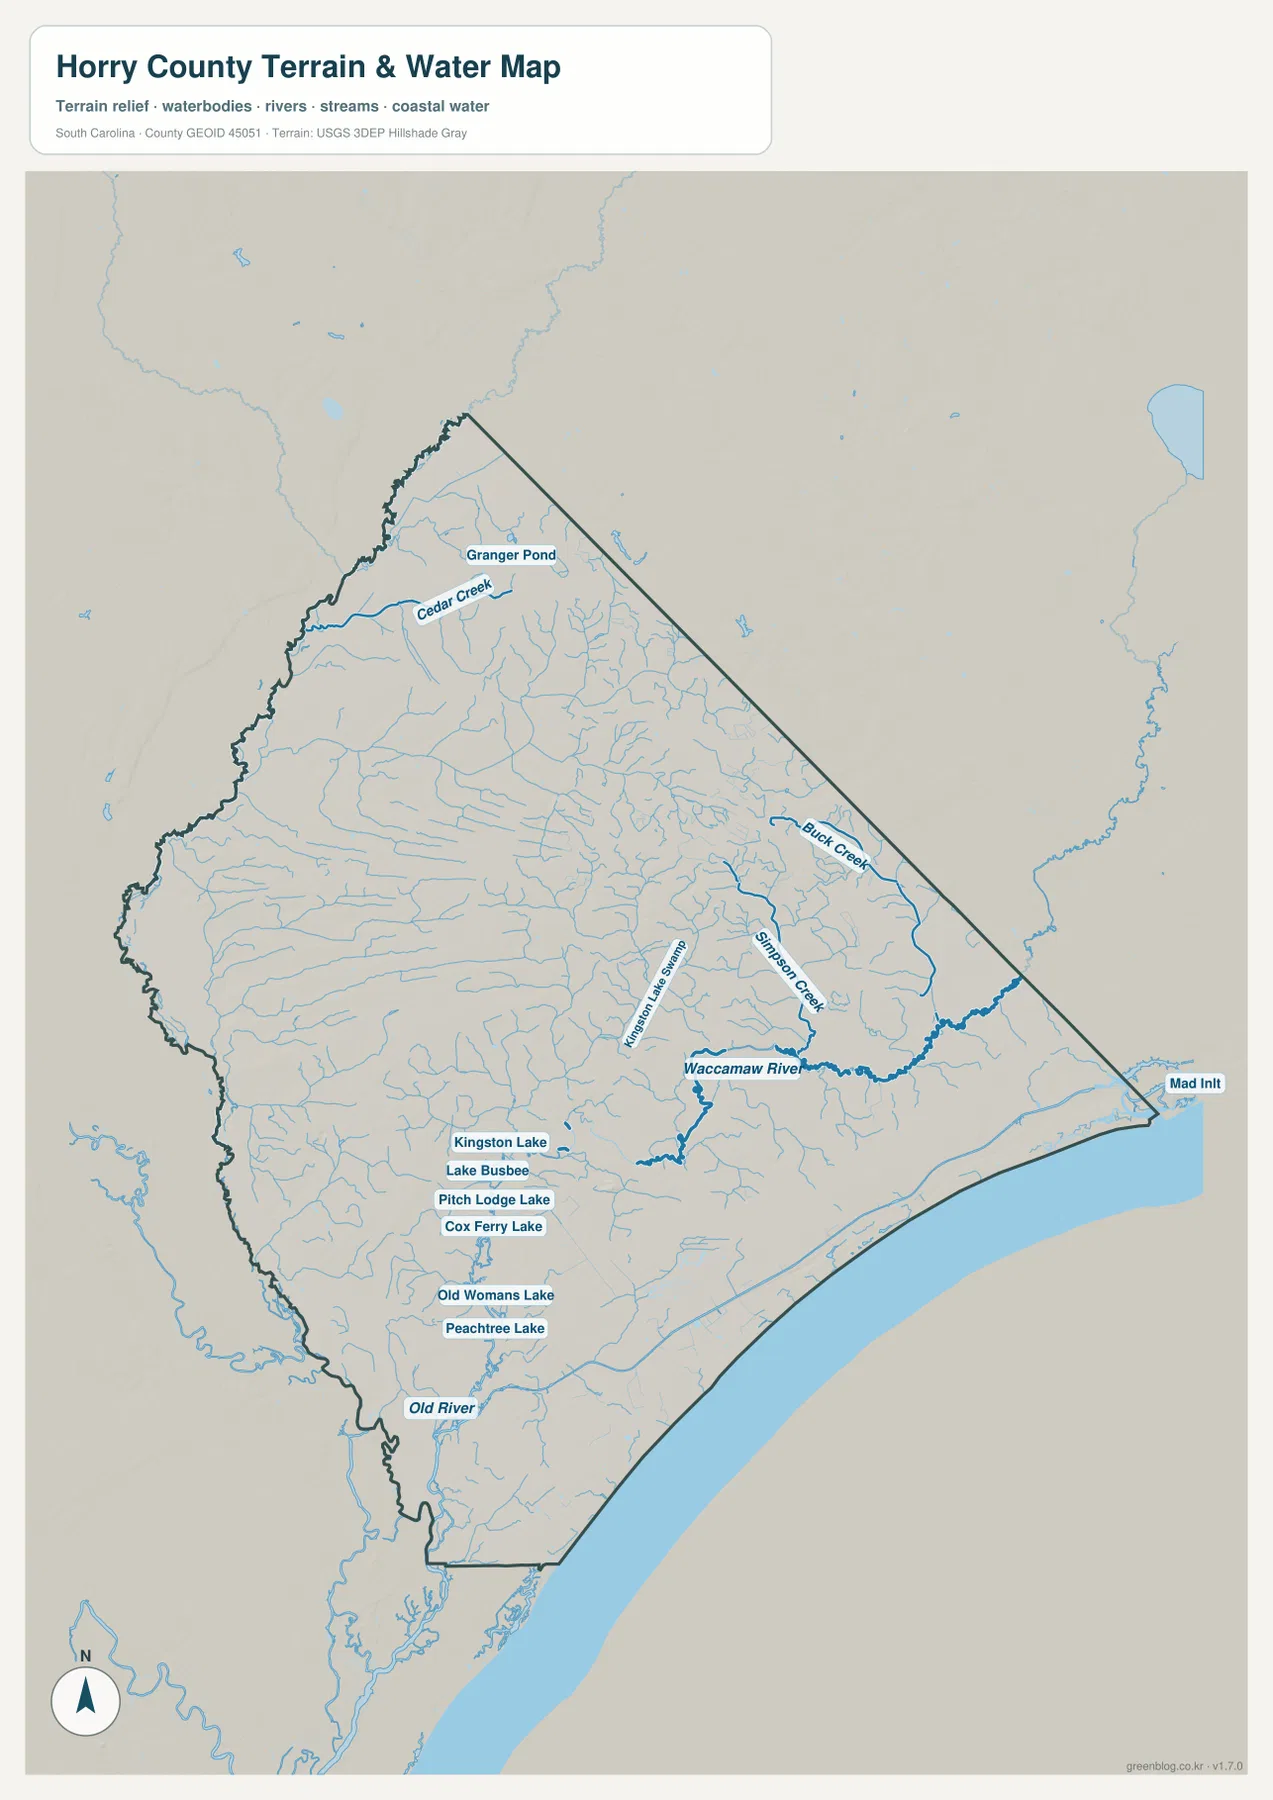
The terrain and water map changes the emphasis completely. The Waccamaw River is the dominant named watercourse and is drawn more strongly than the many smaller branches around it. North and northeast of the river, Buck Creek and Simpson Creek are labeled, while Cedar Creek appears farther to the northwest. Kingston Lake Swamp is marked west of the Waccamaw River. Together with many unnamed blue tributaries, these features show that the interior contains a much denser water network than the road map suggests.
Several named lakes are clustered in the southern interior. Kingston Lake, Lake Busbee, Pitch Lodge Lake, Cox Ferry Lake, Old Womans Lake, and Peachtree Lake all appear within a relatively compact area. Granger Pond is labeled in the north, and Old River is shown near the southwestern side. These names give readers concrete points to search for when comparing the water map with the county map. They also prevent the page from reducing Horry County to the beachfront alone, because much of the map’s hydrologic detail lies inland.
Along the eastern and southeastern edge, a broad band of coastal water creates a strong visual boundary. Mad Inlet is labeled at the northeastern end. The map is useful for understanding where named rivers, creeks, lakes, swamps, and coastal water occur relative to the county outline, but it is not a flood-risk map, a navigation chart, or a legal water-boundary product. The shaded background gives general terrain context rather than survey-grade elevation measurements. For flood zones, navigation, engineering, or property decisions, a purpose-built official dataset is required.
Choosing the map that answers the question fastest
Use the county map when roads and named places matter most. It is the best of the three for following the relationship between Conway and the coast because it combines places with routes such as 17, 501, 701, 905, 90, and 9. Use the city map when the goal is simpler: showing where the six major cities sit inside the county and how the coastal group differs from Conway, Loris, and Aynor inland. Use the terrain and water map when rivers, lakes, creeks, swamps, and coastal water are the subject.
For printed material, the county map can serve as the main orientation figure, with the city or water map added only when the topic calls for it. A local geography handout might pair the city map with the water map to contrast settlement locations with the Waccamaw River system. A road-focused report might use the county map alone. Because the maps share the same county outline but not the same information density, they can be combined without forcing every label onto one crowded graphic.
The three files should still be treated as reference maps rather than live operational tools. Road networks change, and the graphics do not provide turn-by-turn navigation. The water map does not establish flood insurance zones, navigable channels, or legal shorelines. The shaded terrain is generalized and does not replace measured elevation. These limits are important because the maps are designed to make county-scale geography easier to understand, not to replace specialized engineering, legal, or emergency-management products.
Frequently Asked Questions
How do Myrtle Beach and Conway differ on the Horry County maps?
Myrtle Beach is shown on the southeastern coastal side of the county, while Conway is inland to the west. The county map shows Route 501 running between the inland and coastal areas, and the city map makes the separation even easier to see by removing much of the road detail. The maps do not show driving time, so current routing information is still needed for an actual trip.
Which named lakes can I find near the Waccamaw River area?
The terrain and water map labels Kingston Lake, Lake Busbee, Pitch Lodge Lake, Cox Ferry Lake, Old Womans Lake, and Peachtree Lake in the southern interior. It also labels Kingston Lake Swamp, Cedar Creek, Buck Creek, Simpson Creek, Granger Pond, Old River, and the Waccamaw River itself.
Can the terrain and water map be used for flood or navigation decisions?
No. It is a county-scale reference showing water features and generalized terrain context. It does not provide flood-zone boundaries, water depth, navigation channels, parcel lines, legal shoreline limits, or survey-grade elevation. Use the appropriate official source for any decision that requires those details.
Map File Information
Download one ZIP containing the same three maps shown on this page as high-resolution A3 JPG files.
- Included Files: county map, city map, terrain and water map
- File Type: JPG
Related Maps
Sources and map references
- South Carolina Association of Counties – County Information: county information reference
- U.S. Census Bureau TIGERweb: county boundary and location reference
- USGS National Hydrography: rivers, streams, lakes, and water-feature reference
- South Carolina Geological Survey: terrain background reference
Green Map creates custom-edited map images using open geographic data sources such as geoBoundaries, Natural Earth, OpenStreetMap, and government open data.
These maps are edited visual materials, not raw data files, and are provided for education, documents, presentations, and graphic reference.