You can download four high-resolution A3 JPG maps of Montague County, Texas, in one ZIP directly from this page. The package includes a general county map, a Bowie-centered city-connections map, a terrain-and-water map, and an elevation map. Together they show Bowie, Nocona, Montague, Saint Jo, Ringgold, Sunset, roads 82, 175, 59, 101, 81, and 287, named creeks and lakes, and an actual elevation range of about 216 to 403 meters.
The county is easiest to understand by comparing Bowie in the southwest with Nocona farther north and Saint Jo near the eastern side. Bowie has the densest road concentration, while Nocona and Saint Jo sit along the Route 82 corridor with Montague between the two broad settlement areas. The water map adds a second structure beneath those roads: Farmers Creek, Panther Creek, Belknap Creek, Denton Creek, and a chain of small lakes occupy lower valleys, while the elevation map shows the strongest upland relief in the east and southeast.
Table of Contents
Bowie and Nocona anchor different parts of the road network
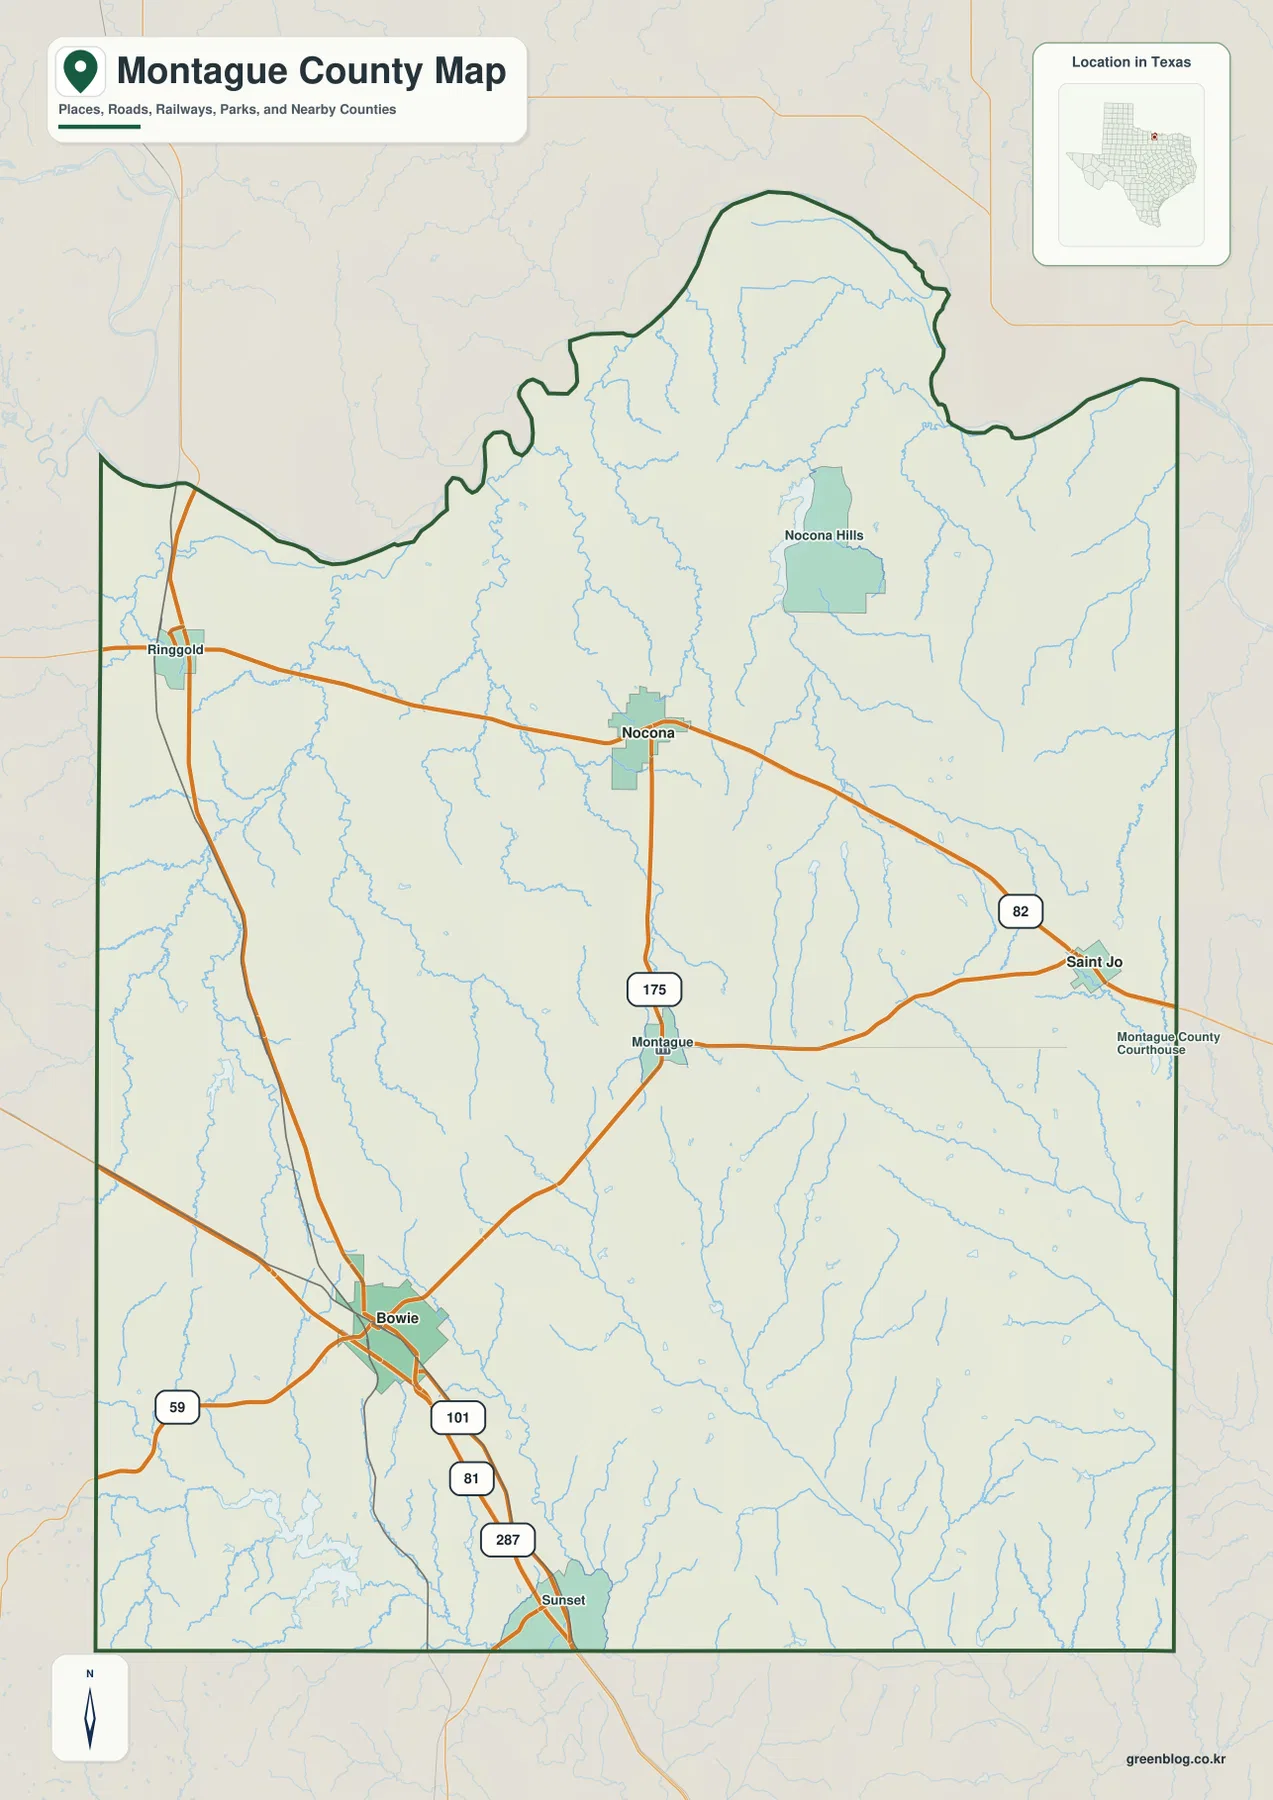
Bowie is the largest developed area on the general county map and lies in the southwest. Route 59 approaches from the west, while roads 101, 81, and 287 are labeled just south of the city. Sunset lies farther south near the county boundary. This makes Bowie the clearest reference for the lower-left side of Montague County.
Nocona sits much farther north along Route 82. Route 175 extends south from Nocona toward Montague, which is shown near the county center. Saint Jo is east of Montague along the same broad Route 82 direction. Reading these three places together makes the northern and central road pattern much easier to follow.
Ringgold lies close to the northwestern boundary, while Nocona Hills appears in the hillier northeastern interior. The county’s northern edge is strongly curved, and the eastern half contains denser stream lines and more obvious terrain shading than the simple road pattern around Bowie. The map therefore works best when roads and physical terrain are read together.
The Bowie hub shows direct distance to Nocona and Saint Jo
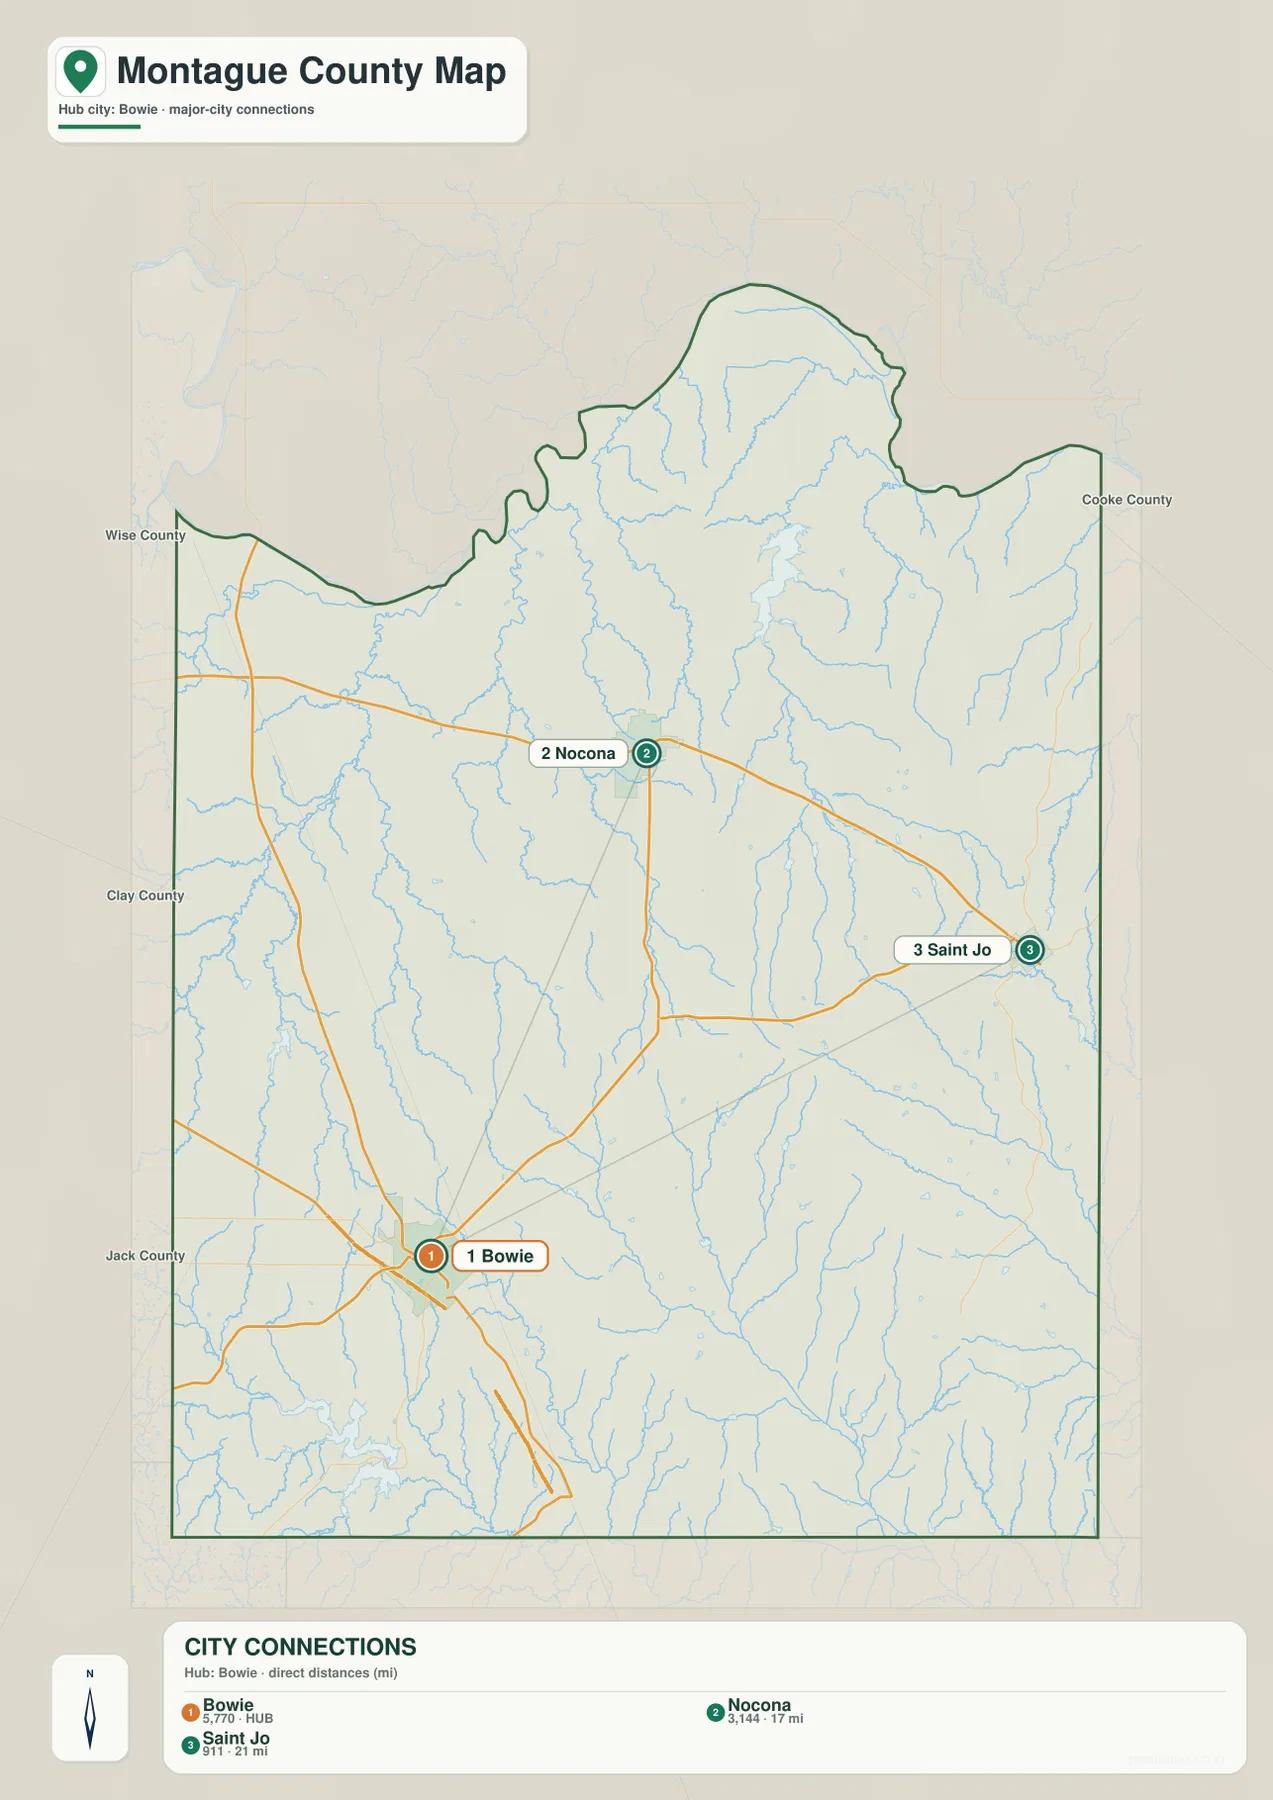
The city-connections map uses Bowie as the hub. The labels show about 17 miles from Bowie to Nocona and about 21 miles from Bowie to Saint Jo. These are straight-line distances between mapped points, not driving distances or travel-time estimates.
Nocona lies northeast of Bowie, while Saint Jo is farther east-northeast. The two connection lines pass through the broad central part of the county close to the Montague area. Removing most road and minor-place detail makes this three-city arrangement easy to understand before returning to the general map for the actual routes.
The lower index also prints Bowie 5,770, Nocona 3,144, and Saint Jo 911. The supplied image does not identify a year for these values, so this article treats them only as figures shown by the map rather than confirmed current population counts. The main value of the layer is the direction and straight-line spacing among the three cities.
Farmers Creek and Lake Nocona define the northeastern water landscape
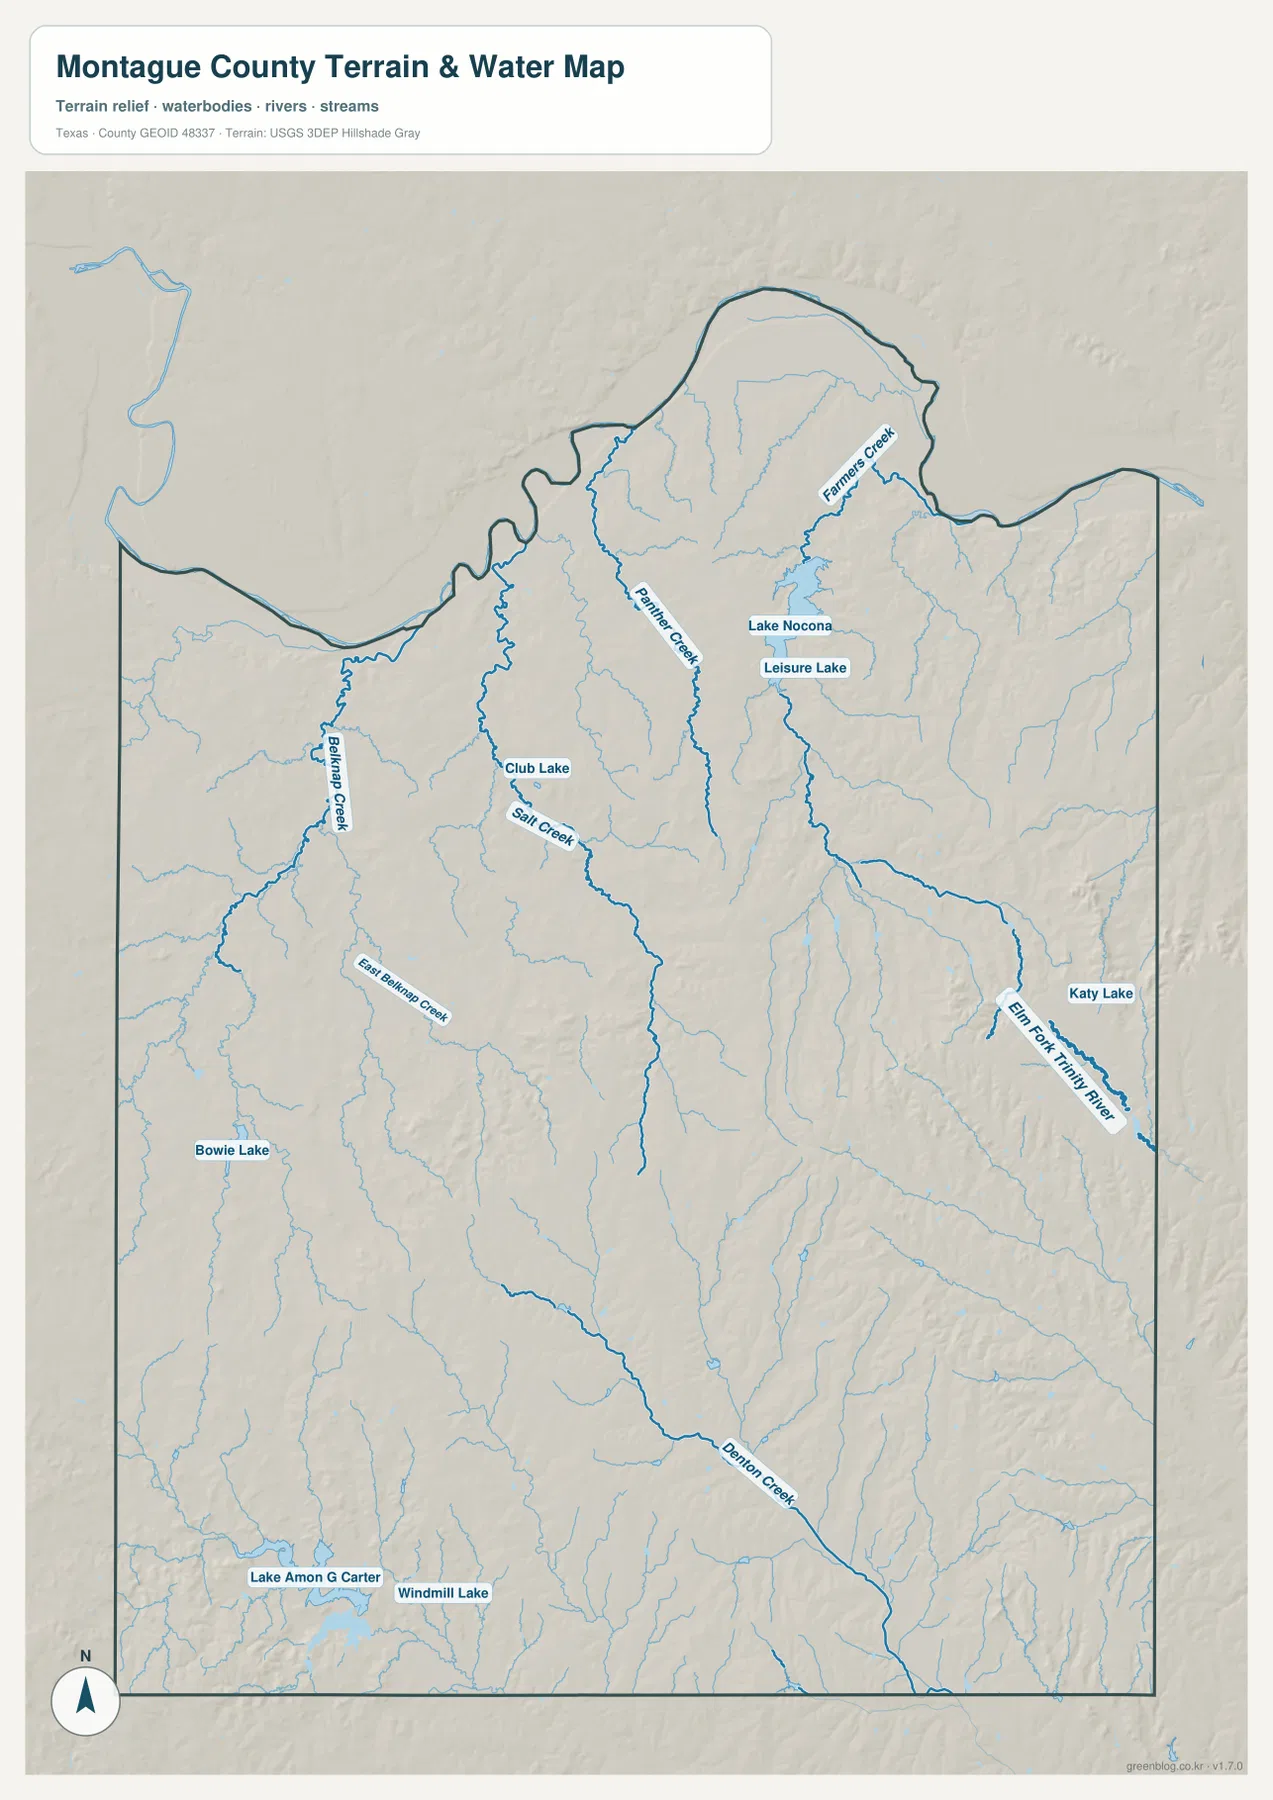
Farmers Creek is one of the clearest named waterways in the northeast. It descends through a hilly area above Lake Nocona, with Leisure Lake labeled nearby. This group sits close to the Nocona Hills side of the general map, making it a useful place to compare settlement, water, and relief on the same part of the county.
Panther Creek runs through the north-central interior, and Club Lake is labeled to its west. Belknap Creek forms a stronger western-central drainage line, while East Belknap Creek and Salt Creek provide additional references farther south and east. Numerous unnamed tributaries connect these larger labeled channels.
Denton Creek and Elm Fork Trinity River cut through the higher southern and eastern terrain
Denton Creek is a prominent south-central watercourse and continues toward the southeast. Elm Fork Trinity River is labeled farther east, where deeply incised tributaries cut through the hillier side of the county. These waterways explain why the eastern half looks much more textured on the elevation map than the lower northern areas.
Bowie Lake is labeled in the west, while Lake Amon G Carter and Windmill Lake sit near the southwestern boundary. Katy Lake appears on the eastern side. The supplied water map therefore shows a dispersed creek-and-small-lake network rather than one dominant river occupying the entire county.
The terrain-and-water map is intended for geographic reference. It can help locate Farmers Creek, Panther Creek, Belknap Creek, Denton Creek, Elm Fork Trinity River, and the named lakes relative to the county boundary, but it is not a flood-hazard map, legal water-boundary product, parcel map, or navigation chart.
Eastern and southeastern hills rise above lower northern valleys
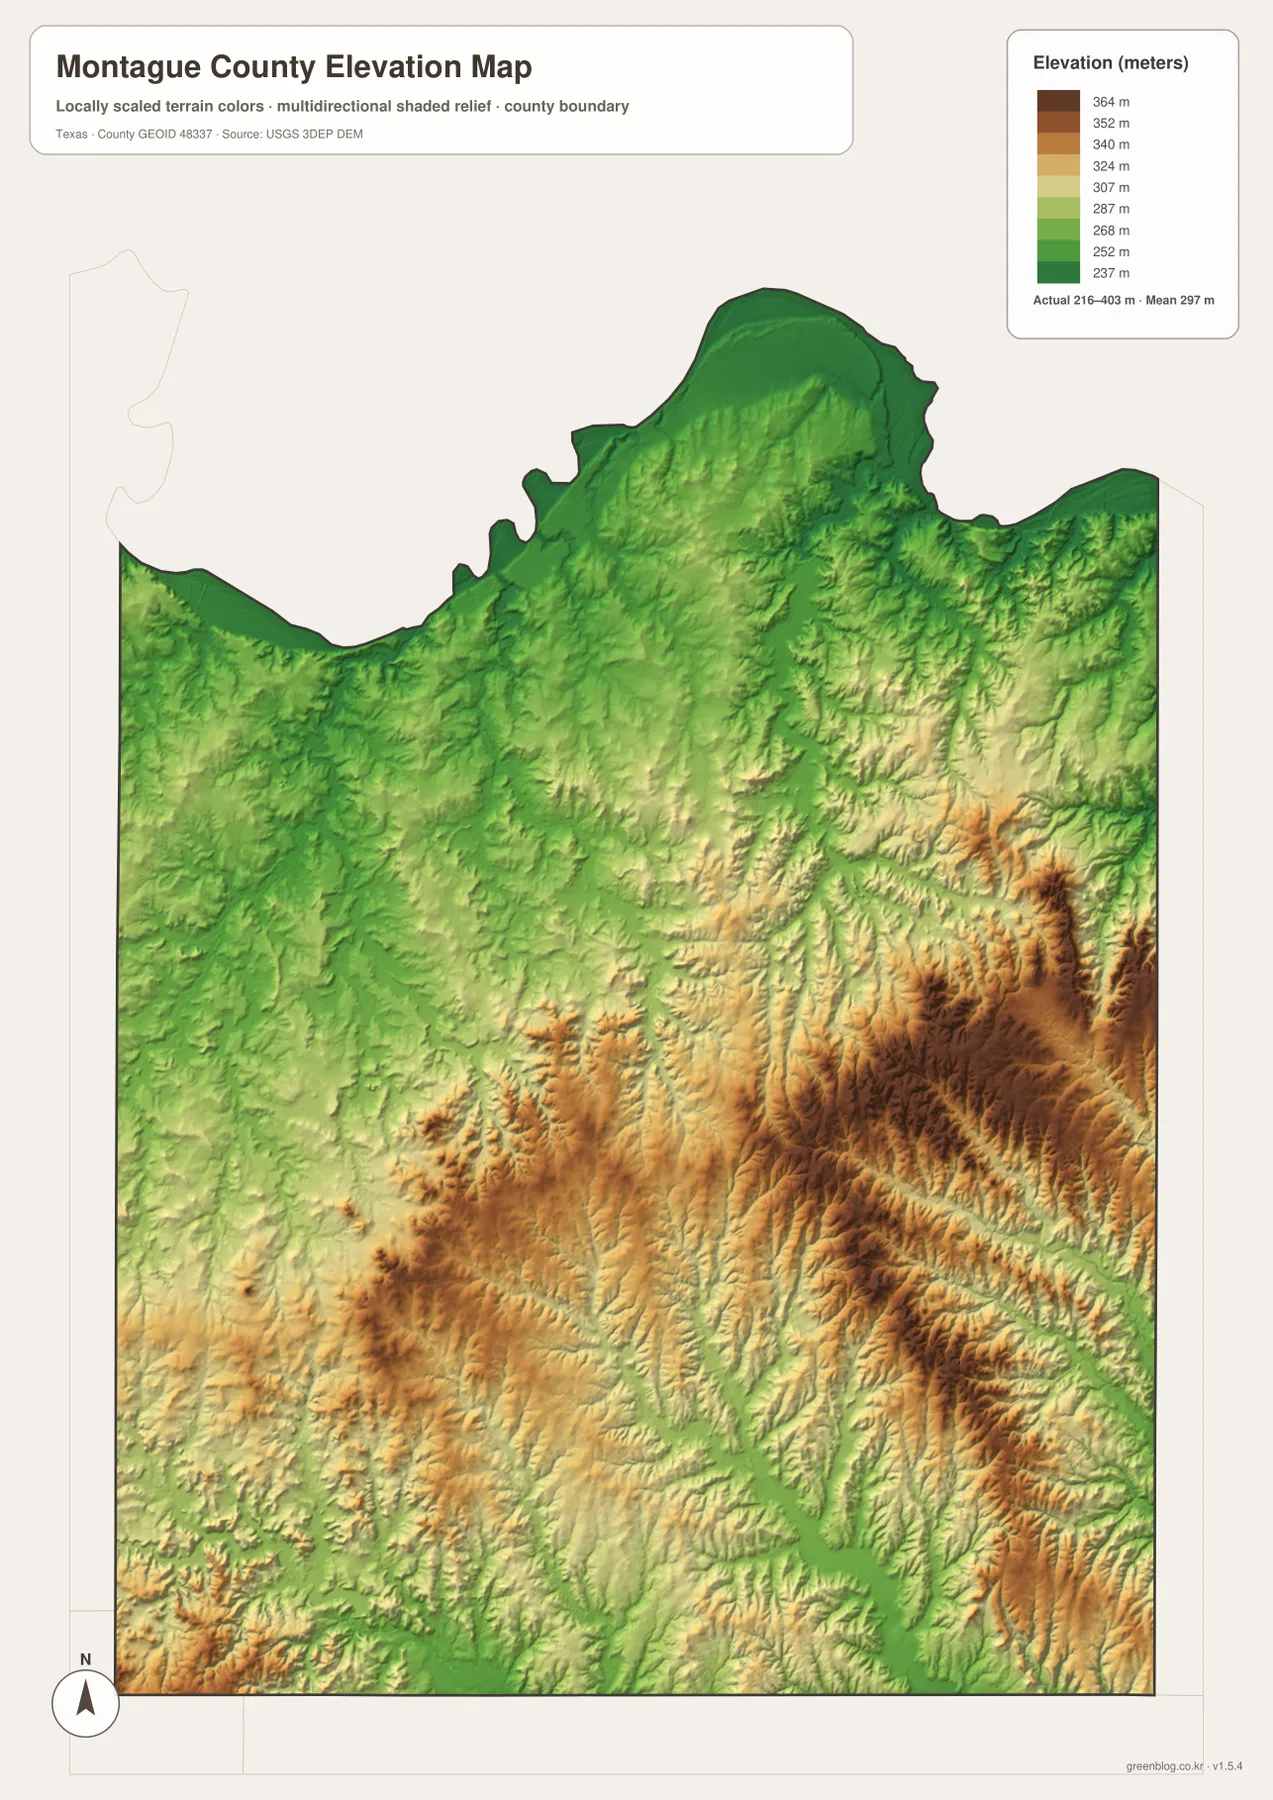
The elevation map reports an actual range of about 216 to 403 meters and a mean elevation of about 297 meters. The darkest browns are concentrated across the east-central and southeastern interior, with additional high ridges through the lower middle. Broad green terrain covers much of the northern edge and several major creek valleys.
The eastern uplands are deeply dissected rather than smooth. Denton Creek and the Elm Fork Trinity River system occupy lower green corridors between brown and tan ridges. Farmers Creek and Panther Creek lie in generally lower northern terrain, creating a clear contrast between the northeast water country and the higher southeast.
Some elevated ground also appears around the center and southwest, but the strongest continuous high relief is farther east. The difference between the displayed minimum and maximum elevation is about 187 meters. That range is enough for the creek-cut ridges to stand out clearly even though Montague County is not a mountain landscape.
The elevation layer is best used for relative terrain comparison rather than survey-grade or engineering-grade measurement. Its value here is to connect Bowie, Nocona, Saint Jo, the eastern uplands, and the lower creek valleys into one physical view of the county.
Moving east from Bowie reveals the county’s strongest terrain change
Start at Bowie on the general map and move east toward Montague and Saint Jo. The road layer gradually gives way to more visible stream lines, and the terrain-and-water map brings Denton Creek and the Elm Fork Trinity River system into focus. On the elevation map, the same eastern side changes to stronger brown ridges separated by green valleys.
The Nocona side looks different. Route 82 crosses a lower northern landscape where Lake Nocona, Farmers Creek, and Panther Creek provide the strongest water references. The elevation colors are generally greener than in the southeast. This map-based contrast is more specific than the older Red River basin wording, which is not the principal labeled water feature on the supplied terrain-and-water map.
Use the city-connections map when Bowie-to-Nocona or Bowie-to-Saint Jo spacing is the main question, the general map for roads and smaller settlements, the terrain-and-water layer for named creeks and lakes, and the elevation map for the east-versus-north relief contrast. Small labels are often easier to inspect in the downloadable high-resolution JPG files than in the browser previews.
Frequently Asked Questions
What direct distances are shown from Bowie?
The city-connections map shows about 17 miles from Bowie to Nocona and about 21 miles to Saint Jo. These are straight-line map distances, not driving distances.
Which water features are easiest to identify?
Farmers Creek and Lake Nocona provide strong northeastern references. Panther Creek and Belknap Creek cross the central area, while Denton Creek and Elm Fork Trinity River are prominent farther south and east. Bowie Lake, Lake Amon G Carter, and Katy Lake are also labeled.
What elevation range is shown for Montague County?
The supplied elevation map reports an actual range of about 216 to 403 meters and a mean elevation of about 297 meters. The east and southeast are generally higher, while the northern edge and several creek valleys occupy lower terrain.
Sources and Reference Data
- U.S. Census Bureau TIGER/Line Shapefiles — official county-boundary and road geometry for geographic reference.
- USGS National Hydrography — official resources for creeks, lakes, rivers, and other water features.
- USGS 3D Elevation Program — official elevation resources used for terrain information.
- USGS The National Map Viewer — an official viewer for comparing geographic layers.
Map File Information
Download four high-resolution A3 JPG maps of Montague County, Texas, in one ZIP file.
- Included Files: county map, city-connections map, terrain and water map, elevation map
- File Type: JPG
Related Maps
- Wise County Texas map
- Archer County Texas map
- Wichita County Texas map
- Palo Pinto County Texas map
- Parker County Texas map
Green Map creates custom-edited map images using open geographic data sources such as geoBoundaries, Natural Earth, OpenStreetMap, and government open data.
These maps are edited visual materials, not raw data files, and are provided for education, documents, presentations, and graphic reference.