Cameron County sits at the far southern end of Texas, where the Rio Grande border, the lower Rio Grande Valley, Laguna Madre, and the Gulf coast meet within one county. Brownsville, the county seat, anchors the southern urban area; San Benito and Harlingen continue northwest along the main highway corridor, while Port Isabel and South Padre Island point toward a very different coastal landscape. The maps on this page are designed to make those contrasts easy to see without turning the article into a technical GIS report. They show the county’s roads and places, the distribution of major cities, named waterways and coastal water, and the remarkably low relief of the coastal plain. A ZIP containing four high-resolution A3 JPG map files is available in the map file box below.
The most useful way to approach Cameron County is to compare its developed southwest and south-central corridor with the water-rich eastern side. Brownsville, San Benito, and Harlingen form the clearest chain of large communities, but the county does not simply fade into empty land east of them. Instead, the landscape opens into resacas, reservoirs, shallow bays, wet lowlands, Laguna Madre, and the barrier-island coast. Elevation changes are small in absolute terms, yet they matter because much of the county lies only a few meters above sea level. Looking at the road map first and then matching the same places on the water and elevation maps gives a much clearer picture of why settlement and transportation are concentrated where they are.
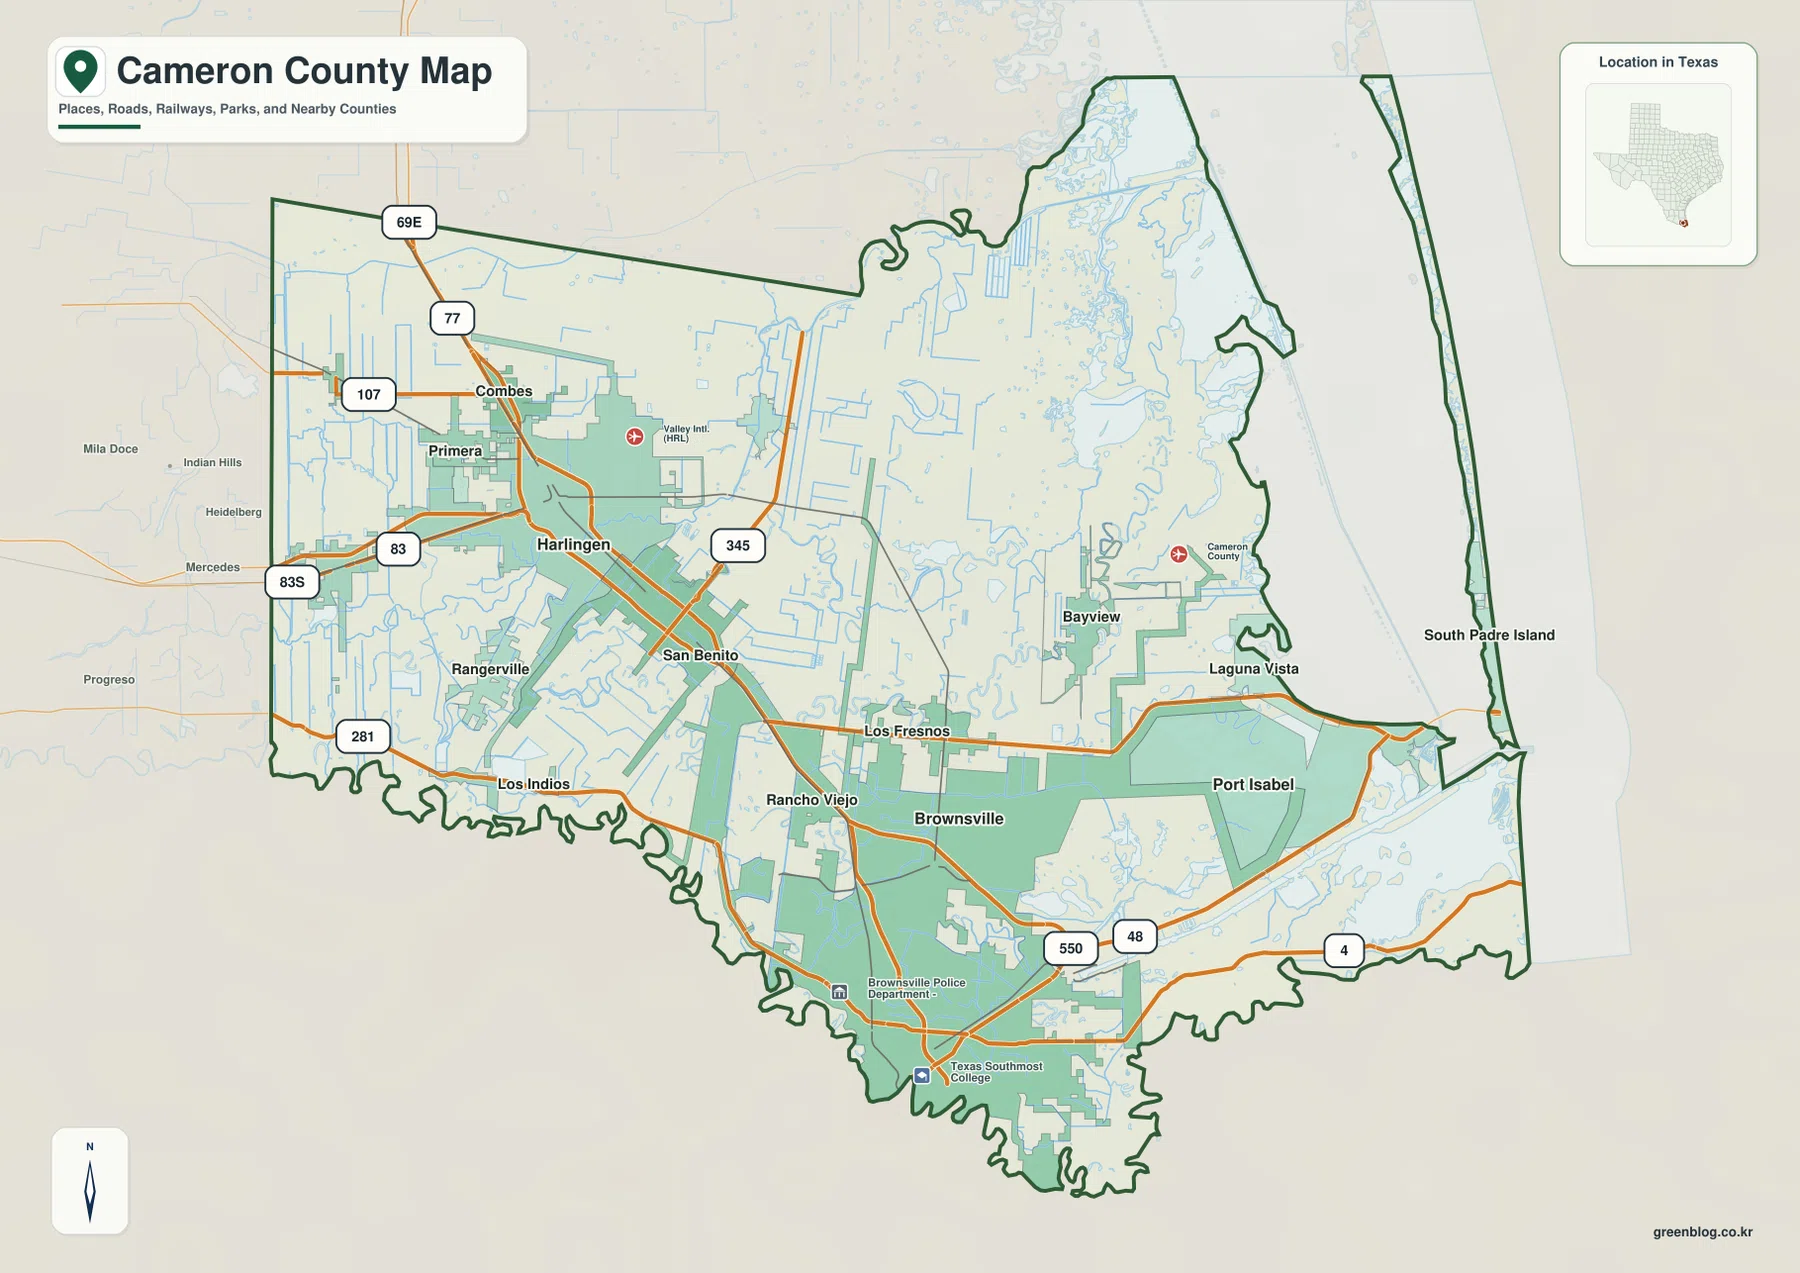
Table of Contents
From Brownsville to Harlingen along the county’s busiest inland corridor
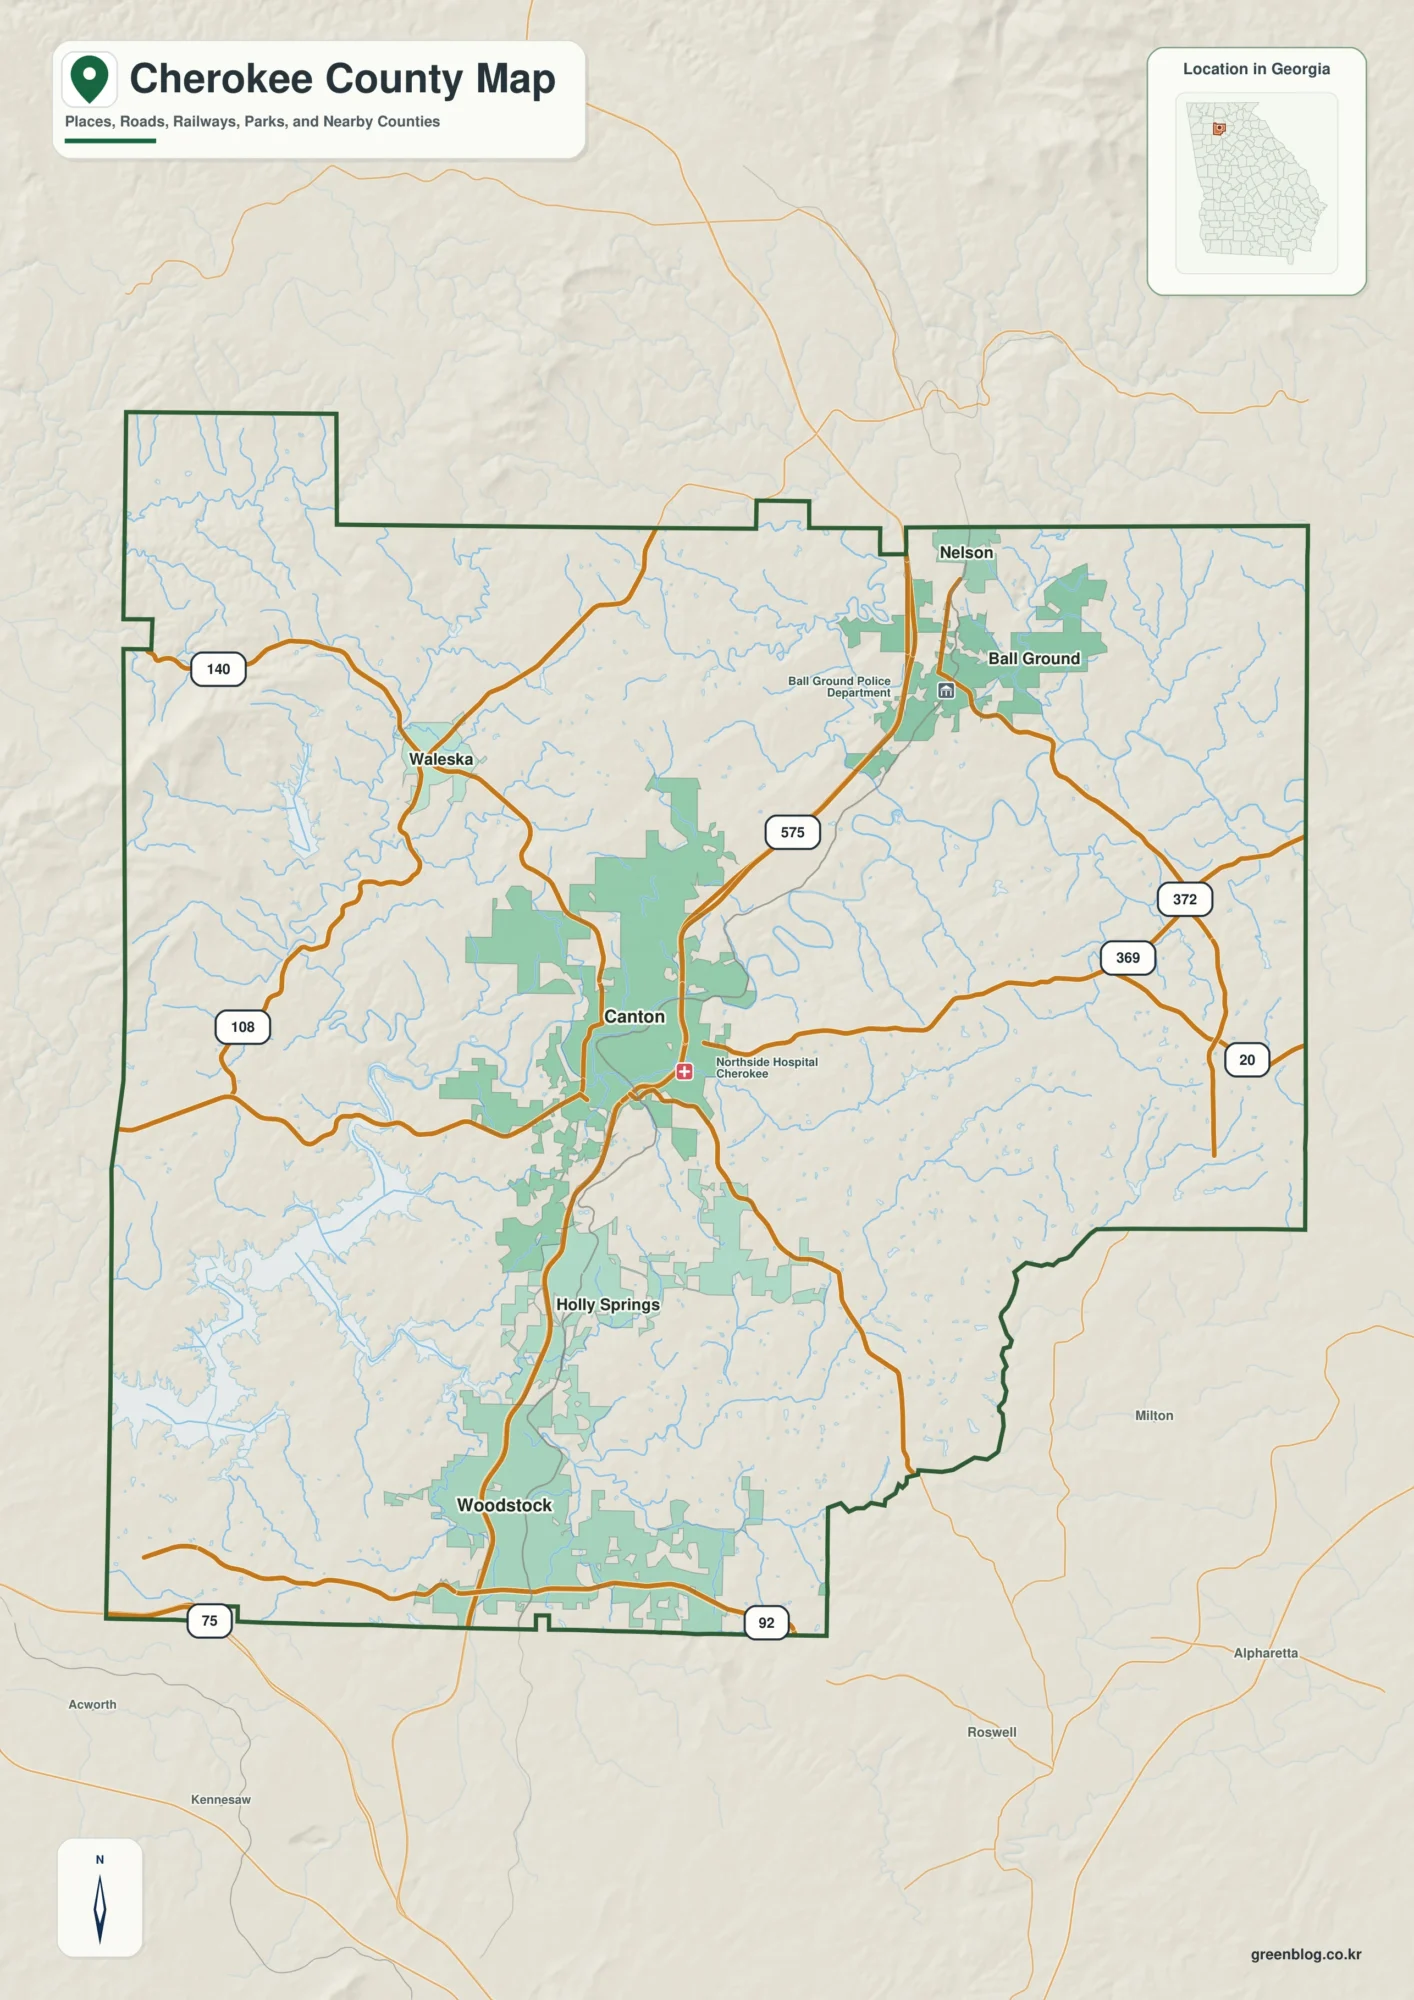
The general county map makes the Brownsville–San Benito–Harlingen relationship immediately visible. Brownsville occupies the southern part of the county close to the Rio Grande, San Benito lies northwest of it, and Harlingen sits farther north and west. I-69E and US 77 follow this same broad direction, creating the most obvious continuous transportation corridor on the map. North of Harlingen, the route continues toward Combes and the Willacy County line, while roads such as 107 and the US 83 corridor connect the western side of the county to the larger Lower Rio Grande Valley. This concentration of roads helps explain why the western and southern parts of Cameron County appear more heavily settled than the broad coastal lowlands to the east.
Brownsville also works as a junction for routes that do not follow the Harlingen corridor. State Highway 48 heads east toward Port Isabel and the Laguna Madre side of the county, while roads labeled 550 and 4 on the map serve the southeastern side and the approach toward coastal and port areas. US 281 runs near the southwestern part of the county and the Rio Grande border, reaching Los Indios and continuing toward the Hidalgo County side. Because these routes point in different directions, Brownsville is more than the southern endpoint of the urban chain. It is a practical reference point for travel toward inland Valley cities, the international border, the port area, and the coast.
The county map also shows smaller communities that help fill in the gaps between the largest cities. Los Fresnos sits east of San Benito on the route toward the coast. Primera and Combes lie near the Harlingen area, while Bayview and Laguna Vista mark the transition from the more developed inland corridor to the Laguna Madre side. Port Isabel appears near the western edge of Laguna Madre, and South Padre Island forms a narrow strip along the outer coast. Reading these labels together gives Cameron County a much more specific shape than a simple “Brownsville border county” description.
What the six-city map says about where population is concentrated
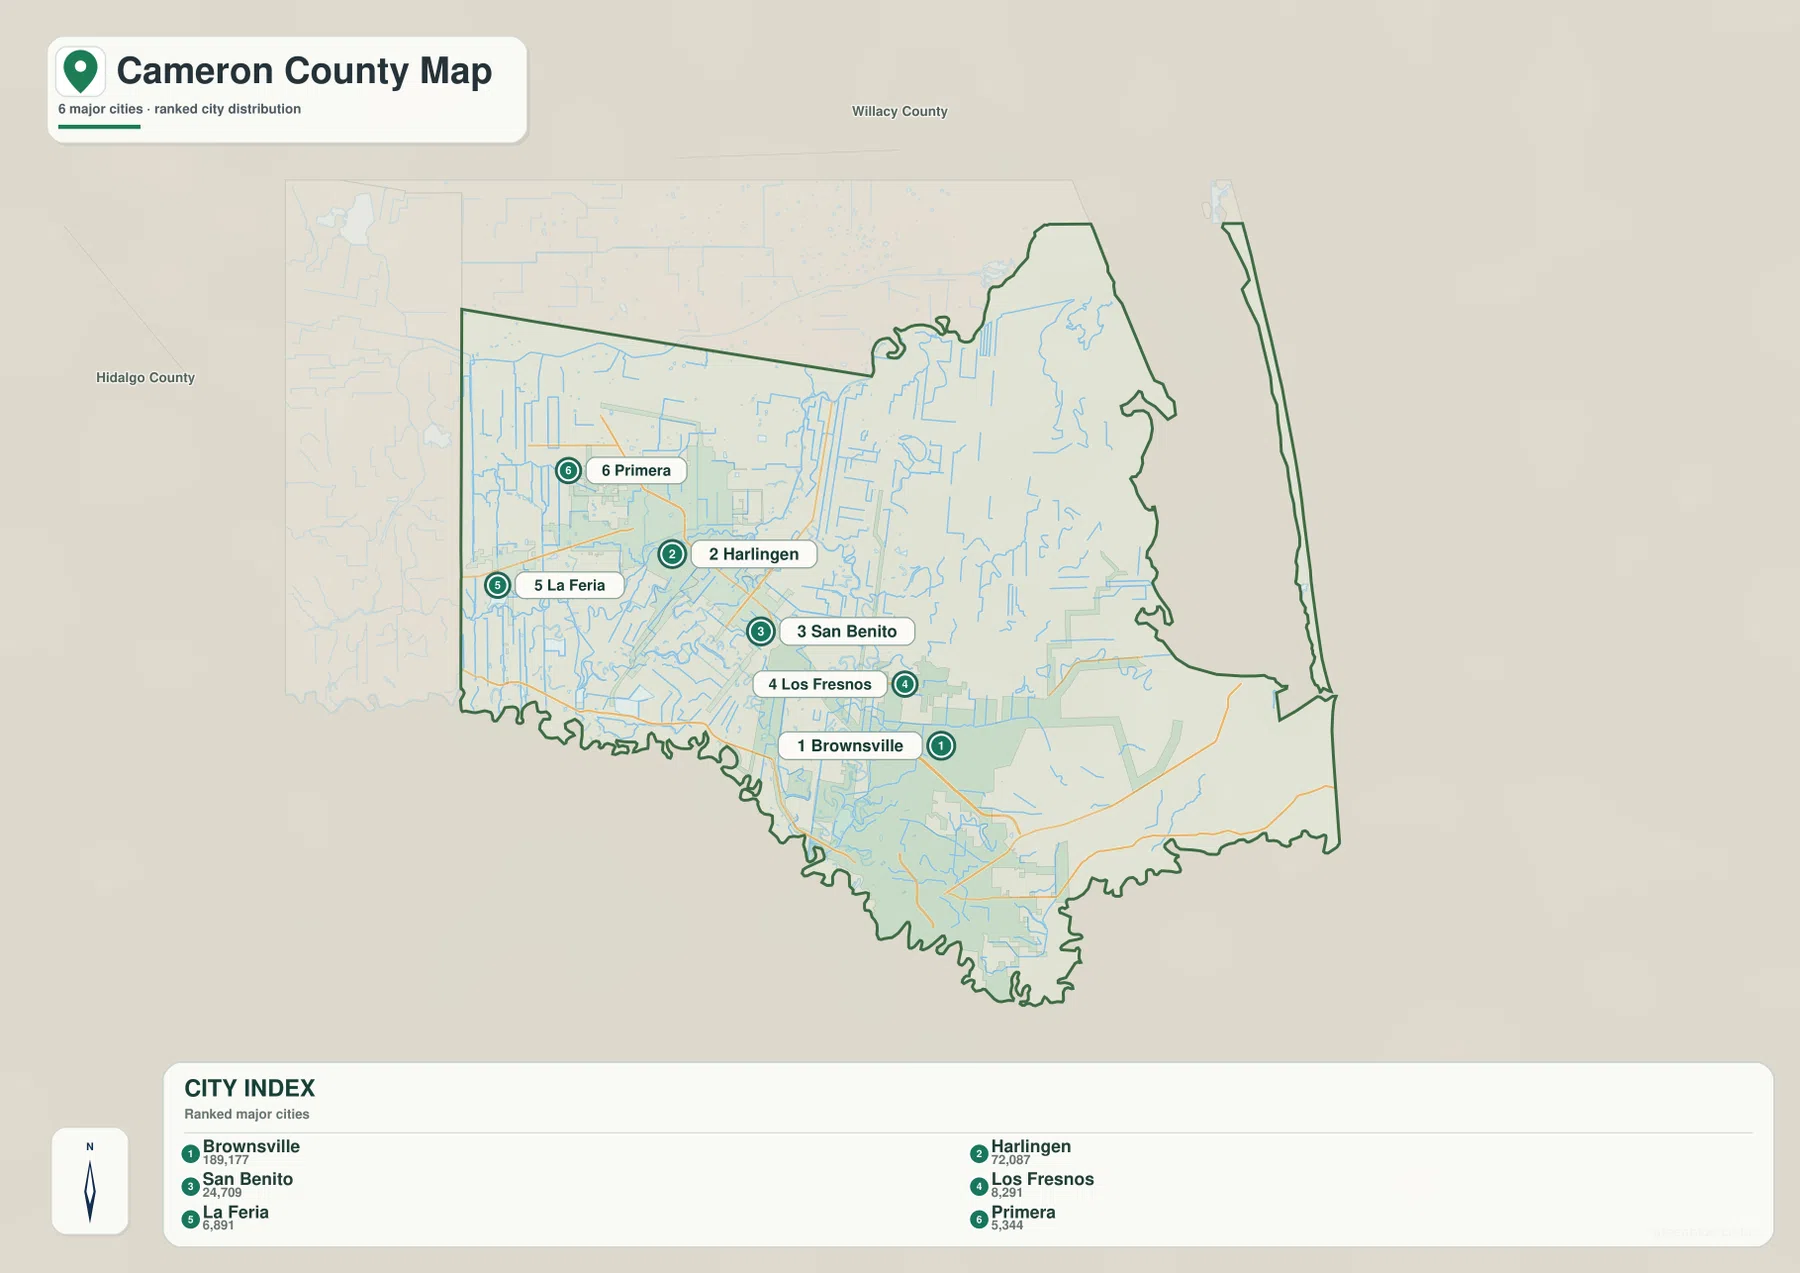
The city-distribution map ranks six major municipalities and makes their spacing easy to compare. Brownsville is labeled at 189,177 residents and Harlingen at 72,087, clearly separating the two largest urban centers from the rest of the list. San Benito is shown at 24,709. Los Fresnos, La Feria, and Primera are smaller, with map labels of 8,291, 6,891, and 5,344 respectively. The numbers are useful, but the geography matters just as much: Brownsville sits in the southeast of the developed inland area, Harlingen and Primera are farther northwest, San Benito falls between them, La Feria is close to the western county edge, and Los Fresnos lies east of the main Brownsville–Harlingen line.
This arrangement shows that Cameron County’s largest population centers are not spread evenly along the Gulf coast. Most of the ranked cities sit inland, close to major roads and the western half of the county. Port Isabel and South Padre Island remain important coastal reference points on the general map, but they are not part of this six-city ranking. That distinction is useful when choosing a map. If the question is where most residents and urban services are concentrated, the city map is the cleaner choice. If the question is how people reach the beach, Laguna Madre, or the barrier island, the broader county map provides the necessary roads and coastal context.
Laguna Madre, resacas, reservoirs, and a water network unlike an inland county
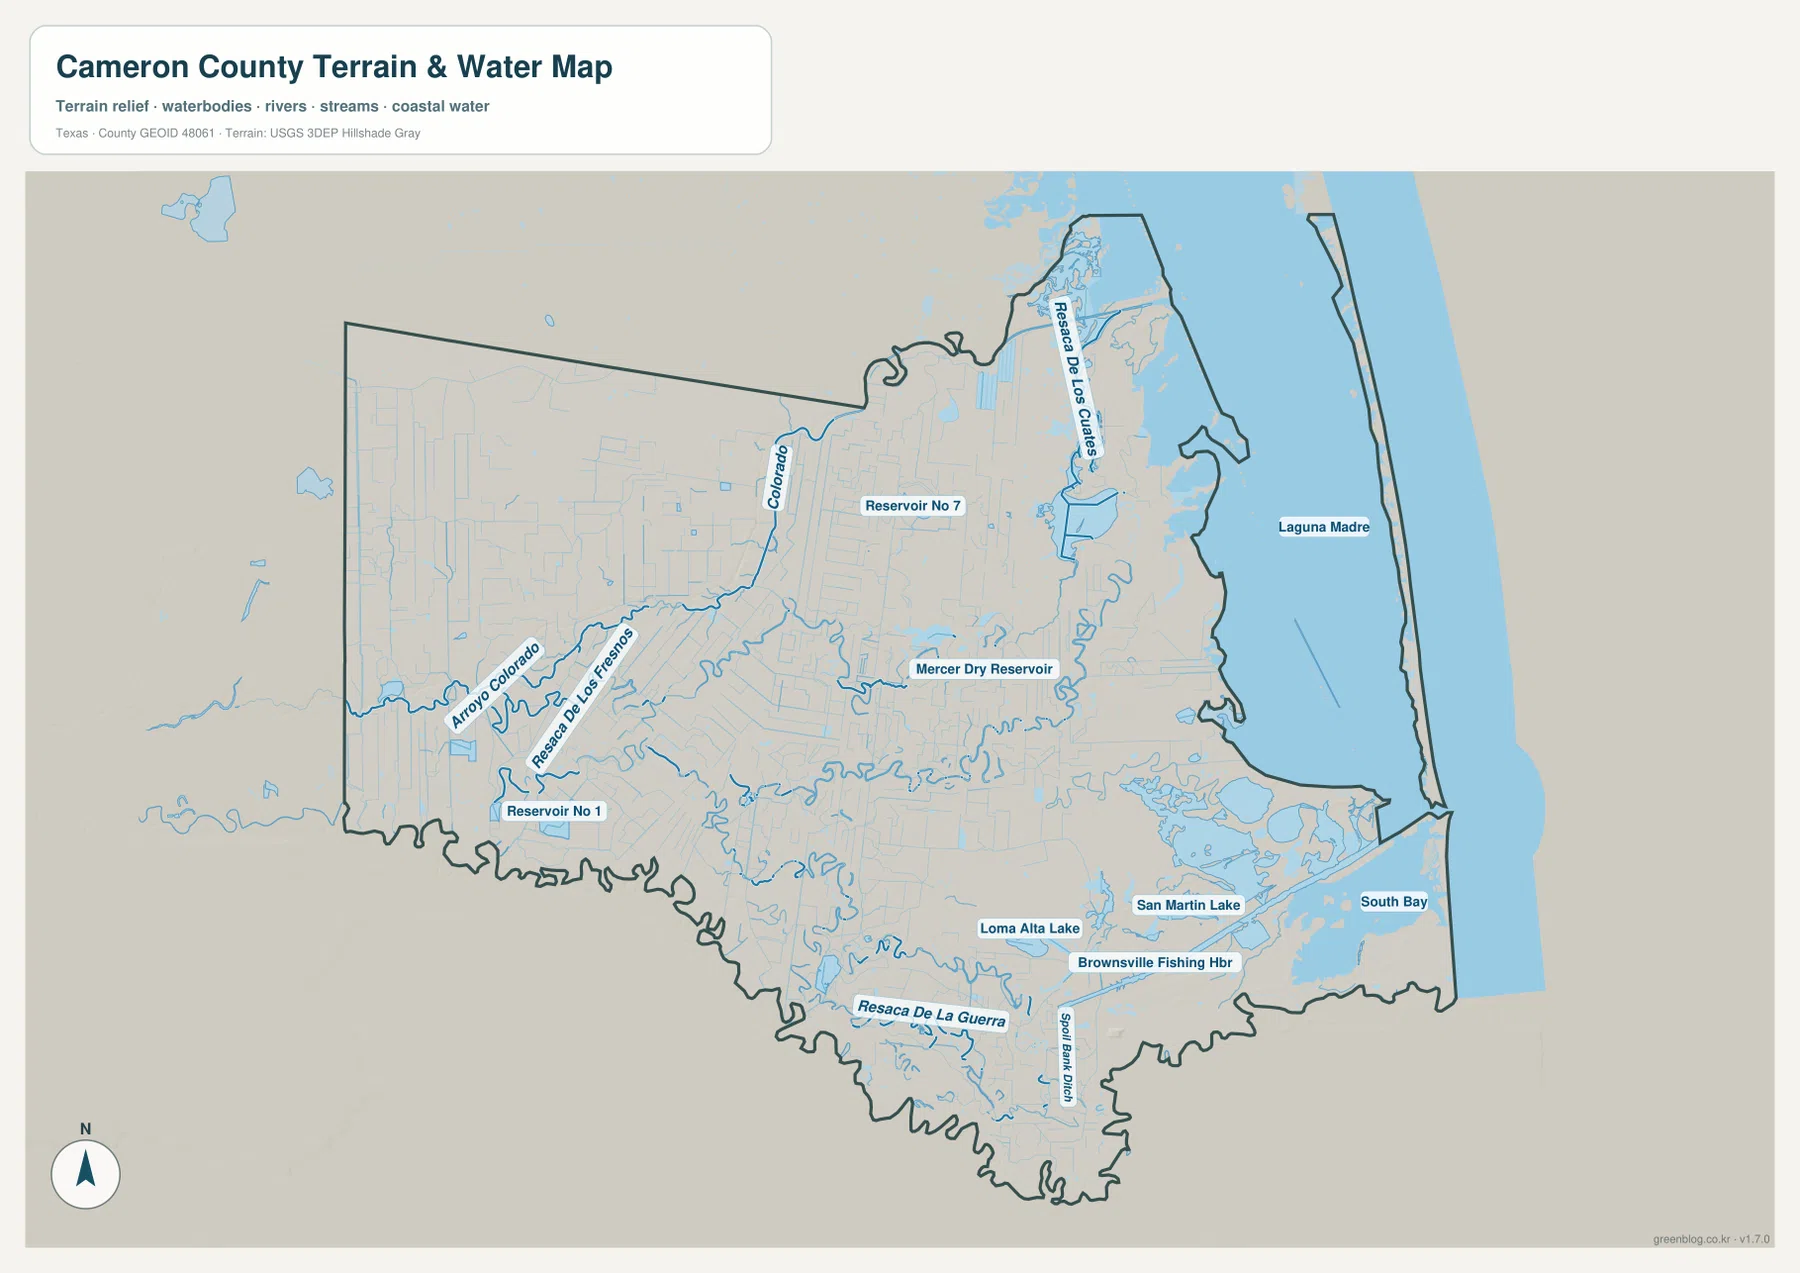
The water map is where Cameron County becomes most distinctive. Laguna Madre occupies a broad band along the eastern side, separated from the Gulf by the narrow barrier island. South Bay appears in the southeastern corner, and the Brownsville area includes San Martin Lake, Loma Alta Lake, and Brownsville Fishing Harbor. Moving inland, the map shows a web of winding channels and named water features rather than one dominant river crossing the middle of the county. Resacas are especially important here. The term is commonly used in the Lower Rio Grande Valley for old river channels or low, winding waterways associated with the Rio Grande’s historical course, and their shapes are easy to recognize on the map.
Arroyo Colorado is one of the most prominent inland watercourses, running across the western and central part of the county before continuing toward the coastal side. Resaca de los Fresnos and Resaca de los Cuates appear as long, irregular channels, while Reservoir No 1, Reservoir No 7, and Mercer Dry Reservoir add another set of named water features. Near Brownsville, Resaca de la Guerra follows a winding course through the low southern landscape. The Rio Grande itself defines the international boundary along the southern edge of Cameron County, even though the water map emphasizes the county’s internal hydrography and coastal waters. Together, these features show why a road-only map misses an essential part of the county’s geography.
The relationship between water and settlement is also visible when the maps are compared. Harlingen and San Benito sit close to the Arroyo Colorado system, while Los Fresnos occupies a position between the inland city corridor and the Laguna Madre lowlands. Brownsville is close to the Rio Grande but also has direct road access toward the port and Laguna Madre. Farther northeast, the map becomes increasingly dominated by shallow water, channels, and wet lowlands rather than closely spaced city labels. That change is not a small cartographic detail; it is one of the main reasons the eastern half of Cameron County feels geographically different from the developed Lower Valley corridor.
A county measured in meters: roughly -1 to 34 m of elevation
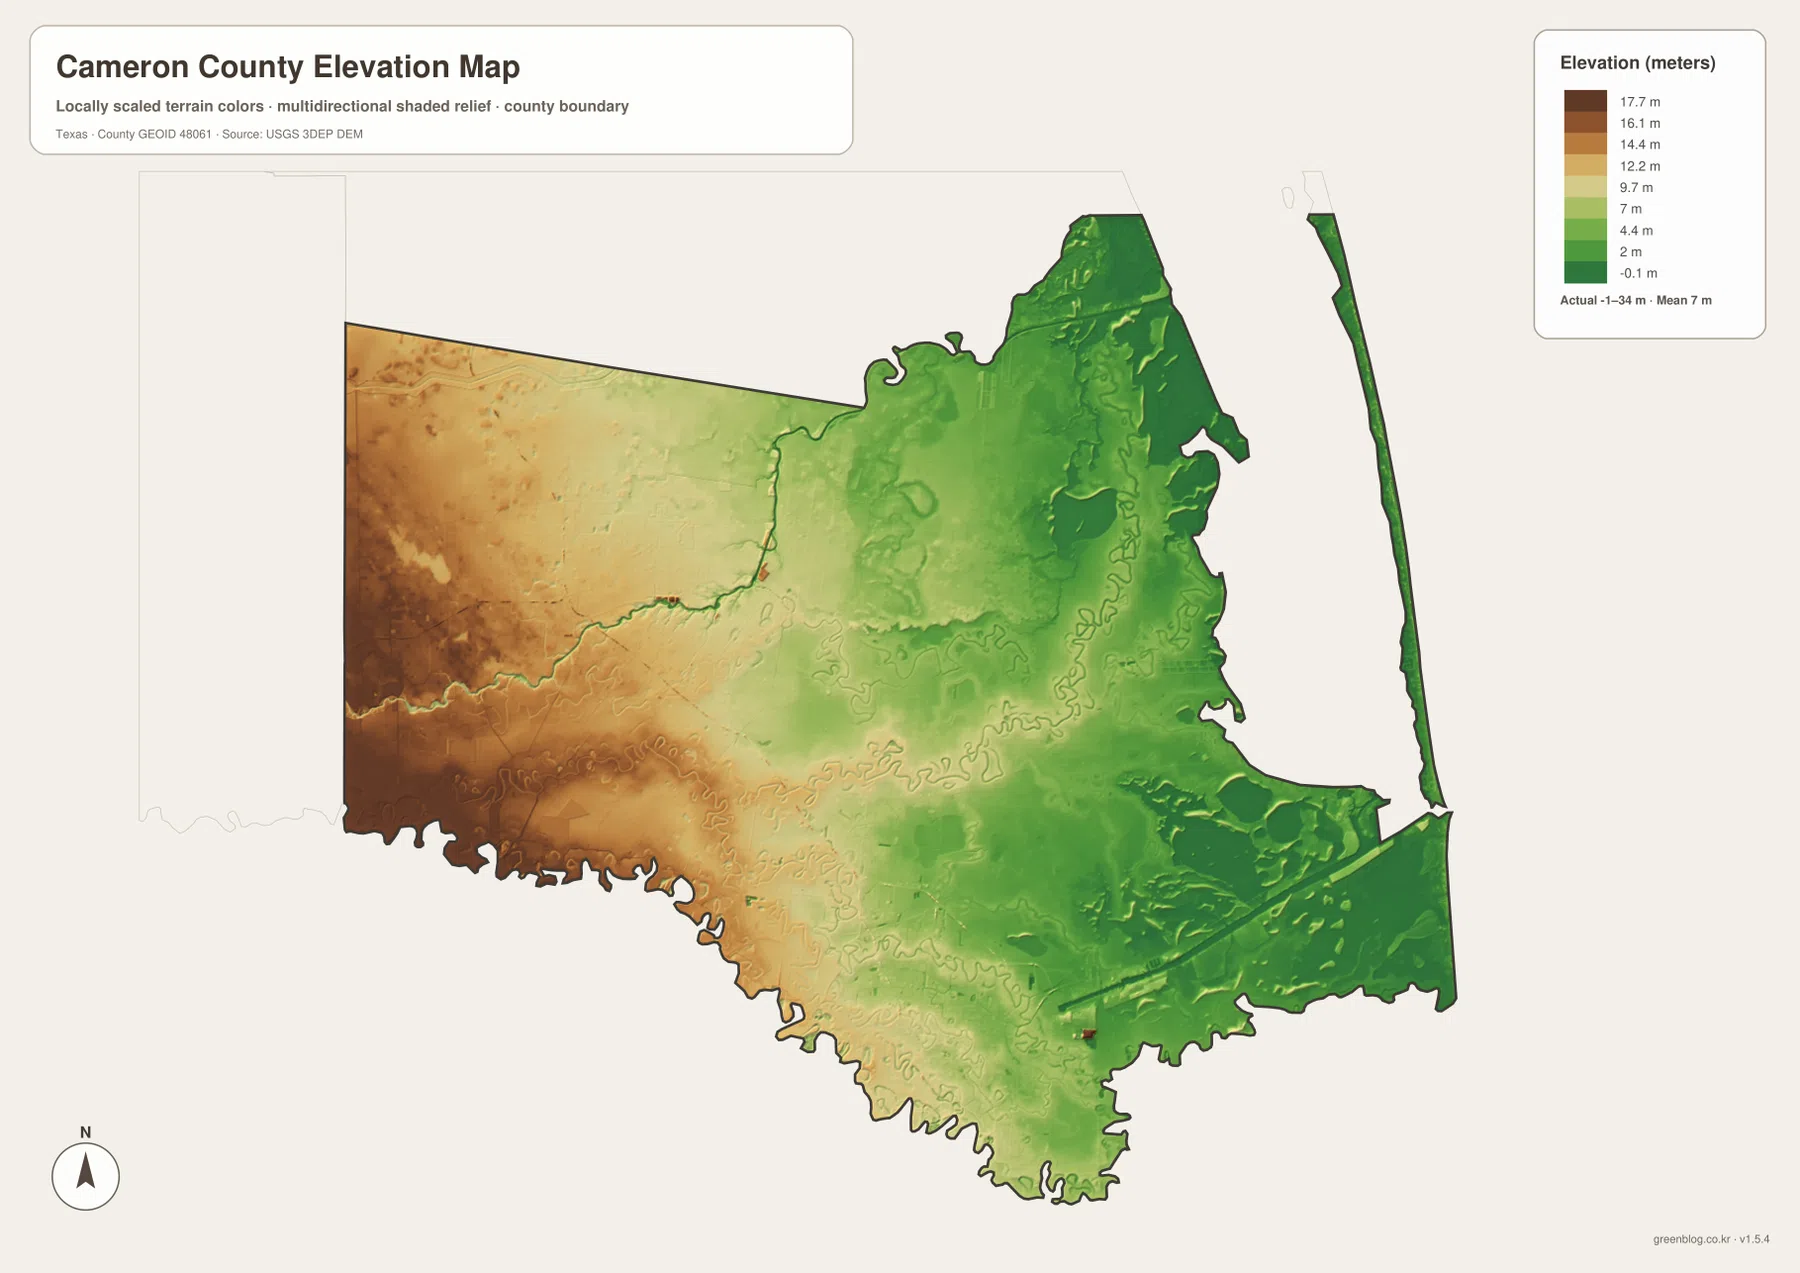
The elevation map lists an actual range of about -1 to 34 meters and a mean elevation of about 7 meters. Those figures immediately set Cameron County apart from hill-country or mountain counties, but the map still shows meaningful local differences. The western and southwestern interior contains more tan and brown shading, indicating relatively higher ground within the county. Moving eastward, green becomes increasingly dominant. The Laguna Madre side, the northeastern wetlands, and much of the coastal edge sit at very low elevations, visually matching the concentration of water features on the hydrography map.
Because the overall relief is so small, it is better to read this map as a guide to low coastal terrain than as a search for dramatic hills. A difference of ten or twenty meters can be significant in a landscape where the average is only about seven meters. The western interior has broader areas of slightly higher ground, while the eastern side contains long low zones influenced by lagoons, wetlands, and coastal processes. Brownsville itself remains low, but the colors around the city and along the Rio Grande vary enough to show subtle changes in height across the southern border area.
Cameron County’s own government materials describe the county as the southernmost county in Texas, bordered by Mexico to the south and the Gulf of Mexico to the east, with elevations extending from sea level to only a few dozen feet over much of the area. The elevation map presented here adds more visual detail to that broad description. It is especially useful beside the water map: low green areas in the east correspond closely with the part of the county where lagoons, shallow bays, old channels, and wetland complexes become most extensive.
Four very different edges: Hidalgo, Willacy, Mexico, and the Gulf
Cameron County’s boundaries do not all function in the same way. Hidalgo County lies to the west and Willacy County to the north, so roads can continue across those county lines in the familiar way of an inland Texas map. The southern edge is different because the Rio Grande forms the international boundary with Tamaulipas, Mexico. Brownsville faces Matamoros across the river, making the southern side both a physical water boundary and an international border. To the east, the county opens toward Laguna Madre and the Gulf rather than another mainland county, creating a fourth kind of edge.
The long, narrow shape of South Padre Island makes that eastern geography even more unusual. Port Isabel sits on the mainland side of Laguna Madre and acts as the obvious map reference for travel toward the barrier island. A place can look geographically close across the water while practical travel depends on a limited number of bridge and road connections. That is very different from the Brownsville–San Benito–Harlingen corridor, where multiple roads and continuous development make the county feel more connected. Comparing those two areas prevents the map from being read as if distance alone determined accessibility.
Why the Laguna Atascosa area looks so open on the map
The northeastern side of Cameron County contains far fewer major city labels and a much larger share of water and open lowland. Laguna Atascosa National Wildlife Refuge helps explain part of that pattern. The U.S. Fish and Wildlife Service says the refuge was established in 1946 to protect habitat for wintering waterfowl and other migratory birds, and its mission now also includes endangered species and shorebird conservation. The refuge encompasses a large coastal landscape where wetlands, brushlands, lakes, and Laguna Madre habitats occupy far more space than dense urban development.
The refuge’s Bahia Grande unit is particularly relevant to the county maps because it lies between Laguna Vista and Brownsville. Fish and Wildlife Service information describes much of the unit as wetlands surrounding the large Bahia Grande basin. On the water map, the same broad part of southeastern and eastern Cameron County is filled with shallow water features and low terrain. The elevation map reinforces the point with extensive green shading. These official landscape descriptions should not be treated as a substitute for a detailed refuge map, but they provide useful context for why the county’s eastern half has a very different visual character from the Brownsville–Harlingen urban corridor.
Choosing the map that matches the question
For a quick overview of roads, communities, county boundaries, and the route toward South Padre Island, start with the general county map. It is the best single sheet for locating Brownsville, San Benito, Harlingen, Los Fresnos, Port Isabel, and nearby roads at the same time. The city map is better when the goal is specifically to compare the locations and relative sizes of the six ranked municipalities. Its simplified presentation removes much of the road detail and makes the Brownsville–Harlingen population concentration easier to see.
For rivers, resacas, reservoirs, bays, and lagoon water, use the water map. It contains names that are either small or absent on the general map, including Arroyo Colorado, Resaca de los Fresnos, Resaca de los Cuates, South Bay, and several reservoirs and lakes. The elevation map answers a different question: not where a waterway is named, but how low or relatively high the surrounding ground is. Its -1 to 34 meter range makes it especially useful for understanding why the eastern coastal landscape contains so many low, wet areas.
Several useful comparisons require more than one map. A trip from Brownsville toward South Padre Island can be traced on the county map, then placed beside Laguna Madre and South Bay on the water map, and finally compared with the near-sea-level colors on the elevation map. A study of the inland urban corridor can begin with I-69E and US 77, continue with the city ranking map, and then use Arroyo Colorado as a natural reference on the water map. The four files are most useful when they divide these questions rather than repeating the same information.
The downloadable JPG files are larger than the web previews and are suitable when small labels need to be enlarged for printing, classroom work, or personal reference. The elevation sheet is best viewed in color because the height differences are encoded by a color scale. These maps are not real-time navigation, flood-warning, marine-chart, or property-boundary products, so current road closures, refuge access, weather, and coastal conditions should be checked with the appropriate agencies before travel or field use.
Frequently Asked Questions
How are Brownsville, San Benito, and Harlingen arranged on the map?
They form the county’s clearest large-city corridor. Brownsville is in the south, San Benito lies northwest of Brownsville, and Harlingen is farther north and west. I-69E and US 77 follow the same general direction, which makes the three-city relationship easy to trace on the general map.
Which map is best for finding Laguna Madre and the resacas?
The water map is the most detailed choice. It labels Laguna Madre, South Bay, Arroyo Colorado, Resaca de los Fresnos, Resaca de los Cuates, lakes, and reservoirs, so it is much easier to compare coastal water with the winding inland channels.
How low is Cameron County according to the elevation map?
The supplied elevation map reports an actual range of roughly -1 to 34 meters and a mean near 7 meters. The western interior is relatively higher, while much of the Laguna Madre and Gulf-side landscape is very low, which matches the extensive water and wetland features shown on the water map.
Map File Information
The ZIP contains four high-resolution A3 JPG files for Cameron County: a county map, city map, water map, and elevation map. Use the original JPG files when you need a larger image than the web preview for printing or close label inspection.
- File Type: ZIP containing 4 JPG files
Related Maps
- Willacy County Texas map
- Starr County
- Webb County Texas map
- Zapata County Texas map
- San Patricio County Texas map
Sources and references
- Cameron County, Texas: official county information and local government context.
- U.S. Fish & Wildlife Service – Laguna Atascosa National Wildlife Refuge: official information about the northeastern coastal refuge, wetlands, and wildlife habitat.
- U.S. Census Bureau TIGER/Line Shapefiles: official boundary, road, and geographic reference data.
- USGS National Hydrography: official hydrography reference for waterways and water features.
- USGS 3D Elevation Program: official elevation and terrain reference.
Green Map creates custom-edited map images using open geographic data sources such as geoBoundaries, Natural Earth, OpenStreetMap, and government open data.
These maps are edited visual materials, not raw data files, and are provided for education, documents, presentations, and graphic reference.