A Soriano map provides a clearer way to understand how the main communities and municipal areas are distributed across this department in southwestern Uruguay. Mercedes, the departmental capital, is located in the northwest, while Dolores, Palmitas, José Enrique Rodó, and Cardona appear in separate parts of the region. Because these centers are not grouped into one compact urban area, their positions can be difficult to understand from a simple list of place names.
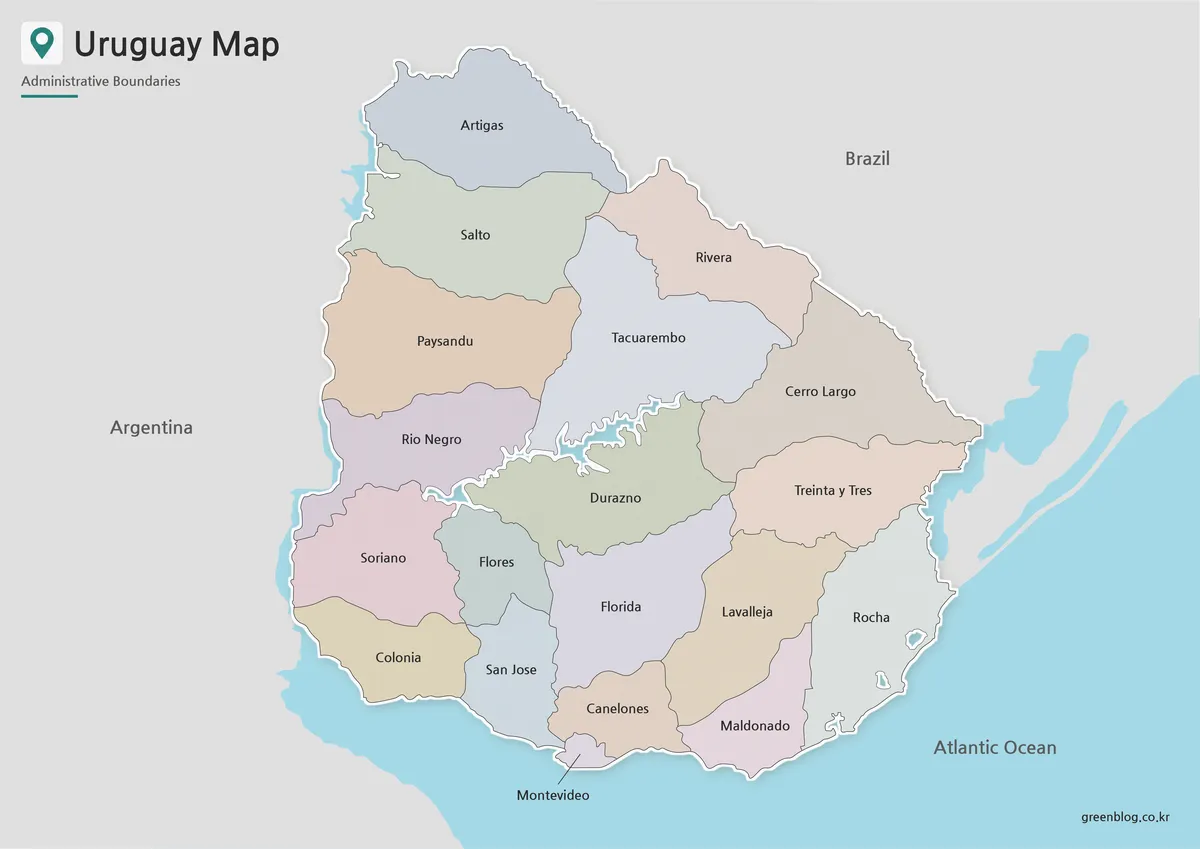
Soriano covers a broad landscape shaped by inland agricultural areas and communities connected with the Uruguay River region. Río Negro Department lies to the north, Flores Department to the east, and Colonia Department to the south. The western side faces the Uruguay River and Argentina beyond it. This setting gives the department a layout that is better understood visually, especially when comparing the northwest administrative center with the western, central, and southeastern municipalities.
The downloadable Soriano map collection includes color, outline, and black and white versions in an A3 layout. Each file serves a different purpose. The color design supports quick regional comparison, the blank boundary version works as a base for annotations, and the labeled monochrome design fits printed reports and educational handouts. Together, they provide practical options for teachers, students, bloggers, infographic creators, and anyone preparing a regional presentation.
Table of Contents
What the Soriano Map Shows
Mercedes is marked with a point in the northwestern part of the department rather than shown as one of the four colored municipal areas. This makes it possible to distinguish the departmental capital from the municipalities highlighted elsewhere on the page.
Dolores occupies a relatively broad area in the west. Palmitas appears farther inland near the north-central section, while José Enrique Rodó is positioned toward the central and southeastern part of the department. Cardona stands at the southeastern edge and is visibly separated from the other highlighted municipalities.
This arrangement reveals a distributed regional structure rather than a single continuous metropolitan area. Mercedes serves as the main administrative reference point, while the other communities form separate local centers across a wide rural department.
Color-Coded Municipal Layout
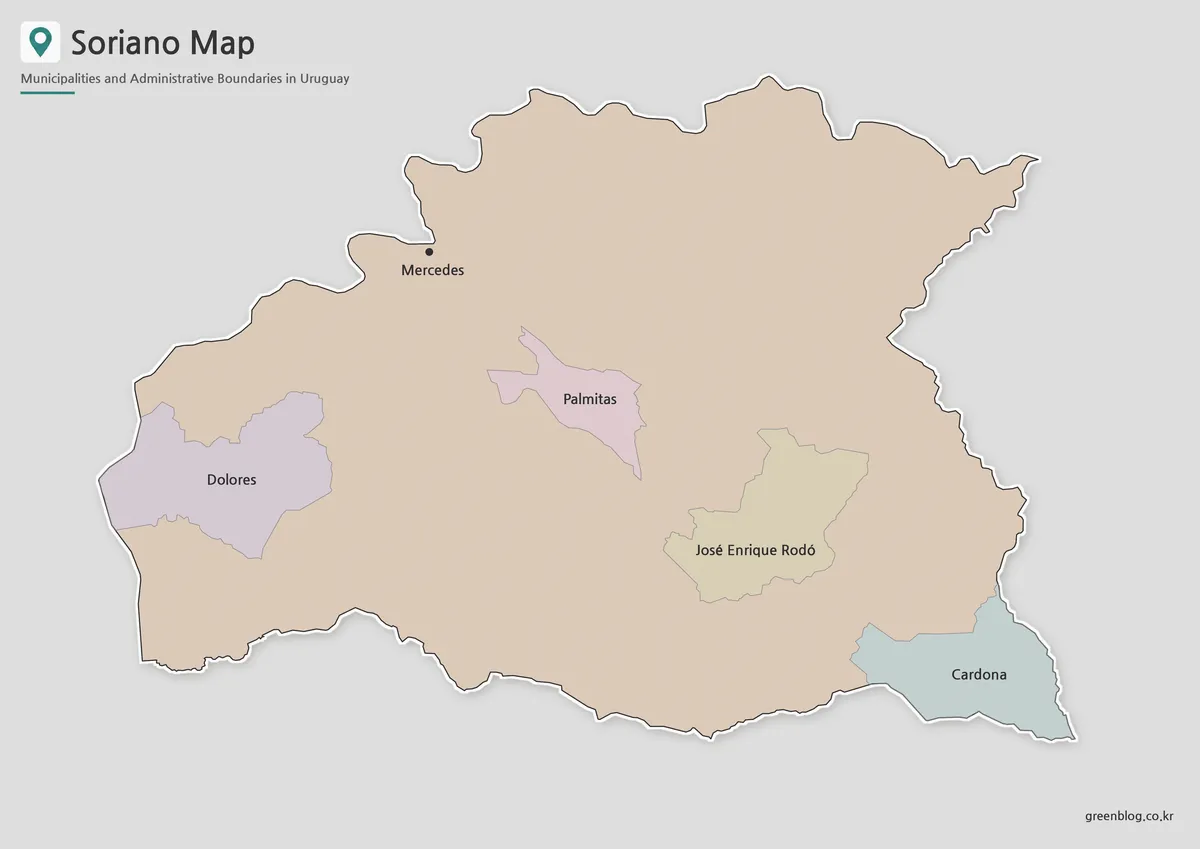
The color Soriano map uses light contrasting shades to separate Dolores, Palmitas, José Enrique Rodó, and Cardona from the neutral background of the department. This approach is especially helpful because the four highlighted areas are spread across different parts of the map rather than joined together in one cluster.
Dolores can be identified quickly in the west, while the longer shape of Palmitas stands out near the center. José Enrique Rodó extends toward the southeast, and Cardona forms a distinct section along the lower-right boundary. Mercedes remains visible as a separate city marker in the northwest.
For presentation slides, the color differences make it easier to explain the distance between local centers without filling the page with additional text. The design also works well as a blog graphic or as a visual reference in a regional comparison project.
Blank Outline Version for Custom Marking
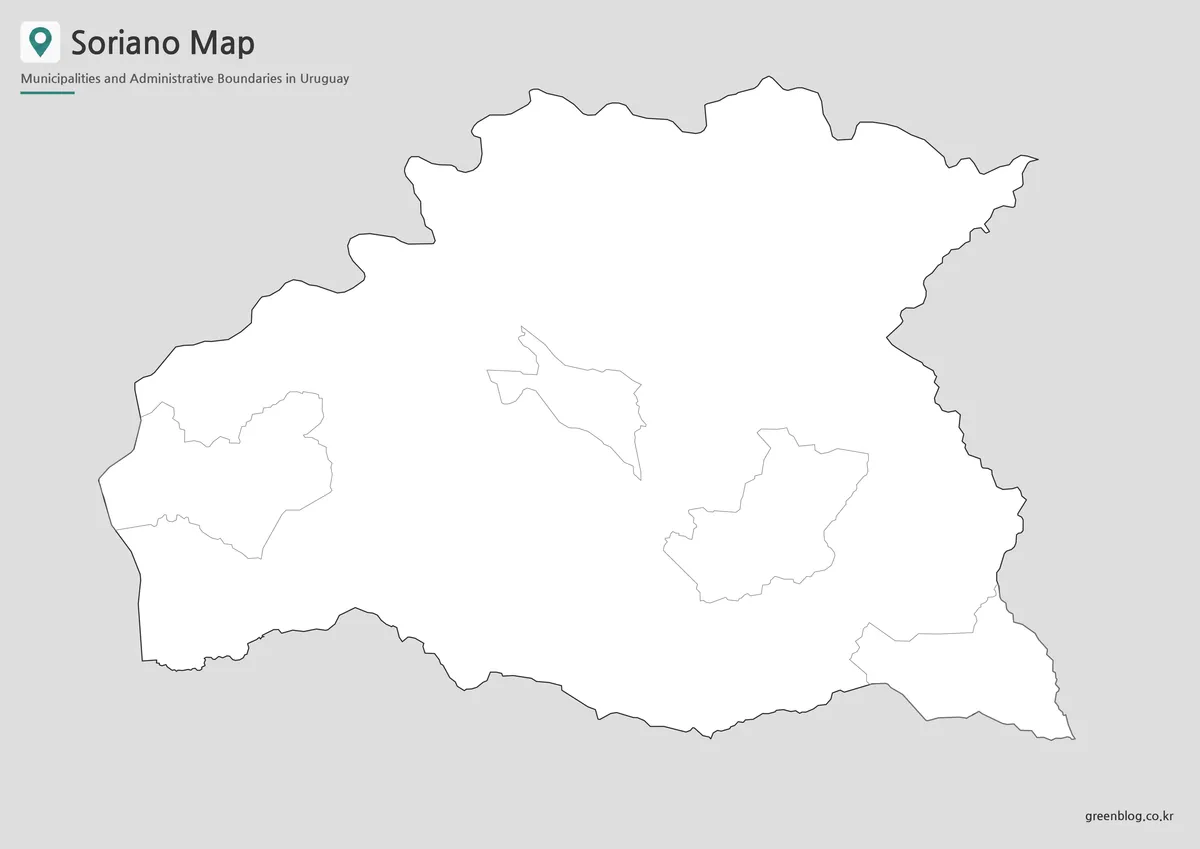
The outline Soriano map removes labels and fills while retaining the outer form and internal boundary sections. With fewer visual elements, it becomes a flexible working map rather than only a simplified preview.
Teachers can use the blank layout for place-name exercises or classroom coloring activities. Students may add Mercedes and the four municipalities by hand, while designers can apply their own color scheme for infographics. It also provides space for agricultural data, population notes, travel routes, city markers, or presentation highlights.
The southeastern extension around Cardona and the irregular northern and eastern edges remain visible in the outline version. These recognizable shapes help users maintain geographic orientation even after adding their own labels or data.
Black and White Map for Documents
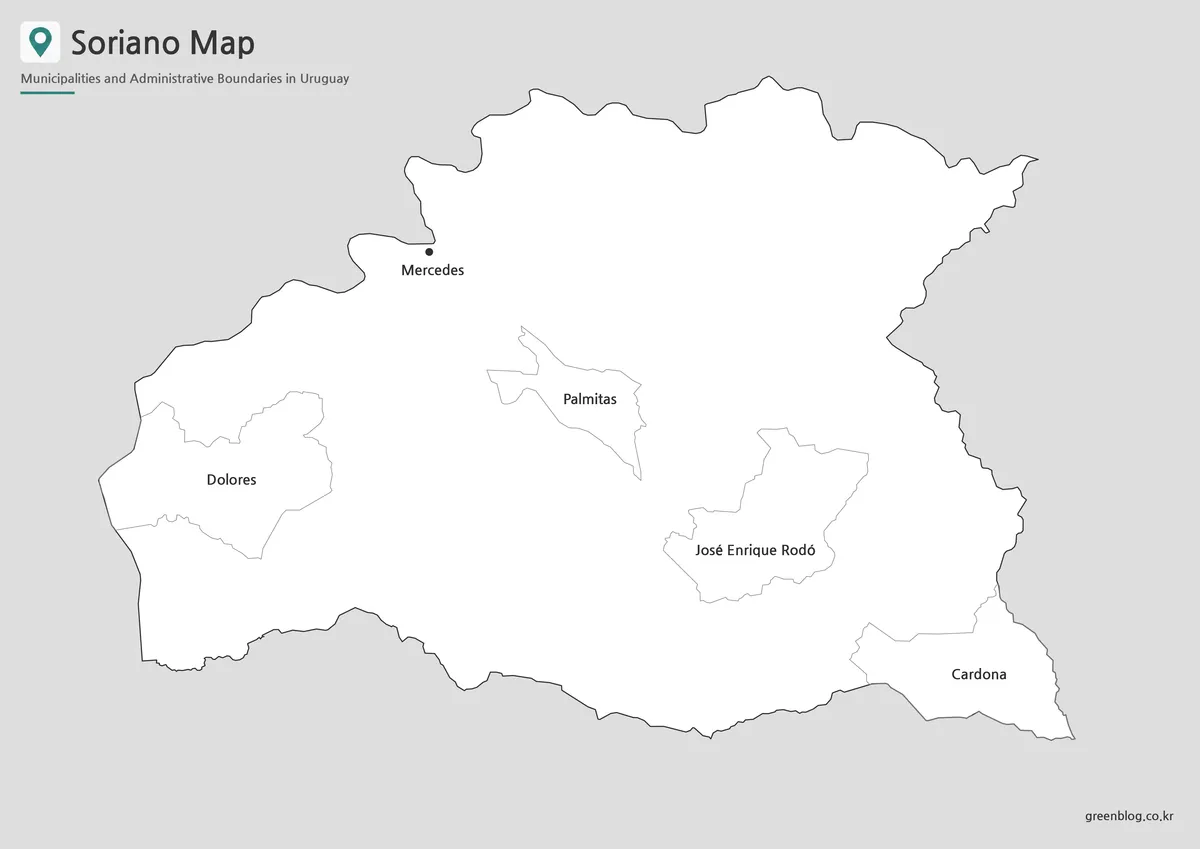
The monochrome version combines municipal names with clear boundary lines on a plain background. It offers more information than the outline file but avoids the additional visual weight of the color design.
Mercedes, Dolores, Palmitas, José Enrique Rodó, and Cardona can all be read directly from the page. This is useful in reports or classroom materials where readers need to identify locations without referring to a separate legend. The cleaner appearance also fits documents that will be printed on a black and white office printer.
At A3 size, the regional names remain separated across the wide layout. The map can also be reduced for presentation notes or inserted into a longer report without competing heavily with surrounding text.
Choosing the Right Version
Choose the color version when regional separation needs to be understood immediately. It is the strongest choice for presentation slides, online articles, and visual comparisons between municipal areas.
The black and white design is better suited to printed reference sheets, reports, and assignments where names must remain visible. Its simple appearance works well alongside written explanations and statistical information.
For projects that require original markings, the outline file offers the most freedom. Users can add routes, data categories, city symbols, classroom answers, or custom colors without removing existing labels. This version is particularly useful for worksheets and infographic editing.
Practical Uses for the Soriano Map
A Soriano map can support geography lessons about Uruguay’s departmental structure and help students compare local centers within one department. It provides more detail than a national map while remaining simple enough for a classroom handout.
Presentation creators may use the files to explain the location of Mercedes in relation to Dolores or the southeastern position of Cardona. Bloggers can place the color version beside a regional introduction, while designers can build data graphics from the blank boundary layout.
The three versions also make it possible to maintain a consistent shape across different materials. A project may use the labeled design in the main report, the color version in a slide presentation, and the outline design in an activity sheet.
Frequently Asked Questions
Which places are labeled on the maps?
The labeled versions include Mercedes, Dolores, Palmitas, José Enrique Rodó, and Cardona. Mercedes is shown as the departmental capital, while the four municipal areas are identified by their boundaries and names.
Why is Mercedes shown differently from the municipalities?
Mercedes is represented with a city marker in the northwest. The other four locations are displayed as highlighted municipal boundary areas, allowing readers to separate the capital from the mapped municipalities.
Which version is best for classroom printing?
The black and white version is suitable for reference sheets and assignments that require visible names. The outline version works better for labeling exercises, coloring activities, and student annotations.
Can I add information to the outline file?
Yes. The blank boundaries provide space for city markers, population information, agricultural zones, travel paths, or custom infographic labels.
What does the Soriano map collection include?
It includes a color map, a blank outline map, and a labeled black and white map. The three designs support visual comparison, printing, classroom use, and basic graphic editing.
Download Information
Map File Information
This download includes printable Soriano map versions for educational use, presentation design, document printing, and editable graphic projects.
- Included Versions: Color map, outline map, black and white map
- Printable Size: A3 layout
- File Type: JPG image files
- Intended Use: Classroom handouts, presentations, blog graphics, infographic editing, and printable reference materials
Related Maps
Additional Resources
- Soriano Department Government – regional and municipal information is available through the department’s official website.
Green Map creates custom-edited map images using open geographic data sources such as geoBoundaries, Natural Earth, OpenStreetMap, and government open data.
These maps are edited visual materials, not raw data files, and are provided for education, documents, presentations, and graphic reference.