A Canelones Department Map has to show two very different spatial patterns on one page: broad inland municipalities across the north and east, and a tight belt of smaller municipalities beside Montevideo and the Río de la Plata. Canelones lies in southern Uruguay, with Florida to the north, San José to the west, Lavalleja to the northeast, Maldonado to the east, and Montevideo against part of the southwest. The long water-facing edge completes the department’s distinctive outline.
This collection includes three coordinated versions. The color map gives every municipality a separate muted fill, the black and white map retains the names and boundaries for low-ink printing, and the outline removes both labels and color for original work. All three published previews measure 1200×849 pixels and use a landscape composition prepared for A3 printing.
The labeled maps contain 30 municipalities, from San Ramón and Tala in the north to Ciudad de la Costa, Paso Carrasco, Parque del Plata, and La Floresta along the south. They also name the surrounding departments, Montevideo, and the Río de la Plata. This shared geometry allows one Canelones Department Map to introduce the layout while another becomes a worksheet, report illustration, or custom regional graphic.
Table of Contents
How the Canelones Department Map Is Arranged
The western side begins with Santa Lucía, Aguas Corrientes, Canelones, and Los Cerrillos. Progreso sits farther south, followed by a cluster that includes La Paz, 18 de Mayo, and Las Piedras. These municipalities approach the Montevideo metropolitan area, and their shapes become smaller and more closely packed than the northern areas. The map therefore needs short labels and careful placement in the southwest.
Across the middle, San Antonio, San Bautista, Santa Rosa, Sauce, and San Jacinto connect the western group with the east. Empalme Olmos, Pando, Toledo, Suárez, Barros Blancos, and Nicolich fill the transition toward the southern urban corridor. Reading a Canelones Department Map from this central band makes it easier to see how inland and metropolitan municipalities meet rather than treating them as separate lists.
The northern and eastern shapes are generally broader. San Ramón and Tala occupy much of the upper edge, while Migues, Montes, and Soca extend toward Lavalleja and Maldonado. Along the lower edge, Paso Carrasco and Ciudad de la Costa lead eastward to Salinas, Atlántida, Parque del Plata, and La Floresta. The coastal sequence is visible without roads or city markers because the municipal boundaries follow the water-facing side.
Color Map for Regional Comparison
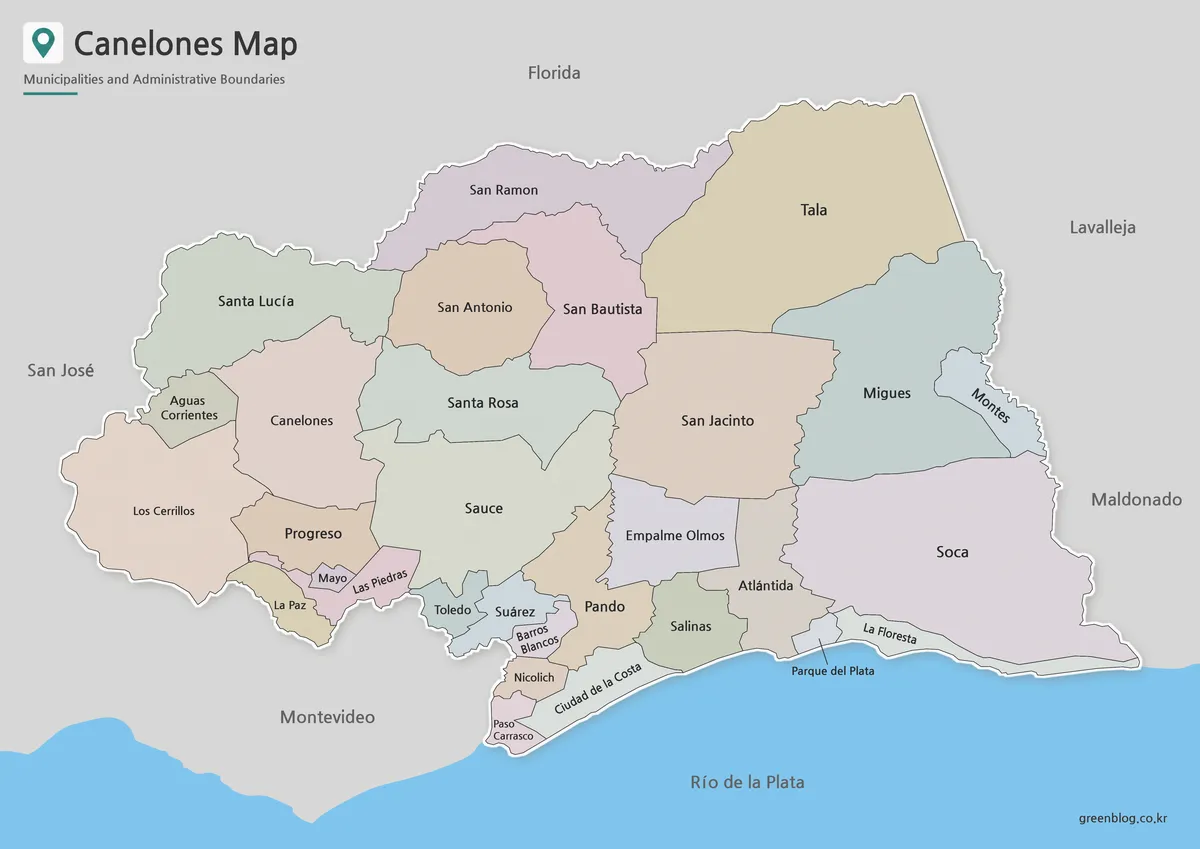
The color version uses soft alternating fills to separate adjoining municipalities. Blue identifies the Río de la Plata, gray places neighboring land in the background, and a light outer stroke keeps Canelones visually distinct. This restrained palette is especially helpful around Las Piedras, Toledo, Suárez, Barros Blancos, Pando, and the coastal municipalities, where many boundaries occupy a small part of the page.
In the north and east, color makes the contrast in scale immediately visible. Tala covers a large upper area, Soca fills much of the southeast, and San Ramón stretches across the northwestern interior. The Canelones Department Map can therefore support a comparison of size and position without adding numerical data or a complex legend.
Use this version for an introductory slide, a regional overview, or an answer key. If the map becomes the base for a thematic graphic, add only a small number of symbols and explain them in a separate legend. Keeping overlays distinct from the pastel fills will preserve the original municipal pattern and label readability.
Black and White Map for Printing
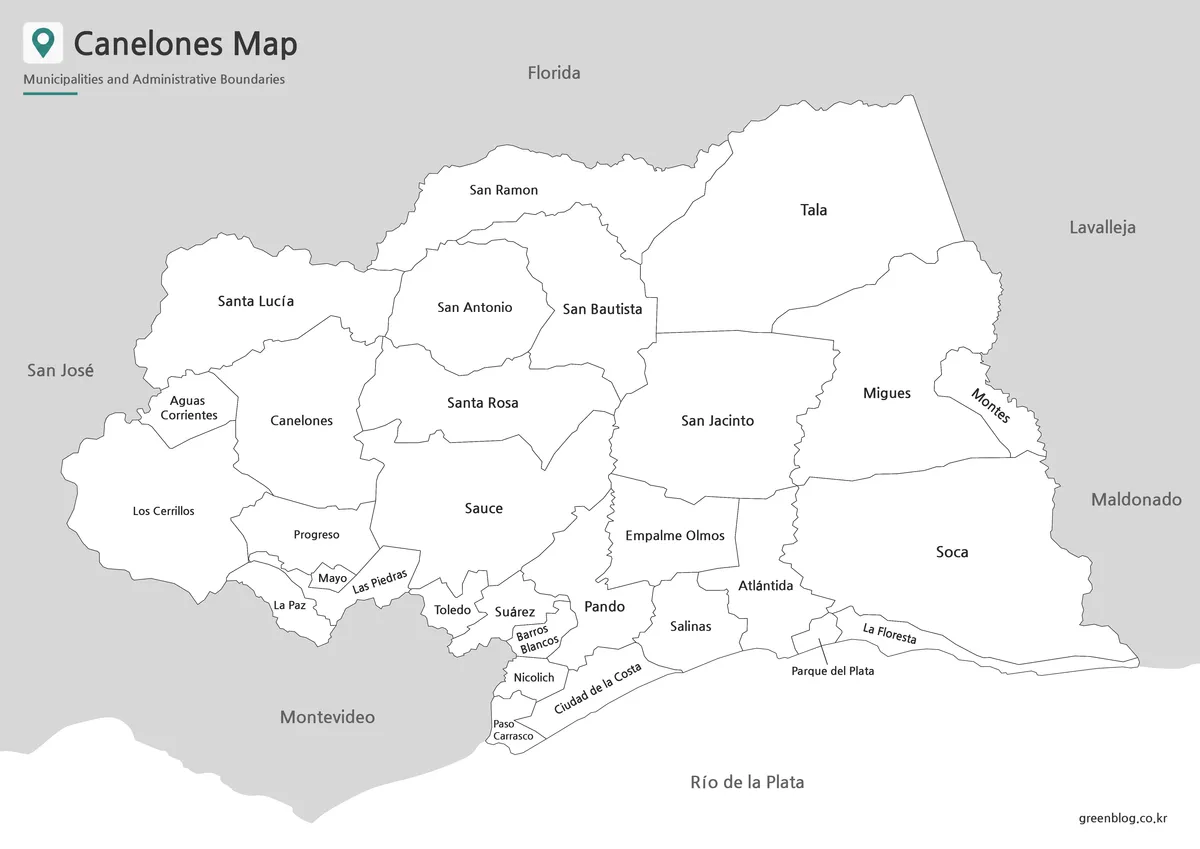
The black and white map preserves the same 30 municipality names and administrative lines but removes the colored fills. White municipal interiors stand against gray surrounding regions, while the Río de la Plata remains a light open area below the coast. This treatment directs attention to names, outlines, and relative position and reproduces cleanly on an ordinary monochrome printer.
Because southern labels are the smallest, the landscape layout should be retained when the image is placed in a document. A test print can confirm that Las Piedras, Barros Blancos, Nicolich, Paso Carrasco, and nearby names remain legible before producing multiple copies. The 1200×849 preview is suitable for on-page viewing, while the downloadable collection is arranged around the stated A3 format.
This Canelones Department Map works well as a reference sheet, report figure, or answer page. Students can underline coastal municipalities, group neighboring areas, or add a few selected locations without competing with a colored background. The existing names make it less suitable for a pure recall quiz than the blank outline, but more useful when the lesson focuses on spatial relationships.
Outline Map for Editing and Infographics
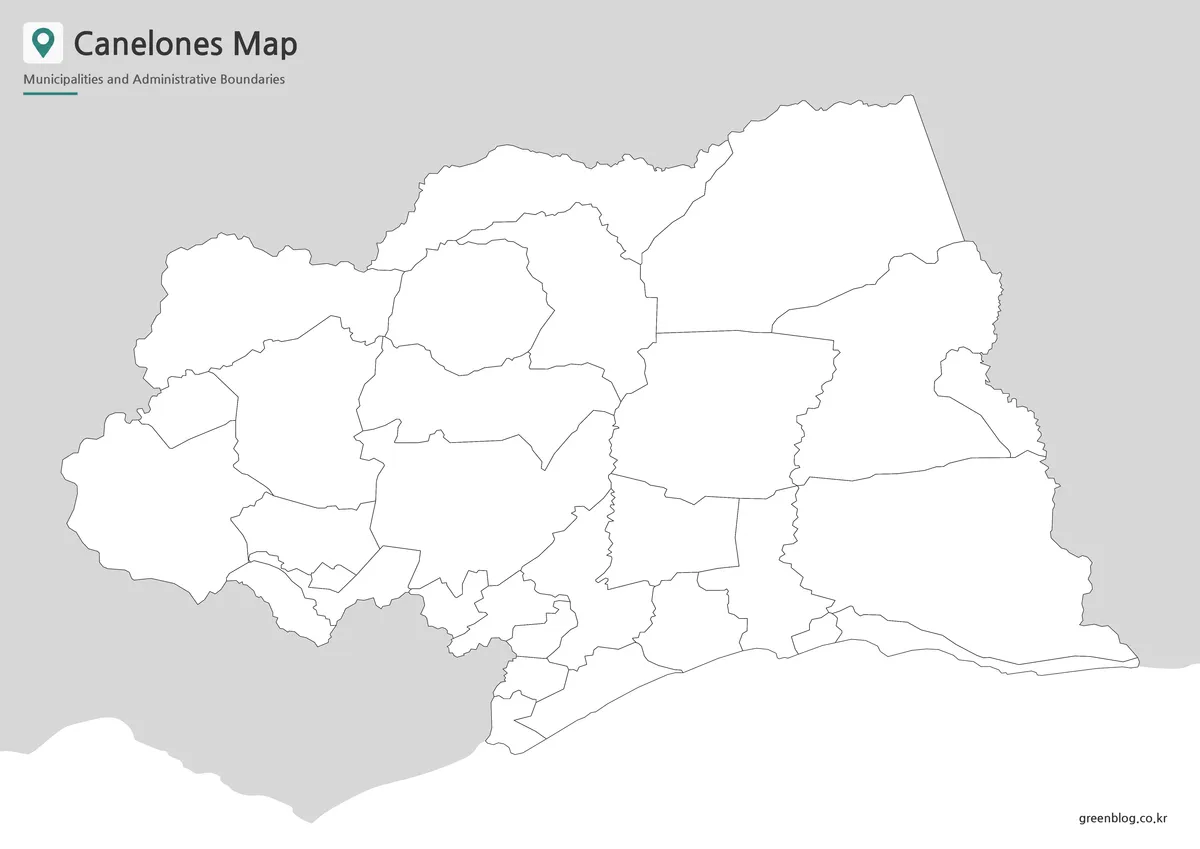
The outline version removes every municipality name, neighboring-region label, water label, and fill color. What remains is the department silhouette, the 30 internal divisions, and simplified surrounding shapes. This is an important difference from the black and white map: the outline is not a labeled reference but a clean working surface.
For a classroom activity, learners can add municipality names, identify the areas adjoining Montevideo, or shade a coastal group along the Río de la Plata. A second exercise might compare the compact southwest with the broad north and east. Because the base contains no answers, teachers can choose the number and difficulty of the labels.
For infographic work, the outline Canelones Department Map can hold statistical colors, service areas, transport lines, or selected markers. Start with an untouched copy, keep the boundary layer visible, and limit annotations in the dense southern cluster. A short legend and consistent symbol size will make custom information easier to read without concealing the municipal structure.
Neighboring Areas and Coastal Context
The labeled maps place Florida above Canelones, San José on the west, Lavalleja at the northeast, and Maldonado along the eastern side. Montevideo touches only the southwestern portion rather than the entire lower boundary. The rest of the south opens toward the Río de la Plata, which is shown as a broad water area below the department.
This context explains the visual shift between the metropolitan southwest and the extended coastal corridor toward Maldonado. It also prevents a common reading error in which every southern municipality is assumed to border Montevideo. On a Canelones Department Map, Paso Carrasco and nearby areas sit closest to the capital, while Ciudad de la Costa, Salinas, Atlántida, Parque del Plata, and La Floresta continue east beside the water.
Choosing the Right Version
Choose color when readers need quick separation among all 30 municipalities. Select black and white when the names must remain visible in a report, handout, or photocopy. Use the outline for labeling, coloring, or original data overlays. The three versions can form one workflow: introduce the color map, consult the monochrome reference, and complete the outline independently.
Whichever file is used, preserve the landscape proportions and avoid crowding the southwestern cluster. A small number of purposeful additions is more effective than placing every available city, route, or statistic on the same page. The value of the set lies in keeping the municipal structure consistent while allowing the level of color and labeling to change.
Frequently Asked Questions
Can the maps be printed at A3 size?
Yes. The collection is arranged for A3 printing, which helps keep the smaller southern municipality labels readable.
Which version is best for a classroom worksheet?
The black and white map works well for printed reference sheets, while the outline map is better for labeling, coloring, and annotation exercises.
Can I add my own information to the map?
Yes. The outline version is suited to population data, travel routes, city markers, service areas, tourism locations, and infographic notes.
Does the Canelones Department Map show nearby regions?
Yes. The layout includes the surrounding departments and the Río de la Plata so the position of Canelones within southern Uruguay is easier to understand.
Download Information
The three files share one municipality layout but serve different tasks. Use color for comparison, black and white for a labeled print reference, and the blank outline when the project requires original names, groups, routes, or data.
Map File Information
This download contains printable Canelones municipality maps for lessons, reports, presentations, and custom graphics.
- Included Versions: Color, black and white, and outline
Related Maps
Additional Resources
The Canelones Government Maps and Plans page provides official municipality and microregion materials for readers who need more detailed local references.
Green Map creates custom-edited map images using open geographic data sources such as geoBoundaries, Natural Earth, OpenStreetMap, and government open data.
These maps are edited visual materials, not raw data files, and are provided for education, documents, presentations, and graphic reference.