A San José map makes it easier to compare the departmental capital with municipality areas distributed across southern Uruguay. The supplied images identify San José de Mayo together with Rodríguez, Ecilda Paullier, Libertad, and Ciudad del Plata. These places are separated across the eastern, southwestern, southern, and southeastern parts of the department, so their relationship is clearer in a boundary-based visual than in a simple list of names.
San José Department covers 4,992 square kilometers and had 119,718 residents in the 2023 census-based statistics published by the departmental government. San José de Mayo is the capital and appears as a point rather than as a large colored polygon. The municipal statistics separately identify Ciudad del Plata, Libertad, Ecilda Paullier, and Rodríguez, while a substantial share of the department remains outside those four municipality areas.
The department lies in southern Uruguay and includes both broad inland territory and a more densely settled southeastern area near the Río de la Plata and Montevideo region. That contrast is visible in the map layout: Rodríguez occupies a large eastern section, Ecilda Paullier forms a separate southwestern area, Libertad sits along the southern side, and Ciudad del Plata follows the narrow southeastern end. The files do not label neighboring departments, roads, river courses, or the Río de la Plata itself, so they should be treated as administrative reference maps rather than transport or physical-geography maps.
This San José map collection includes color, outline, and black and white versions in WEBP format. The color file supports quick comparison, the blank outline provides a working base for custom information, and the labeled monochrome version fits reports and classroom reference sheets. Teachers, students, bloggers, presentation creators, and infographic designers can choose a version according to whether they need visual separation, editable space, or clear place labels.
Table of Contents
Reading the San José Map Layout
The department has a long north–south shape with a broad upper half and a narrower southern edge. Named municipality areas do not form one continuous block. Rodríguez extends through much of the east and northeast, while Ecilda Paullier is positioned separately in the southwest.
Libertad and Ciudad del Plata both occupy southern areas, but their shapes and locations are noticeably different. Libertad covers a broader polygon near the south-central edge, whereas Ciudad del Plata forms a compact, elongated section at the southeastern tip.
The San José map also distinguishes the capital from municipality territories. San José de Mayo is marked with a dot and label near the central-southern area, while the municipalities are enclosed by boundary lines. This visual difference helps prevent readers from assuming that every place name represents the same administrative type.
Several internal polygons remain unnamed in the supplied images. They should not be treated as missing labels or automatically assigned to one of the four named municipalities. The safest interpretation is that the files display additional internal boundaries while labeling only the capital and the principal municipality areas emphasized in the collection.
Places Identified in the Files
San José de Mayo
San José de Mayo serves as the departmental capital. It is shown near the middle of the department with a point marker, making it a useful reference for comparing the direction of the surrounding municipalities.
Rodríguez lies to its east, Ecilda Paullier is farther west, and Libertad is positioned to the south. The capital marker therefore provides a practical center point for classroom explanations and regional comparison graphics.
Rodríguez
Rodríguez covers a large eastern and northeastern area. Its boundary runs vertically through much of the department and also bends inward around central polygons.
Because the municipality is relatively large, it remains easy to identify when the image is reduced for a presentation slide. Its scale also creates a strong comparison with compact Ciudad del Plata in the southeast.
Ecilda Paullier
Ecilda Paullier occupies a separate southwestern section. Its irregular border follows part of the department’s western and southern outline, giving the municipality a distinct shape.
The separation from Rodríguez is especially clear in the color version. This makes the area useful when explaining the contrast between western and eastern municipality locations.
Libertad
Libertad is positioned along the south-central side of San José Department. The polygon broadens toward the departmental boundary and sits between inland territory and Ciudad del Plata.
Its location makes it useful for discussing the transition from the central department toward the southern urban corridor. The boundary is also simple enough to recognize in both color and monochrome printing.
Ciudad del Plata
Ciudad del Plata forms the southeastern tip of the department. It is long and narrow compared with the other named municipality areas.
The departmental statistics recorded 40,125 residents in the municipality in 2023, making it the most populous of the four municipal territories listed on the official statistics page. This population concentration differs sharply from its small geographic area, which covers about 125.8 square kilometers.
Color Version for Comparing Regional Scale
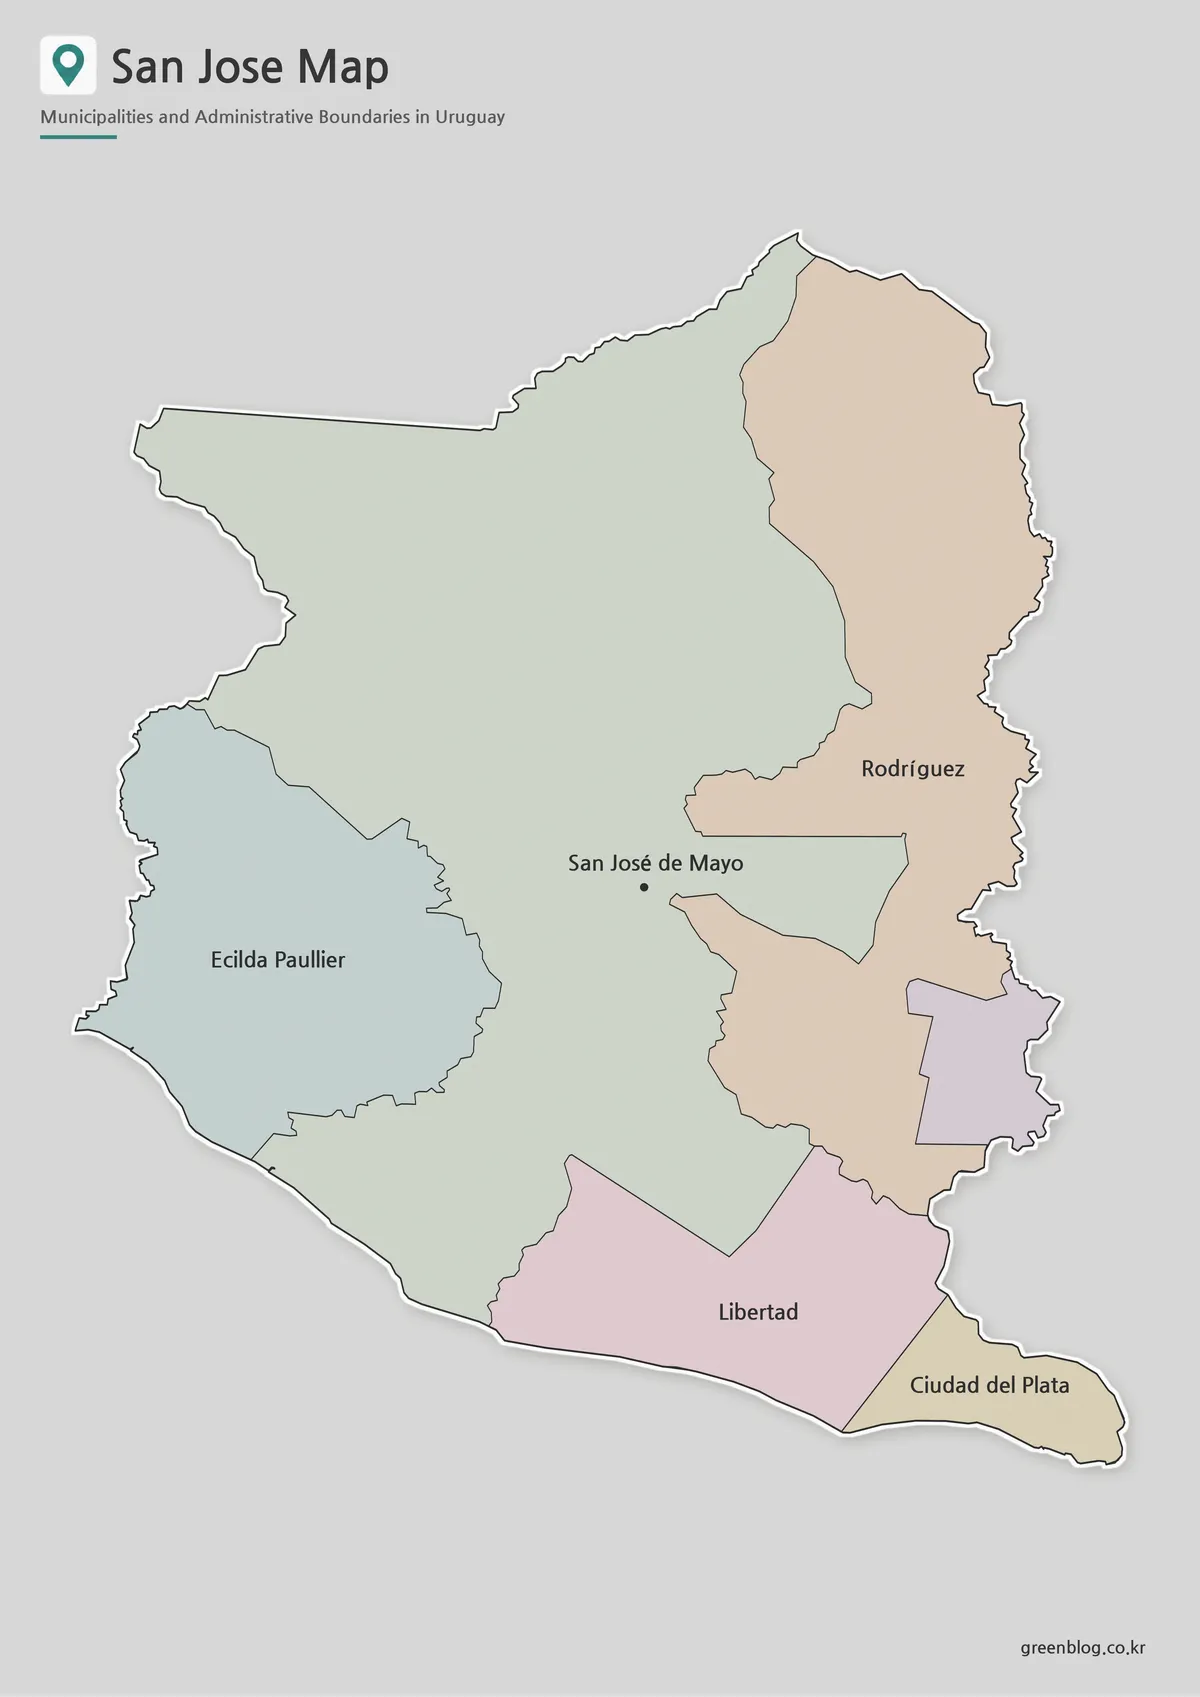
The color San José map separates Rodríguez, Ecilda Paullier, Libertad, and Ciudad del Plata with different fills. This is particularly helpful because the municipality areas vary considerably in size and are spread across opposite sides of the department.
Rodríguez appears as a broad eastern territory, while Ciudad del Plata occupies a much smaller southeastern section. Ecilda Paullier and Libertad can also be compared without relying only on their labels.
San José de Mayo remains visible as a black point rather than a filled area. For introductory slides and blog graphics, this version provides the quickest distinction between the capital, municipal territories, and the unlabelled remainder of the department.
Blank Outline Map as a Working Base
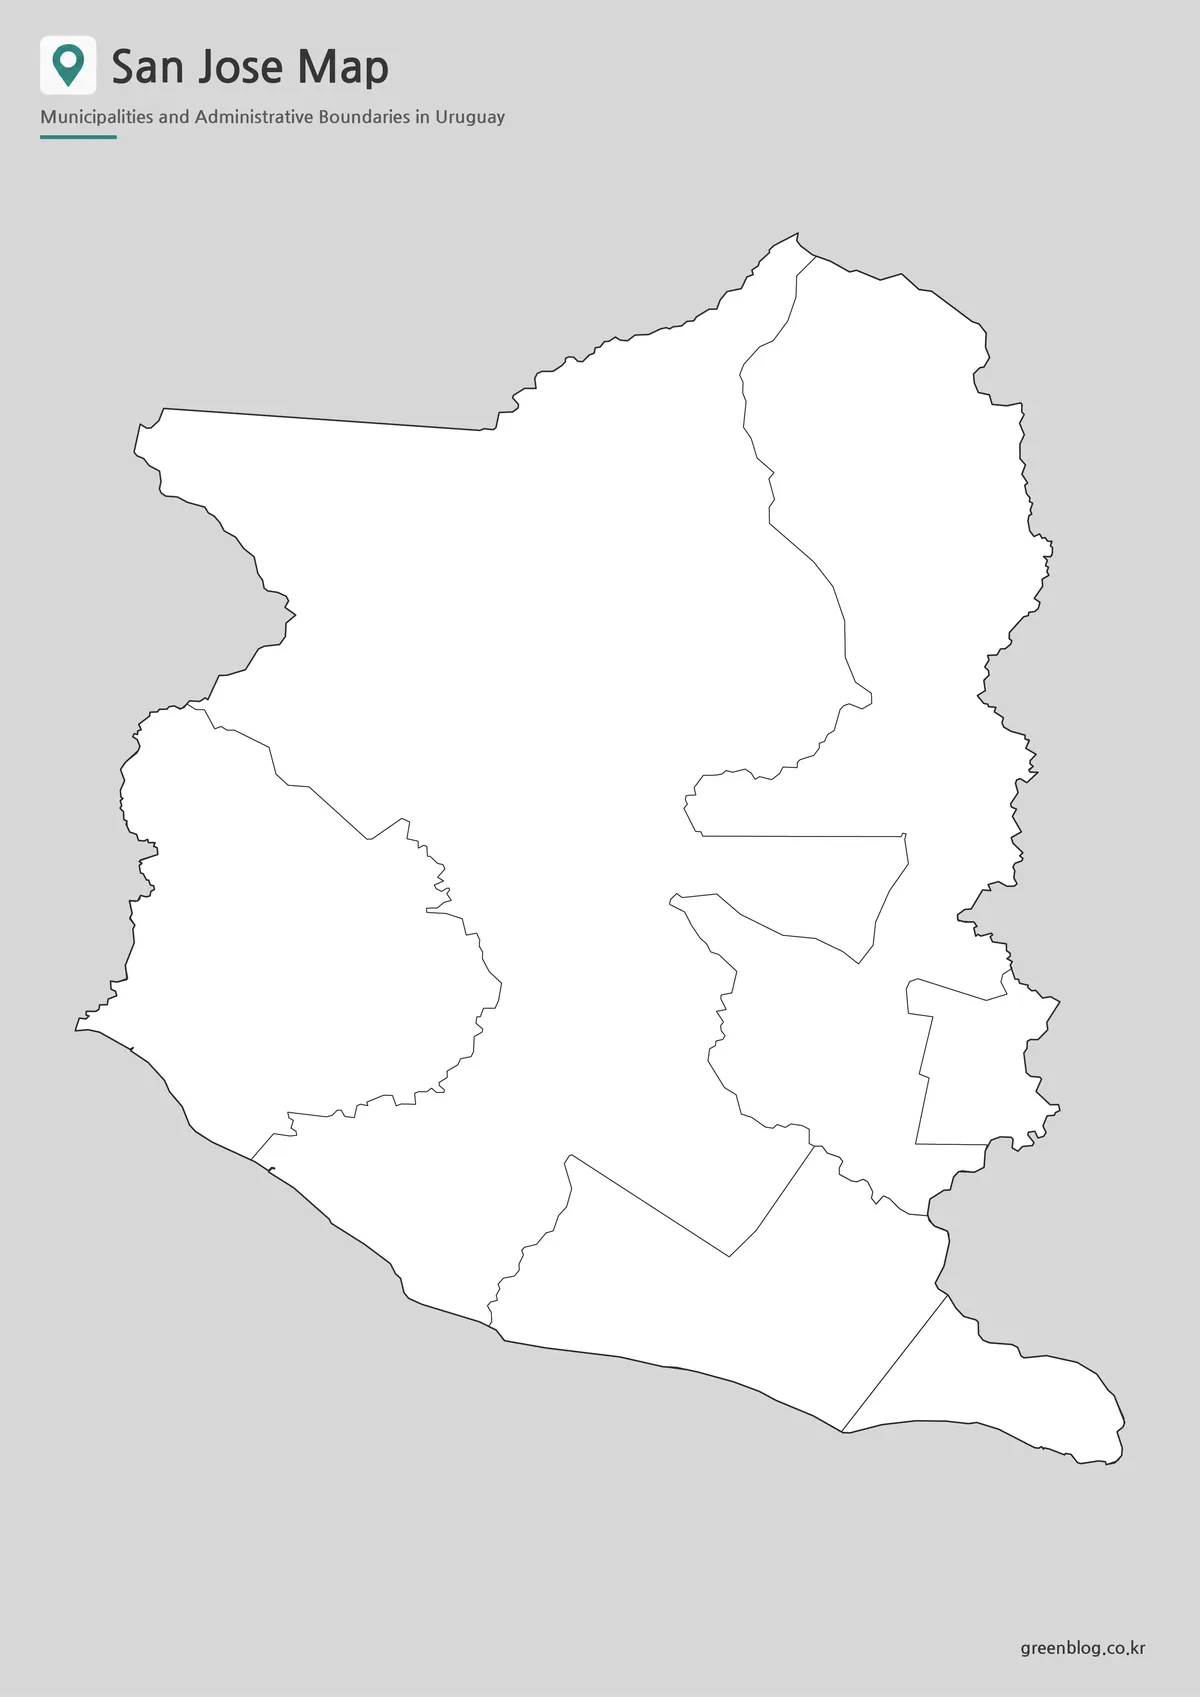
The outline San José map removes all labels and color fills while preserving the external shape and internal boundaries. It gives teachers and designers an open base for adding only the information required by a particular project.
Students can write the capital and municipality names, color selected regions, or complete a location exercise. Infographic creators may add population figures, economic activities, arrows, symbols, or comparison notes without covering existing text.
The blank file does not contain roads, neighboring departments, coastal names, or transport routes. Those features should be added only from separately verified references when a project requires more than administrative boundaries.
Black and White Version for Documents
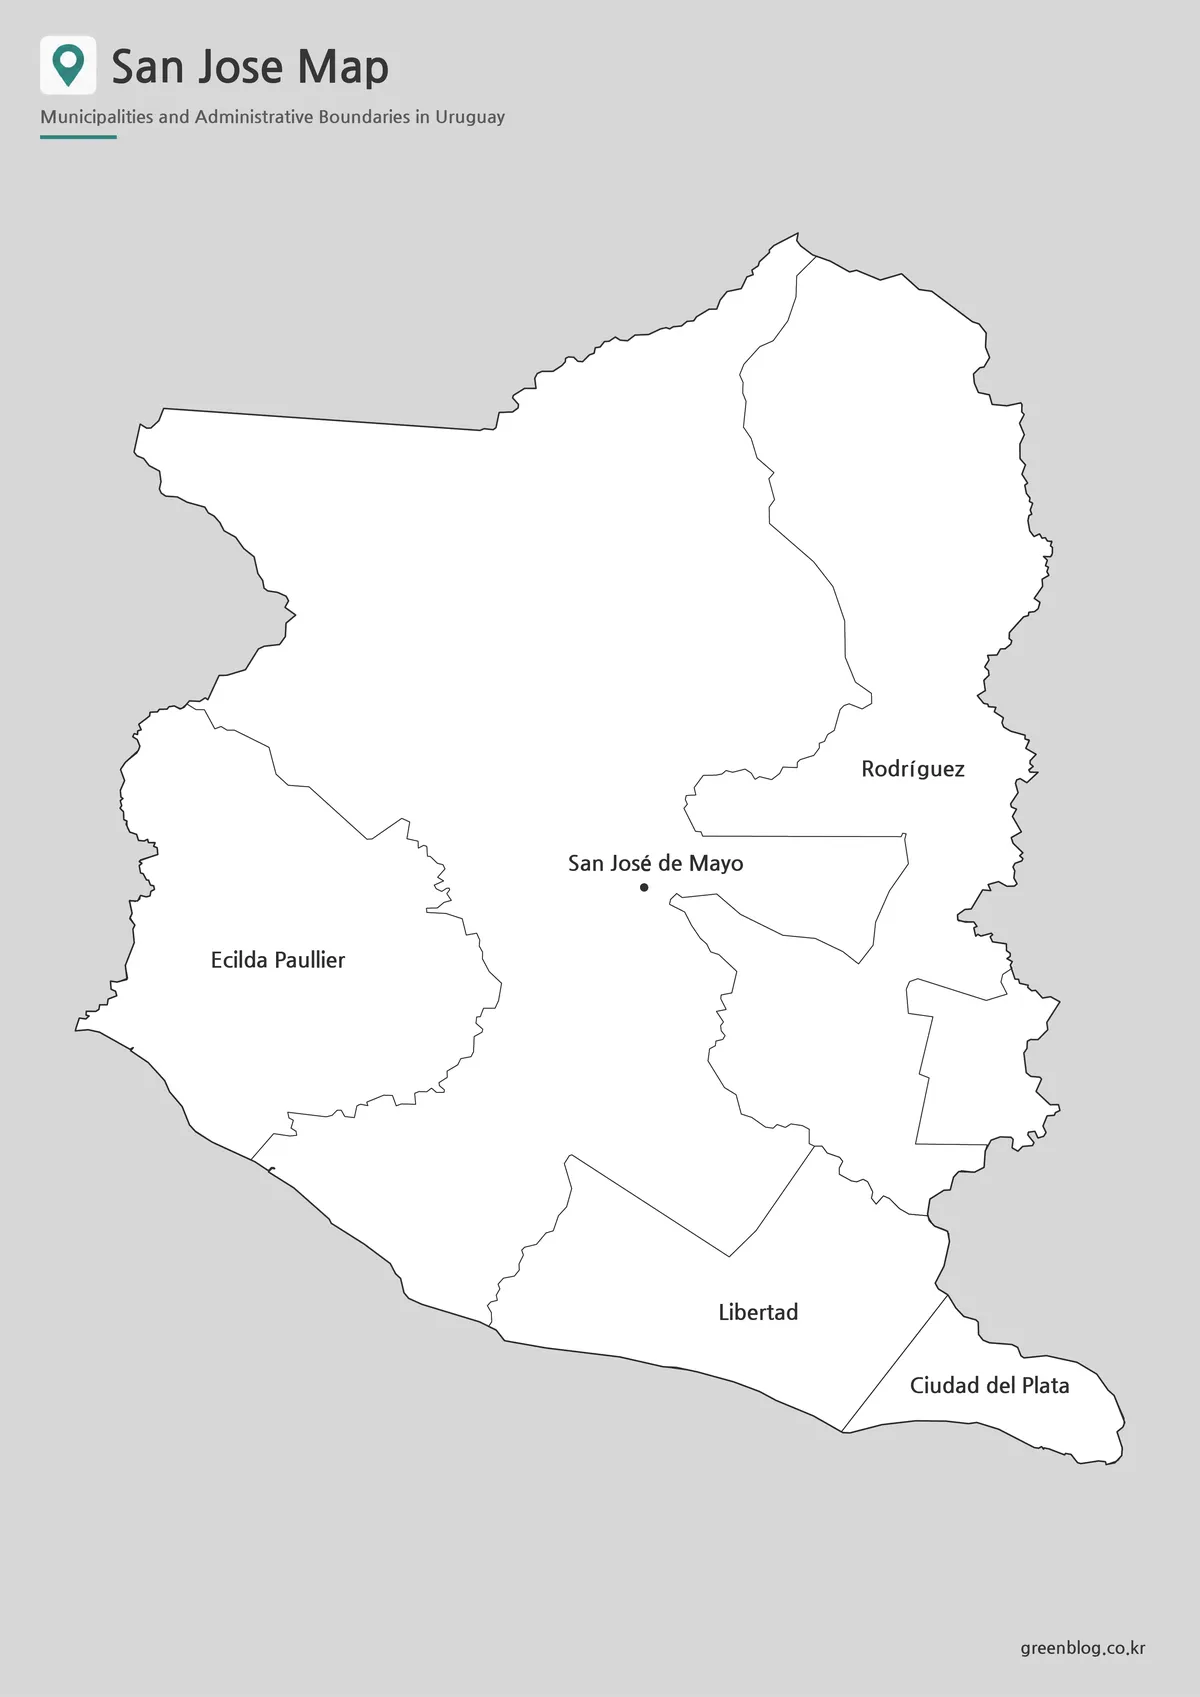
The black and white San José map retains the place names and boundaries while removing the color fills. Its open layout works well in photocopied worksheets, reports, study guides, and documents where color would add unnecessary visual weight.
San José de Mayo remains clearly distinguishable through its point marker. Rodríguez, Ecilda Paullier, Libertad, and Ciudad del Plata can be identified directly, while unnamed polygons remain visible as boundary areas.
This labeled version can also serve as an answer sheet paired with the outline file. Using the two together creates a simple classroom activity without requiring a separate map design.
Practical Ways to Use the Files
Teachers can introduce the municipality names with the labeled version and then use the blank file for a follow-up exercise. Students might mark the capital, compare the larger Rodríguez territory with compact Ciudad del Plata, or identify which municipalities occupy the southern edge.
For reports and presentations, the color map offers a quick overview while the monochrome version fits more naturally beside text and statistics. Bloggers can use the collection when explaining the administrative layout of southern Uruguay without adding unrelated tourism or road information.
The files also work as bases for demographic graphics. Official departmental figures show major differences in population and density among Ciudad del Plata, Libertad, Ecilda Paullier, Rodríguez, and the remaining territory, giving users a clear subject for custom annotations or comparative charts.
Frequently Asked Questions
What places are labeled on the San José map?
The labeled files show San José de Mayo, Rodríguez, Ecilda Paullier, Libertad, and Ciudad del Plata.
Is San José de Mayo displayed as a municipality?
It is shown as the departmental capital with a point and label rather than as one of the four colored municipality polygons.
Why are some boundary areas not labeled?
The supplied images include additional internal boundaries, but only the capital and four municipality areas have names. Unnamed polygons should not be assigned a name without another verified source.
Does the map include neighboring departments or roads?
No. Neighboring department names, roads, river courses, and transport routes are not shown.
Which version is best for editing?
The outline version offers the clearest base for custom labels, coloring, statistics, symbols, and presentation annotations.
Download Information
Map File Information
This download includes printable San José map versions for educational use, presentation design, document printing, and editable graphic projects.
- Included Versions: Color map, outline map, black and white map
- File Type: WEBP image files
- Displayed Areas: San José de Mayo, Rodríguez, Ecilda Paullier, Libertad, and Ciudad del Plata
- Intended Use: Classroom handouts, presentations, reports, blog graphics, regional comparisons, and infographic editing
Related Maps
Additional Resources
- San José – Uruguay Natural : The national tourism page introduces San José de Mayo, cultural landmarks, local traditions, and destinations within the department.
Green Map creates custom-edited map images using open geographic data sources such as geoBoundaries, Natural Earth, OpenStreetMap, and government open data. These maps are edited visual materials, not raw data files, and are provided for education, documents, presentations, and graphic reference.