The World Bank indicator Combustible renewables and waste (% of total energy) measures the contribution of solid biomass, liquid biomass, biogas, industrial waste and municipal waste to a country’s total energy supply. Across the 149 economies in this latest-observation dataset, values span from 0.00% to 94.43%. The median is 10.73%, while the unweighted mean is 21.97%. That large gap between median and mean immediately signals a strongly right-skewed distribution: a relatively small group of very high-share economies lifts the average far above the position of the typical observation.
The indicator should not be treated as a ranking of modern clean-energy deployment. Its numerator includes combustible biomass and waste, including forms that can be associated with long-established household or traditional energy use, and its denominator is total energy supply rather than electricity generation. A high percentage therefore says that combustible renewables and waste occupy a large place in the national energy balance. It does not, by itself, say that the country has more wind and solar capacity, more advanced technology, lower emissions, or a better energy transition outcome.
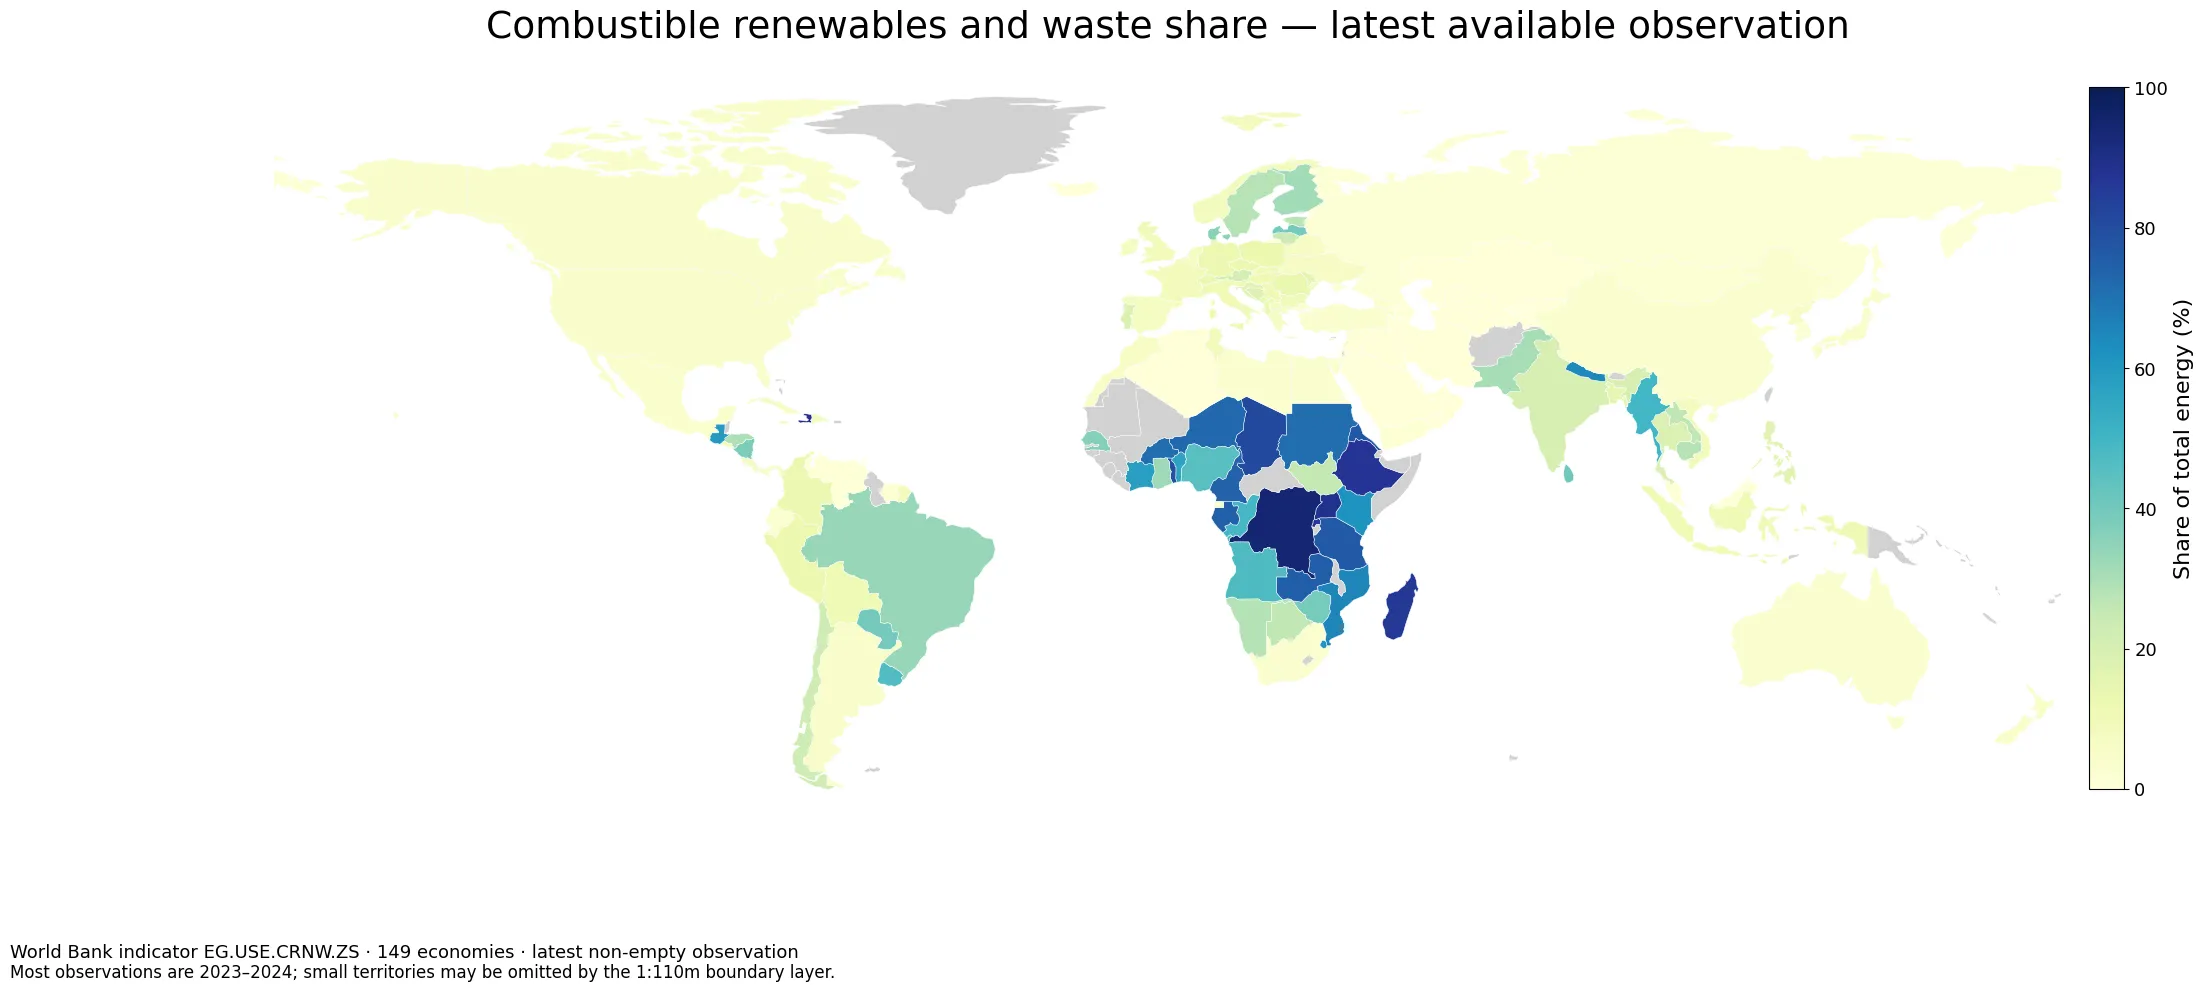
Table of Contents
What the indicator actually includes
World Bank WDI series EG.USE.CRNW.ZS defines combustible renewables and waste as solid biomass, liquid biomass, biogas, industrial waste and municipal waste. Biomass can include plant matter and animal products used directly as fuel or converted into fuel, heat or electricity. The percentage expresses the role of these sources in total energy supply. Because it is a share, it does not measure absolute consumption: a small economy can have a very high percentage with a modest physical quantity, while a large economy can consume more biomass in absolute terms but still record a low share.
The denominator also matters. This is not an electricity-generation indicator. Total energy supply is a broader concept that reflects primary energy entering the economy before transformation into final fuels such as electricity or refined petroleum products. For that reason, this series can move very differently from renewable electricity share or renewable final-energy consumption. A country dominated by hydropower or wind can have a low value here if combustible biomass and waste are minor, while a country with extensive traditional biomass use can have a high value even without a large modern renewable-power fleet.
The latest year is not identical for all 149 economies
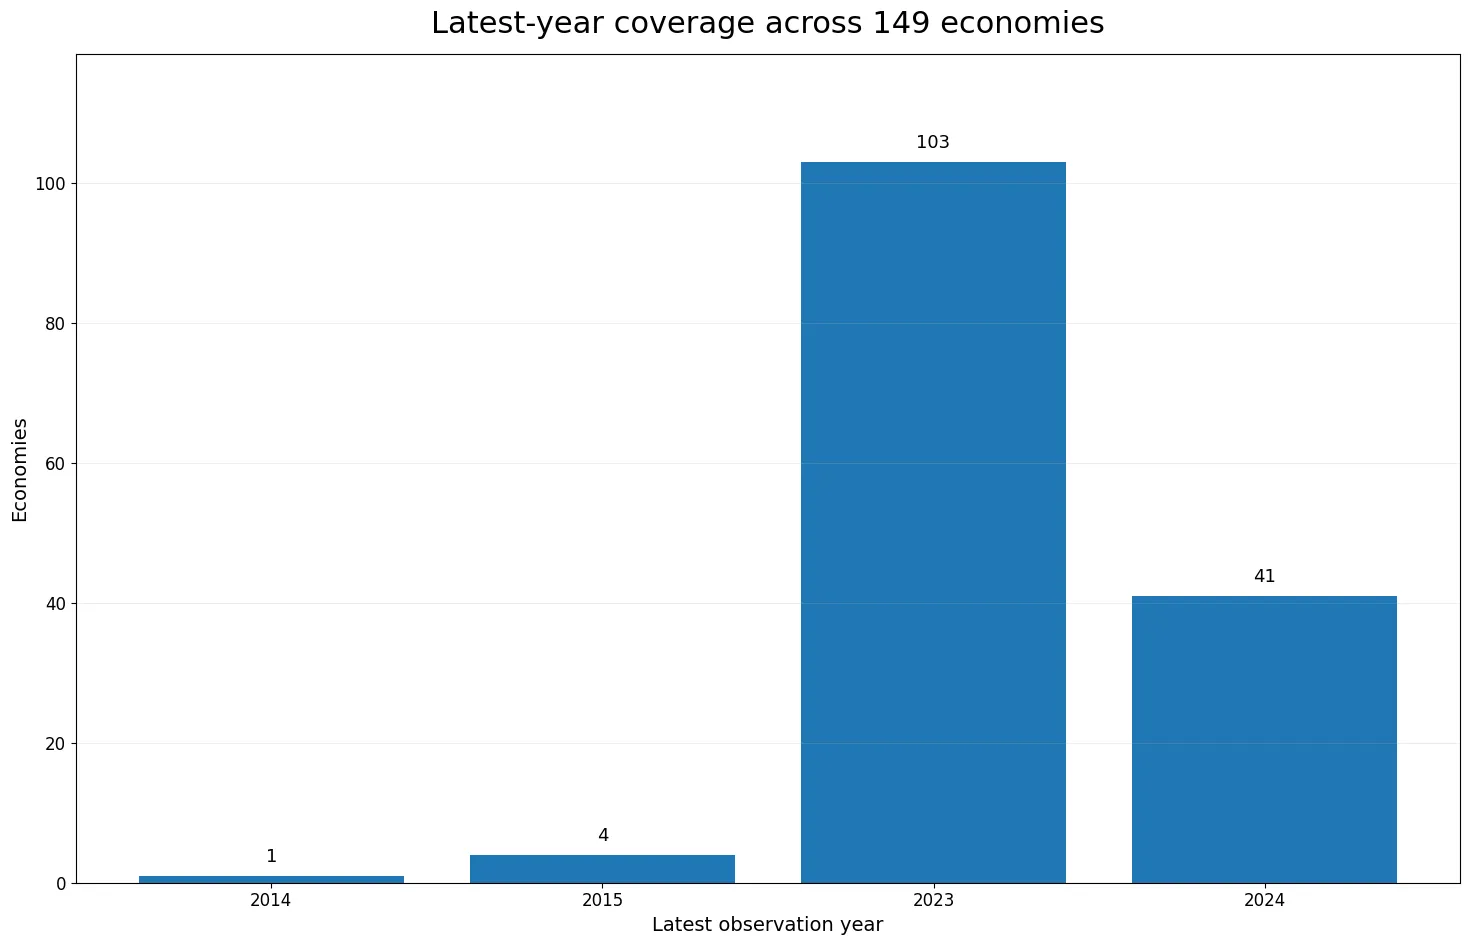
Of the 149 observations, 41 are from 2024 and 103 are from 2023. Together those two years account for 144 observations, or about 96.6% of the dataset. Four economies have 2015 as their latest available year and one has 2014. This is therefore best described as a comparison of latest available country observations, not a pure 2024 league table. Every value in the full table is paired with its observation year so the timing difference remains visible.
Brunei Darussalam, Gibraltar, Oman and Tajikistan have 2015 as their latest observation in this extract, while Kosovo has 2014. Those older entries are useful for coverage, but they should not be interpreted as if they represent the same energy conditions as the 2023–2024 values. If an analysis requires strict same-year comparability, the correct approach is to select a common historical year with broad country coverage and rebuild the cross-section, rather than silently mixing old and new observations.
Very high shares cluster in Sub-Saharan Africa and a few other economies
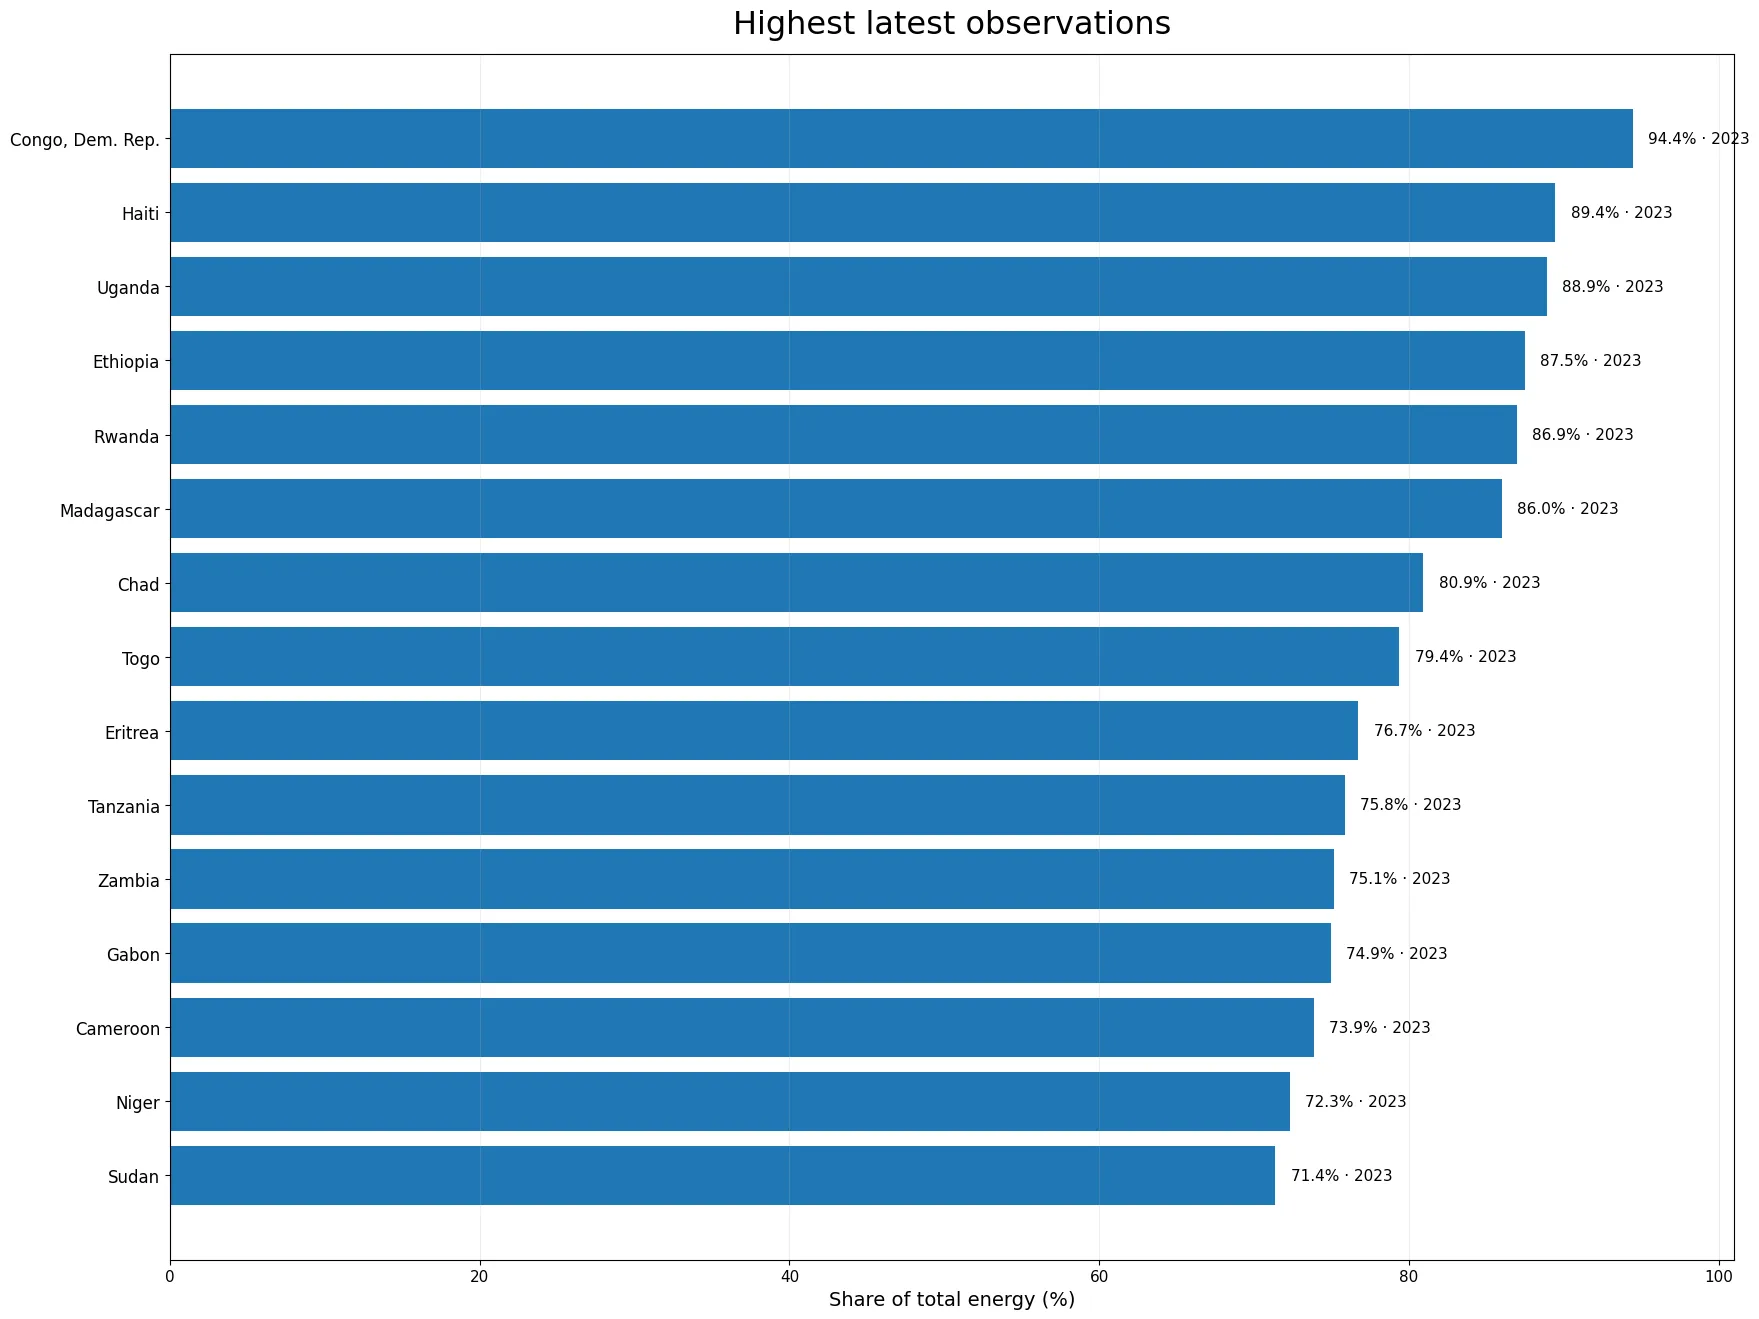
The highest latest value is the Democratic Republic of the Congo at 94.43% in 2023. Haiti follows at 89.42%, then Uganda at 88.89%, Ethiopia at 87.46%, Rwanda at 86.94% and Madagascar at 86.00%. Chad records 80.90%. Togo, Eritrea, Tanzania, Zambia, Gabon, Cameroon, Niger and Sudan also sit above 70%. The map makes the geographic concentration of high observations across much of Sub-Saharan Africa visually clear, with Haiti standing out in the Caribbean.
This pattern should be interpreted through the definition of the series rather than through a generic “renewable leadership” lens. Because the indicator includes solid biomass and waste, a large share can reflect heavy reliance on wood, charcoal, crop residues, animal products, biogas or waste streams in the overall energy balance. The series does not disaggregate those components in the country values shown here. Determining whether a high share is driven by traditional household biomass, industrial bioenergy, waste-to-energy systems or other forms requires additional fuel-specific energy-balance data.
The typical observation is much lower than the top of the ranking
The median across 149 economies is 10.73%, the first quartile is 3.47% and the third quartile is 31.29%. 71 economies are below 10%, 50 are at or above 20%, and only 23 are at or above 50%. Just seven economies reach at least 80%. The mean of 21.97% is therefore not a good description of a “typical” country because the cluster of very high observations pulls it upward. The median is a more robust single-number guide to the centre of this uneven distribution.
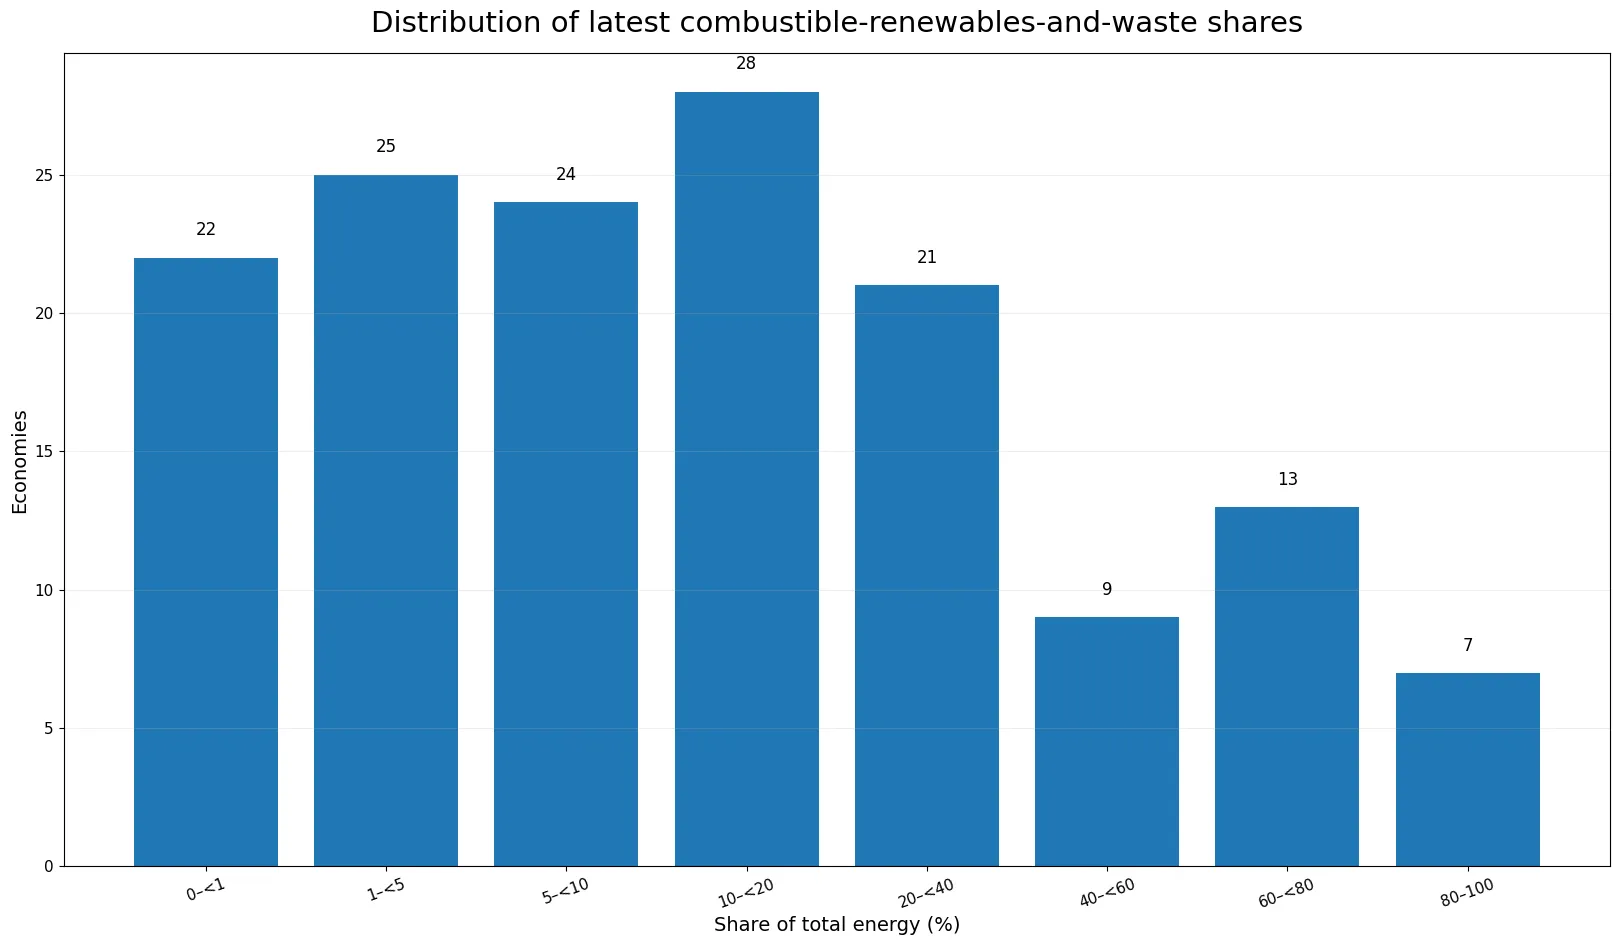
The distribution by broad bands is also informative: 22 economies are below 1%, 25 are between 1% and 5%, 24 are between 5% and 10%, 28 are between 10% and 20%, 21 are between 20% and 40%, nine are between 40% and 60%, 13 are between 60% and 80%, and seven are at or above 80%. In other words, combustible renewables and waste are a marginal energy source in one large group of economies and a dominant source in another. That structural split is more meaningful than tiny differences between adjacent ranks.
How to read zero and near-zero observations
22 economies have latest values below 1%, and 5 are recorded at exactly 0.00%. Bahrain is 0.00% in 2023; Brunei Darussalam, Gibraltar, Oman and Tajikistan are 0.00% in 2015. Among the smallest positive observations are Saudi Arabia at 0.003%, Uzbekistan at 0.004%, Qatar at 0.011%, Algeria at 0.011% and Turkmenistan at 0.028%. These figures indicate that the indicator’s covered sources make up only a tiny share of total energy supply in those observations.
An entry of 0.00% should not automatically be converted into the stronger claim that no biomass or waste energy exists anywhere in that economy. National energy statistics are compiled from surveys, administrative systems and estimates, and very small quantities may be rounded or fall outside the coverage used for a particular series. The four zero observations from 2015 are also much older than most of the dataset. For current operational details, the latest national energy balance or the underlying IEA data should be consulted.
Official metadata warns against overly precise country comparisons
World Bank metadata identifies the IEA Energy Statistics Data Browser as the underlying source and classifies the indicator as annual. It also notes an important limitation: data for combustible renewables and waste are often based on small surveys or incomplete information, so they provide a broad impression of developments and are not strictly comparable across countries. National statistical systems differ, and the IEA may revise historical series as more detailed energy accounts become available. Breaks in methodology or coverage can therefore occur.
Those limitations change how the ranking should be used. Large gaps—such as an economy above 70% versus one below 5%—are informative for identifying very different energy structures. Small differences between neighbouring values should not be treated as precise competitive rankings. Nor does the indicator reveal the mix inside the numerator, the efficiency of combustion technologies, energy costs, emissions, air quality or policy effectiveness. It is best used as a screening measure that shows where combustible renewables and waste are relatively prominent in the energy system.
Latest observations for all 149 economies
The table below lists every economy in descending order of the latest reported share. The observation year is shown next to the percentage because the dataset is not a single-year cross-section. Country names follow the World Bank labels and percentages are rounded to two decimal places for readability.
| Economy | Latest year | Share (%) |
|---|---|---|
| Congo, Dem. Rep. | 2023 | 94.43 |
| Haiti | 2023 | 89.42 |
| Uganda | 2023 | 88.89 |
| Ethiopia | 2023 | 87.46 |
| Rwanda | 2023 | 86.94 |
| Madagascar | 2023 | 86.00 |
| Chad | 2023 | 80.90 |
| Togo | 2023 | 79.38 |
| Eritrea | 2023 | 76.71 |
| Tanzania | 2023 | 75.84 |
| Zambia | 2023 | 75.13 |
| Gabon | 2023 | 74.93 |
| Cameroon | 2023 | 73.85 |
| Niger | 2023 | 72.29 |
| Sudan | 2023 | 71.36 |
| Burkina Faso | 2023 | 71.32 |
| Mozambique | 2023 | 65.24 |
| Nepal | 2023 | 64.64 |
| Kenya | 2024 | 61.97 |
| Eswatini | 2023 | 60.64 |
| Guatemala | 2023 | 59.49 |
| Cote d'Ivoire | 2023 | 58.43 |
| Benin | 2023 | 56.28 |
| Myanmar | 2023 | 49.71 |
| Congo, Rep. | 2023 | 49.24 |
| Angola | 2023 | 47.63 |
| Uruguay | 2023 | 46.68 |
| Nigeria | 2023 | 44.98 |
| Sri Lanka | 2023 | 40.27 |
| Latvia | 2024 | 39.70 |
| Paraguay | 2023 | 39.62 |
| Zimbabwe | 2023 | 39.15 |
| Nicaragua | 2023 | 38.15 |
| Senegal | 2023 | 36.54 |
| Denmark | 2024 | 35.72 |
| Brazil | 2024 | 33.31 |
| Ghana | 2023 | 32.39 |
| Finland | 2024 | 31.29 |
| Pakistan | 2023 | 30.50 |
| Honduras | 2023 | 29.49 |
| Namibia | 2023 | 28.30 |
| Sweden | 2024 | 27.95 |
| Cambodia | 2023 | 27.84 |
| Estonia | 2024 | 27.49 |
| Lao PDR | 2023 | 26.34 |
| Botswana | 2023 | 25.88 |
| South Sudan | 2023 | 25.69 |
| Lithuania | 2024 | 23.50 |
| Chile | 2024 | 22.85 |
| Austria | 2024 | 21.37 |
| India | 2023 | 19.55 |
| Portugal | 2024 | 18.88 |
| Thailand | 2023 | 18.79 |
| Bosnia and Herzegovina | 2023 | 18.74 |
| Moldova | 2023 | 17.13 |
| Philippines | 2023 | 17.11 |
| Croatia | 2023 | 16.97 |
| Bangladesh | 2023 | 15.58 |
| Switzerland | 2024 | 14.01 |
| Montenegro | 2023 | 13.93 |
| Albania | 2023 | 13.41 |
| Luxembourg | 2024 | 13.40 |
| Romania | 2023 | 13.32 |
| Germany | 2024 | 12.93 |
| Colombia | 2024 | 12.92 |
| Poland | 2024 | 12.88 |
| Peru | 2023 | 12.76 |
| Czechia | 2024 | 12.35 |
| Bolivia | 2023 | 11.41 |
| Kosovo | 2014 | 11.37 |
| Indonesia | 2023 | 11.04 |
| Slovak Republic | 2024 | 10.84 |
| Italy | 2024 | 10.79 |
| Serbia | 2023 | 10.75 |
| Hungary | 2024 | 10.73 |
| Slovenia | 2024 | 10.72 |
| Tunisia | 2023 | 10.15 |
| United Kingdom | 2024 | 10.06 |
| Bulgaria | 2023 | 9.67 |
| Viet Nam | 2023 | 9.10 |
| El Salvador | 2023 | 9.10 |
| Mauritius | 2023 | 9.01 |
| France | 2024 | 8.89 |
| Norway | 2024 | 8.26 |
| Lebanon | 2023 | 7.89 |
| Netherlands | 2024 | 7.86 |
| North Macedonia | 2023 | 7.84 |
| Costa Rica | 2024 | 7.81 |
| Dominican Republic | 2023 | 7.76 |
| Belgium | 2024 | 7.47 |
| Spain | 2024 | 7.35 |
| Ireland | 2024 | 7.29 |
| Greece | 2024 | 6.71 |
| Jamaica | 2023 | 6.67 |
| Belarus | 2023 | 6.64 |
| Panama | 2023 | 6.55 |
| Cuba | 2023 | 6.52 |
| Ukraine | 2023 | 6.51 |
| Korea, Dem. People's Rep. | 2023 | 6.46 |
| Cyprus | 2023 | 6.39 |
| Morocco | 2023 | 5.59 |
| New Zealand | 2024 | 5.24 |
| United States | 2024 | 4.92 |
| Argentina | 2024 | 4.90 |
| Equatorial Guinea | 2023 | 4.82 |
| Japan | 2024 | 4.74 |
| Canada | 2024 | 4.66 |
| Mexico | 2024 | 4.19 |
| Georgia | 2023 | 3.67 |
| South Africa | 2023 | 3.65 |
| Turkiye | 2024 | 3.51 |
| Australia | 2024 | 3.47 |
| Libya | 2023 | 3.23 |
| Egypt, Arab Rep. | 2023 | 3.17 |
| China | 2023 | 3.16 |
| Armenia | 2023 | 2.84 |
| Ecuador | 2023 | 2.78 |
| Korea, Rep. | 2024 | 2.47 |
| Yemen, Rep. | 2023 | 2.34 |
| Mongolia | 2023 | 2.27 |
| Malta | 2023 | 2.23 |
| Singapore | 2023 | 2.21 |
| Suriname | 2023 | 2.09 |
| Malaysia | 2023 | 1.63 |
| Hong Kong SAR, China | 2023 | 1.46 |
| Russian Federation | 2023 | 1.33 |
| Jordan | 2023 | 1.14 |
| Venezuela, RB | 2023 | 0.95 |
| Azerbaijan | 2023 | 0.56 |
| Israel | 2024 | 0.42 |
| Iceland | 2024 | 0.32 |
| Iran, Islamic Rep. | 2023 | 0.19 |
| Syrian Arab Republic | 2023 | 0.09 |
| Trinidad and Tobago | 2023 | 0.09 |
| Iraq | 2023 | 0.08 |
| Kazakhstan | 2023 | 0.06 |
| Kyrgyz Republic | 2023 | 0.05 |
| United Arab Emirates | 2023 | 0.04 |
| Kuwait | 2023 | 0.03 |
| Turkmenistan | 2023 | 0.03 |
| Algeria | 2023 | 0.01 |
| Qatar | 2023 | 0.01 |
| Uzbekistan | 2023 | 0.00 |
| Saudi Arabia | 2023 | 0.00 |
| Bahrain | 2023 | 0.00 |
| Brunei Darussalam | 2015 | 0.00 |
| Gibraltar | 2015 | 0.00 |
| Oman | 2015 | 0.00 |
| Tajikistan | 2015 | 0.00 |
Source and appropriate use
The values come from World Bank World Development Indicators series EG.USE.CRNW.ZS. The official definition, methodology and limitations are available in the World Bank DataBank metadata, and the country series can be explored on the World Bank Data indicator page. The metadata identifies the International Energy Agency’s Energy Statistics Data Browser as the underlying source.
This cross-country comparison is useful for locating large contrasts, identifying high-share regions and checking how recent each economy’s latest observation is. It is not enough to determine whether biomass use is traditional or modern, whether waste is recovered efficiently, or whether a country’s energy system is low-carbon overall. Those questions require additional technology, fuel, emissions and time-series data.
Frequently Asked Questions
What does combustible renewables and waste share measure?
It is the share of total energy supply from solid and liquid biomass, biogas, industrial waste and municipal waste.
Is this the same as modern renewable energy share?
No. The series includes combustible biomass and waste, including traditional forms, and it uses total energy supply rather than electricity generation.
Are all 149 observations from 2024?
No. There are 41 observations from 2024, 103 from 2023, four from 2015 and one from 2014.
Which economy has the highest latest observation?
The Democratic Republic of the Congo has the highest latest value at 94.43% in 2023.
Related Articles
Green Map creates custom-edited map images using open geographic data sources such as geoBoundaries, Natural Earth, OpenStreetMap, and government open data. These maps are edited visual materials, not raw data files, and are provided for education, documents, presentations, and graphic reference.