World Bank indicator EG.USE.PCAP.KG.OE provides a latest non-empty energy-use-per-capita observation for 179 countries and territories. 41 observations are from 2024 and 108 from 2023; the remaining 30 are older observations from 1990, 2007, or 2014. The unweighted mean is 2,013 kg of oil equivalent per person and the median 1,250. Qatar has the highest latest observation at 16,343 kg oe in 2023, while Iceland leads the 2024 subset at 15,997.
This indicator is not household electricity or fuel consumption. The World Bank defines energy use as primary energy use before transformation into other end-use fuels: indigenous production plus imports and stock changes, minus exports and fuels supplied to international ships and aircraft. The result is converted into oil-equivalent units and divided by population.
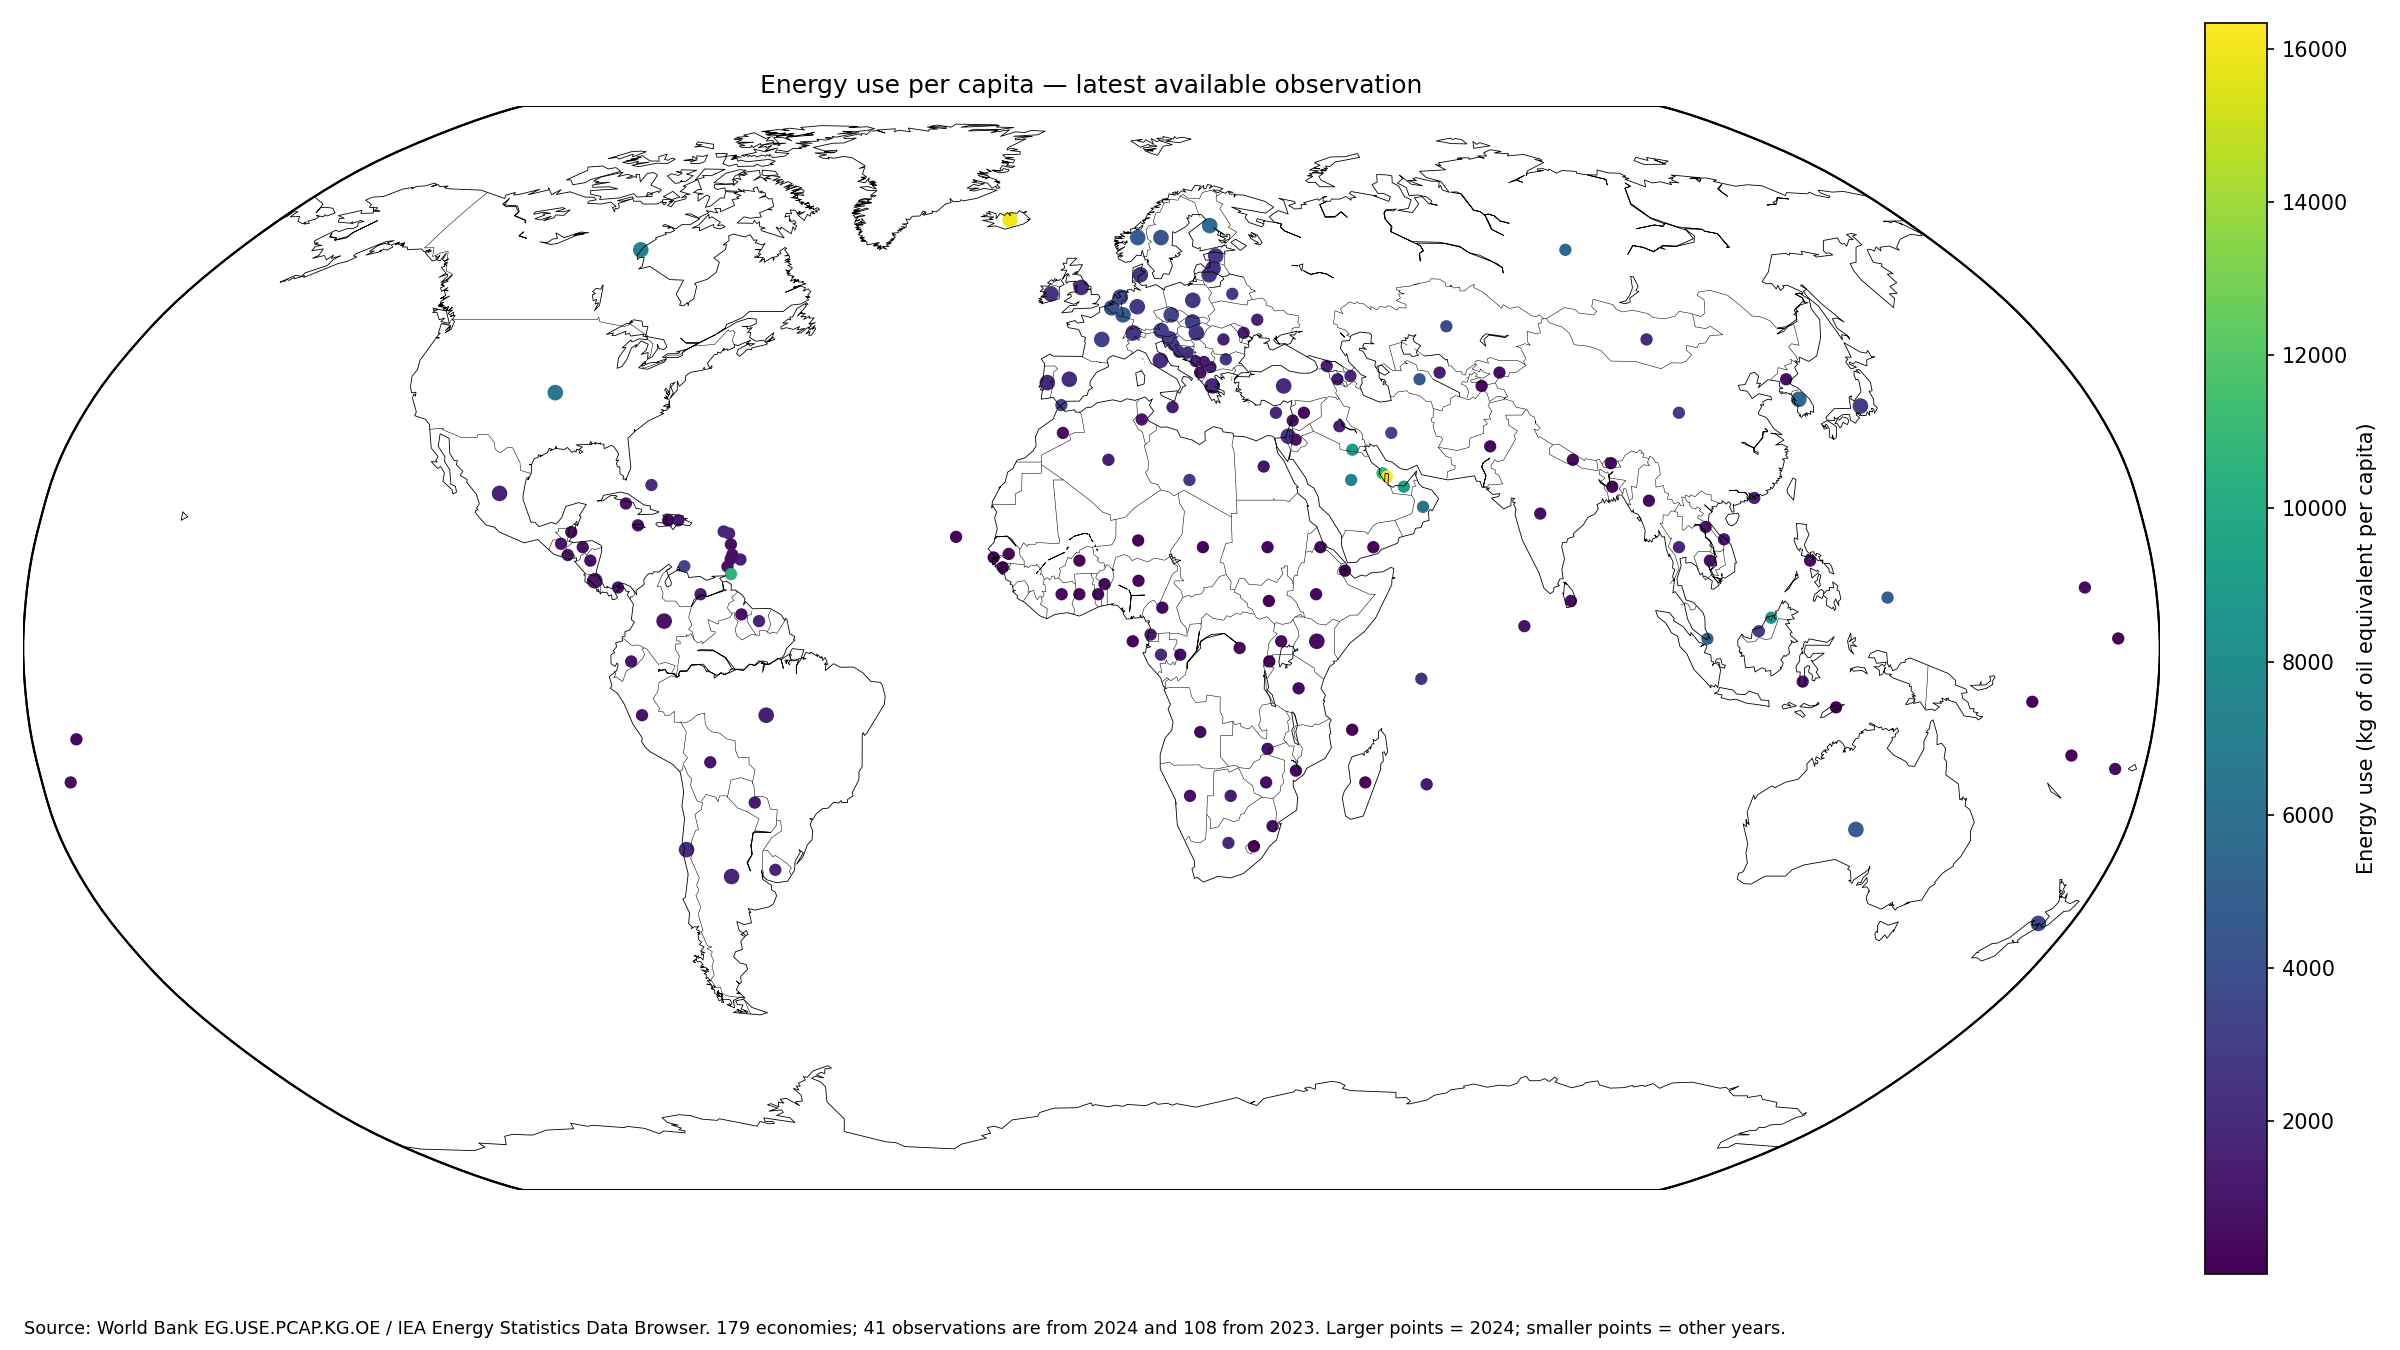
Table of Contents
What kilograms of oil equivalent per capita means
Kilograms of oil equivalent provide a common energy unit for fuels and primary electricity that otherwise use very different physical units. Coal, petroleum, gas, nuclear, hydro, renewable energy, and combustible waste can therefore be expressed on one comparable energy basis. One thousand kilograms of oil equivalent corresponds to one tonne of oil equivalent.
The World Bank metadata glossary defines the measure as primary energy use before transformation. The World Bank API provides the country observations, sourced from the International Energy Agency Energy Statistics Data Browser.
This is not final electricity consumption
Primary energy accounting includes energy before conversion into electricity and refined fuels. That means conversion losses and the energy system itself matter, making the measure different from electricity consumption per capita.
It also covers the economy as a whole rather than only households. Industry, transport, commercial activity, public services, energy production, and other uses can all contribute to a country’s primary-energy total.
Qatar has the highest latest observation
Qatar records about 16,343 kg oe per person, followed by Iceland at 15,997, Trinidad and Tobago at 10,590, Bahrain at 10,512, the United Arab Emirates at 9,140, and Kuwait at 8,952. Brunei Darussalam, Canada, Saudi Arabia, and the United States are also among the highest values.
The years differ. Qatar, Trinidad and Tobago, Bahrain, the United Arab Emirates, Kuwait, and Brunei Darussalam are 2023 observations, while Iceland, Canada, and the United States are 2024. The full latest-value table is therefore not a single-year ranking.
| Rank | Country or territory | Observation year | Energy use per capita (kg oe) |
|---|---|---|---|
| 1 | Qatar | 2023 | 16,343 |
| 2 | Iceland | 2024 | 15,997 |
| 3 | Trinidad and Tobago | 2023 | 10,590 |
| 4 | Bahrain | 2023 | 10,512 |
| 5 | United Arab Emirates | 2023 | 9,140 |
| 6 | Kuwait | 2023 | 8,952 |
| 7 | Brunei Darussalam | 2023 | 8,658 |
| 8 | Canada | 2024 | 7,161 |
| 9 | Saudi Arabia | 2023 | 7,149 |
| 10 | United States | 2024 | 6,361 |
| 11 | Oman | 2023 | 5,908 |
| 12 | Finland | 2024 | 5,614 |
| 13 | Russian Federation | 2023 | 5,498 |
| 14 | Singapore | 2023 | 5,283 |
| 15 | Palau | 1990 | 4,814 |
The 2024 subset covers 41 economies
Restricting the data to 2024 leaves 41 economies. Iceland leads at 15,997 kg oe, followed by Canada at 7,161, the United States at 6,361, Finland at 5,614, and Norway at 4,775 after excluding the country-specific example omitted from public emphasis.
| 2024 rank | Country or territory | Energy use per capita (kg oe) |
|---|---|---|
| 1 | Iceland | 15,997 |
| 2 | Canada | 7,161 |
| 3 | United States | 6,361 |
| 4 | Finland | 5,614 |
| 5 | Norway | 4,775 |
| 6 | Australia | 4,751 |
| 7 | Luxembourg | 4,552 |
| 8 | Sweden | 4,308 |
| 9 | Belgium | 4,078 |
| 10 | New Zealand | 3,557 |
| 11 | Czechia | 3,416 |
| 12 | Netherlands | 3,416 |
| 13 | Austria | 3,242 |
| 14 | France | 3,185 |
| 15 | Slovenia | 3,025 |
The 2024 subset has an unweighted mean of 3,315 kg oe and a median of 2,647. The first quartile is 2,069 and the third quartile 3,557. 5 economies are at 5,000 kg oe or more and 2 are below 1,000.
The 2023 subset has wider coverage
The 2023 subset contains 108 economies, with an unweighted mean of 1,854 kg oe and a median of 942. Several oil- and gas-producing or energy-intensive economies appear at the upper end, including Qatar, Trinidad and Tobago, Bahrain, the United Arab Emirates, Kuwait, Brunei Darussalam, Saudi Arabia, and Oman.
The lower 2023 mean does not show that world energy use fell from 2023 to 2024. The two subsets contain different countries. Year-to-year change requires comparing the same economies over time rather than comparing two changing cross-sections.
Many of the lowest latest values are old
Lesotho records about 10 kg oe, Timor-Leste 61, Guinea-Bissau 65, Comoros 66, and The Gambia 75. Several of those values are from 2007 rather than recent years. South Sudan’s 69 kg oe value, by contrast, is from 2023.
30 of the 179 latest observations are from 2014 or earlier, including 28 from 2007. A last available value can still be useful for coverage, but it should not be presented as a current level.
| Low-end rank | Country or territory | Observation year | Energy use per capita (kg oe) |
|---|---|---|---|
| 1 | Lesotho | 2007 | 10 |
| 2 | Timor-Leste | 2007 | 61 |
| 3 | Guinea-Bissau | 2007 | 65 |
| 4 | Comoros | 2007 | 66 |
| 5 | South Sudan | 2023 | 69 |
| 6 | Gambia, The | 2007 | 75 |
| 7 | Kiribati | 2007 | 108 |
| 8 | Solomon Islands | 2007 | 128 |
| 9 | Yemen, Rep. | 2023 | 155 |
| 10 | Vanuatu | 2007 | 158 |
| 11 | Niger | 2023 | 161 |
| 12 | Djibouti | 2007 | 164 |
| 13 | Chad | 2023 | 188 |
| 14 | Cabo Verde | 2007 | 208 |
| 15 | Sao Tome and Principe | 2007 | 259 |
The median is about 1,250 kg oe per person
The median of the 179 latest observations is 1,250 kg oe, with a first quartile of 541 and third quartile of 2,497. 44 observations are below 500 kg oe, 37 are from 500 to under 1,000, 53 from 1,000 to under 2,500, 30 from 2,500 to under 5,000, and 15 are at least 5,000.
The simple mean of 2,013 kg oe is well above the median because a relatively small group of very high-use economies creates a long upper tail. The median and distribution bands better describe the typical country observation.
High energy use does not automatically mean low efficiency
Per-capita energy use is a quantity measure, not an efficiency score. Climate, geography, industrial structure, energy-intensive manufacturing, oil and gas production, transport distances, and income can all affect the amount of primary energy used per person.
Energy intensity, such as energy use per unit of PPP GDP, is more appropriate when the question is how much energy is required to generate economic output.
High use does not directly measure living standards
Energy use and income can be related, but the indicator is not a welfare measure. Cold climates, heavy industry, refining, mining, and energy exports can raise primary-energy use independently of household consumption.
GDP or GNI per capita, household consumption, electricity access, housing, and other social indicators are needed to evaluate material living standards. This series measures economy-wide primary energy relative to population.
Total energy use is different from the fossil-fuel share
This series measures how much primary energy is used, while fossil-fuel share indicators describe the composition of that energy. Two countries can have similar per-capita energy use with very different mixes of fossil, nuclear, hydro, and renewable energy.
For the same reason, the indicator cannot by itself determine carbon emissions. Emissions depend on the fuel mix, technologies, conversion efficiency, and non-energy industrial processes.
Hydro and nuclear electricity are converted to oil equivalents
World Bank methodology converts different energy forms into oil-equivalent units. The metadata notes a notional 33% thermal efficiency when converting nuclear electricity and 100% efficiency for hydroelectric power.
A value of 5,000 kg oe therefore does not mean that a person literally consumed 5,000 kilograms of petroleum. Oil equivalent is a standardized energy-accounting unit.
Per capita and total energy use answer different questions
Large-population economies can have very high total energy use but moderate per-capita values. Small energy-producing economies can have much smaller total use while still recording very high per-capita values.
Total energy-use series measured in kilotonnes of oil equivalent are better for market size and aggregate energy demand. The per-capita series removes population scale to show energy use relative to the number of people.
The country mean is not the population-weighted world average
The 2,013 kg oe simple mean gives each of the 179 economies equal weight. A country with hundreds of millions of people and a small island economy each count once. It is not the average energy use of the world’s population.
A true world per-capita average would require weighting by population or dividing total global energy use by total population. The mean and median here summarize the distribution of country values.
Source and calculation notes
The source is World Bank World Development Indicators series EG.USE.PCAP.KG.OE, based on International Energy Agency energy statistics. The analysis uses the latest non-empty observation for 179 economies and separately reviews the 41 observations from 2024 and 108 from 2023. The official World Bank API provides the series.
All 179 reported country codes are joined to geographic centroids for the map, producing a 100% match. Larger points mark 2024 observations and smaller points other years. Missing economies are not converted to zero.
Frequently Asked Questions
Is energy use per capita the same as household electricity or fuel consumption?
No. It measures economy-wide primary energy use per person, including industry, transport, energy transformation, and other sectors.
Does kg of oil equivalent mean actual petroleum consumption?
No. It is a common energy unit used to convert different fuels and primary electricity onto one comparable basis.
Are all 179 observations from 2024?
No. 41 are from 2024, 108 from 2023, and 30 are older observations.
Related Articles
Green Map creates custom-edited map images using open geographic data sources such as geoBoundaries, Natural Earth, OpenStreetMap, and government open data. These maps are edited visual materials, not raw data files, and are provided for education, documents, presentations, and graphic reference.