World Bank indicator NY.ADJ.DMIN.GN.ZS reports mineral depletion as a share of GNI for 209 countries and territories with latest non-empty observations. 187 observations are from 2021 and the rest range from 1985 to 2020. The unweighted mean is 1.19% and the median is 0.00%. Exactly 115 observations are zero. The highest values are the Democratic Republic of the Congo at 22.66% and Zambia at 21.02%.
The indicator is not tonnes mined, mine output, or mineral exports. The World Bank estimates the economic value of depletion from mineral-resource stocks and remaining reserve lifetime, then expresses the result as a share of GNI. Covered resources include tin, gold, lead, zinc, iron, copper, nickel, silver, bauxite, and phosphate.
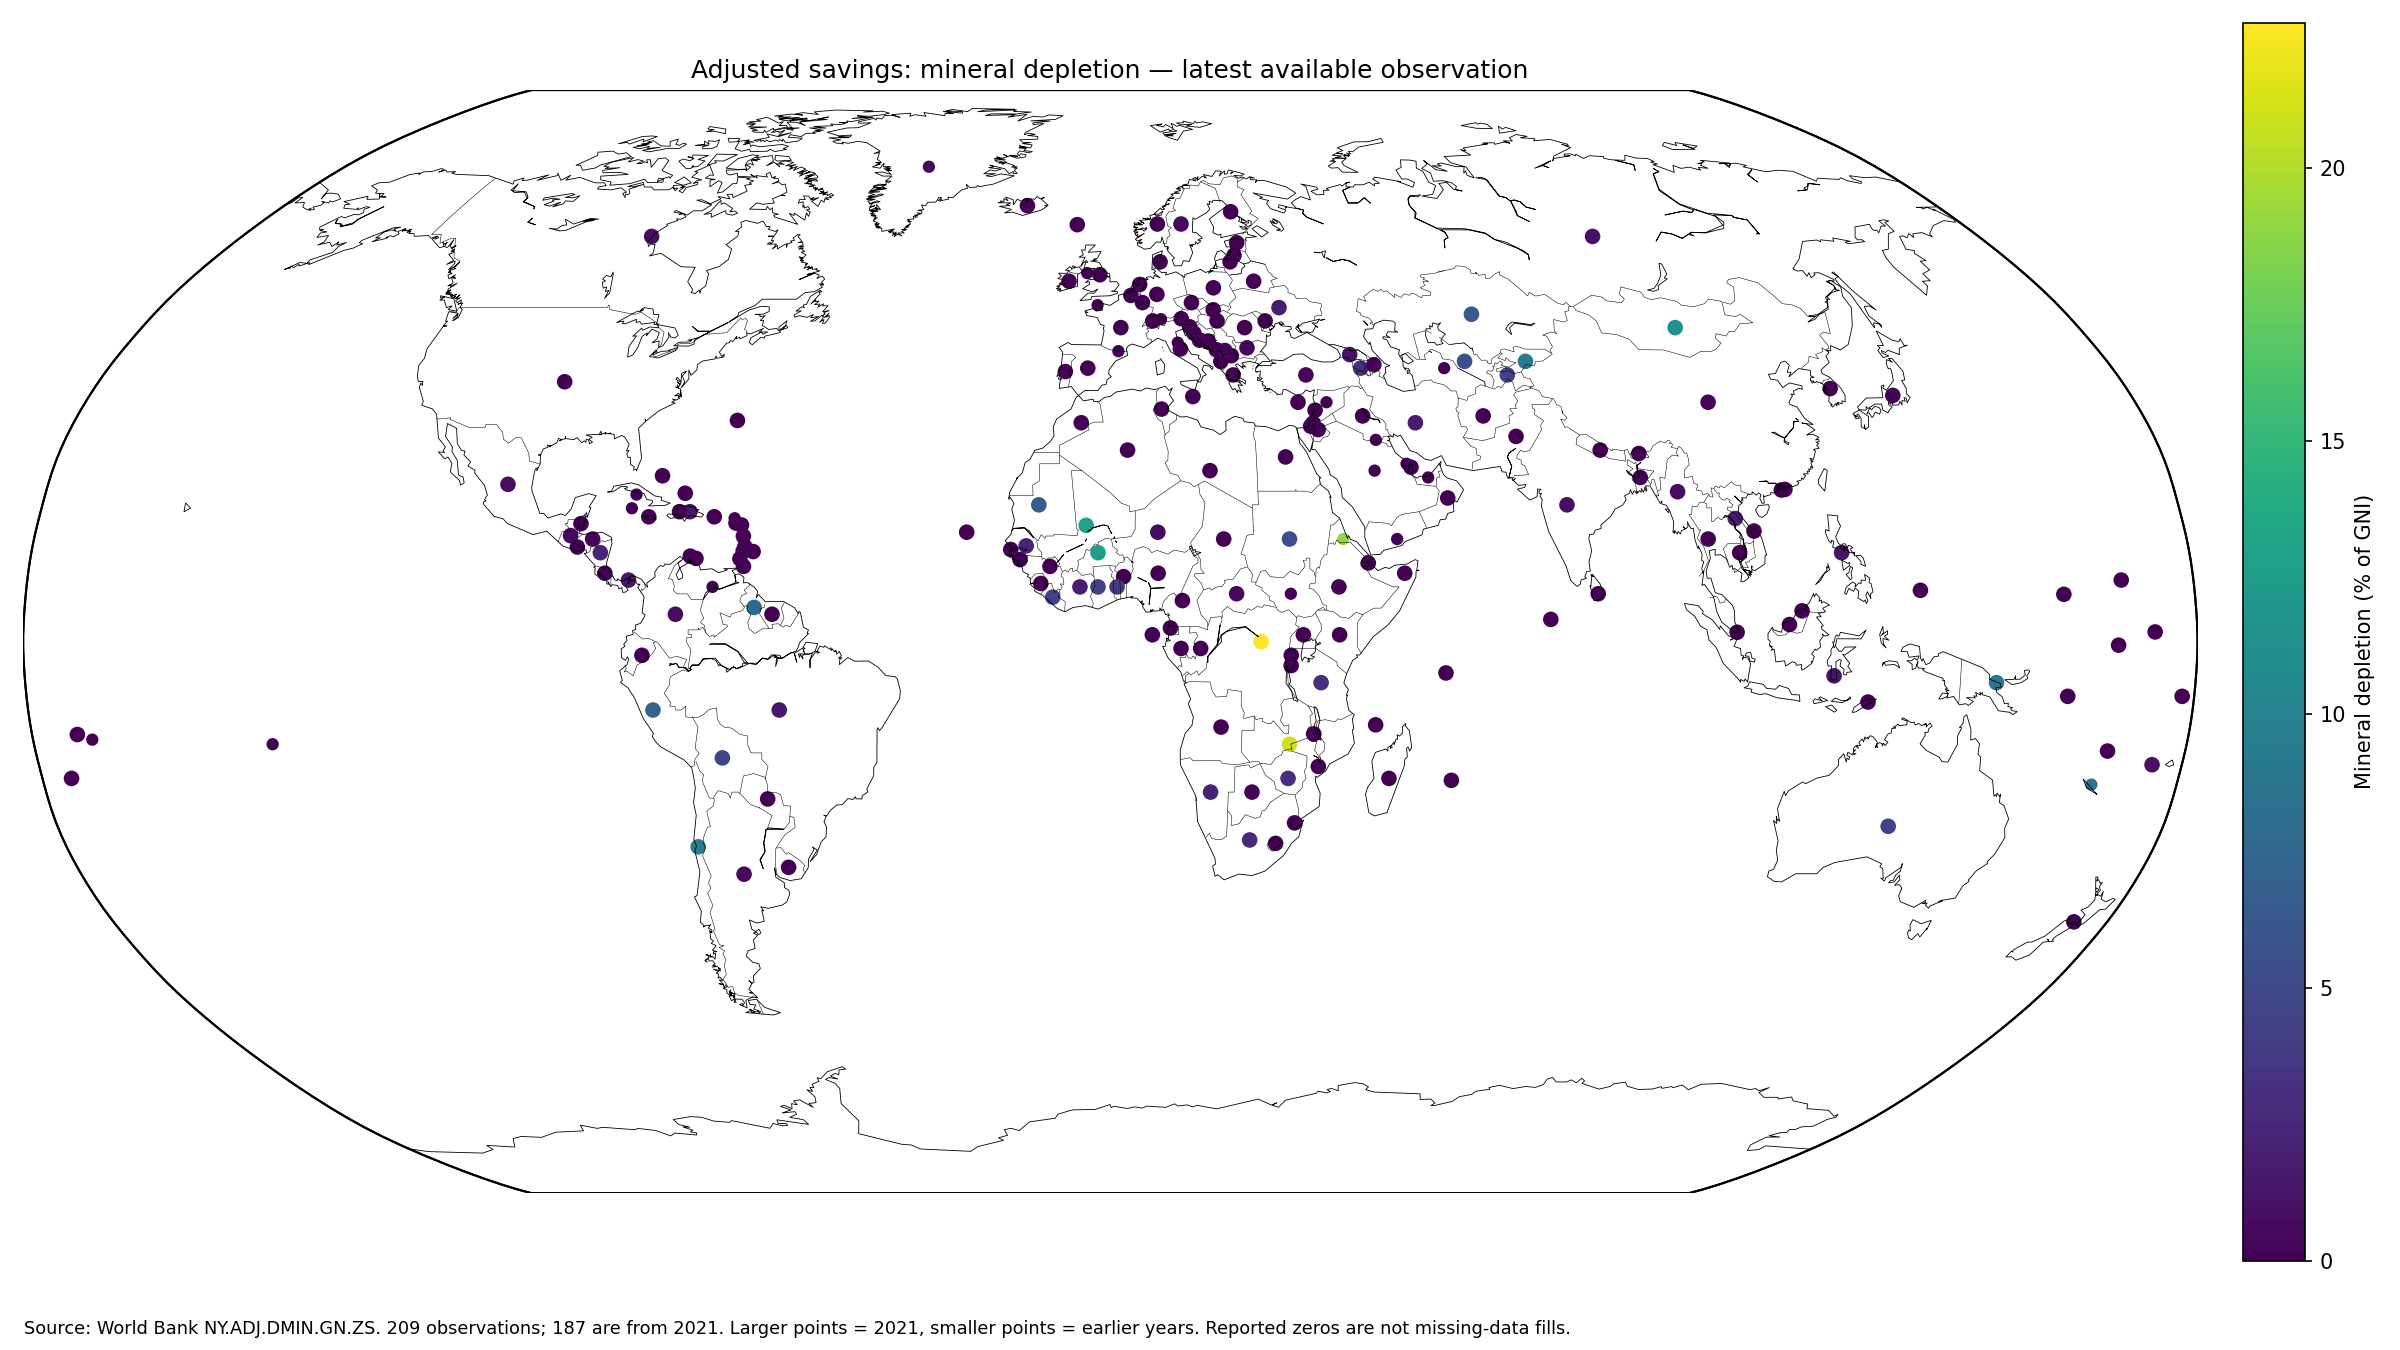
Table of Contents
Mineral depletion is not physical mining output
A country can mine large quantities without automatically having a high depletion-to-GNI ratio. The measure combines the economic value of mineral-resource stocks, remaining reserve life, and national income. Changes in prices, reserve estimates, extraction, or GNI can all affect the percentage.
The World Bank metadata defines mineral depletion as the value of mineral-resource stocks divided by remaining reserve lifetime, capped at 25 years. The official API provides country observations.
The upper tail reaches above 20%
The Democratic Republic of the Congo records 22.66%, Zambia 21.02%, Eritrea 19.00%, Mali 13.15%, Burkina Faso 12.62%, and Mongolia 11.51%.
Observation year is critical. Eritrea is a 2011 observation and New Caledonia a 2000 observation. A high latest value is not the same as a recent observation, so the year belongs beside every percentage.
| Rank | Country or territory | Observation year | Mineral depletion/GNI |
|---|---|---|---|
| 1 | Congo, Dem. Rep. | 2021 | 22.66% |
| 2 | Zambia | 2021 | 21.02% |
| 3 | Eritrea | 2011 | 19.00% |
| 4 | Mali | 2021 | 13.15% |
| 5 | Burkina Faso | 2021 | 12.62% |
| 6 | Mongolia | 2021 | 11.51% |
| 7 | Chile | 2021 | 9.41% |
| 8 | Kyrgyz Republic | 2021 | 9.22% |
| 9 | Papua New Guinea | 2021 | 9.15% |
| 10 | New Caledonia | 2000 | 8.54% |
| 11 | Guyana | 2021 | 7.64% |
| 12 | Peru | 2021 | 7.22% |
| 13 | Mauritania | 2021 | 6.61% |
| 14 | Kazakhstan | 2021 | 6.51% |
| 15 | Uzbekistan | 2021 | 5.54% |
A same-year 2021 comparison covers 187 economies
Restricting the data to 2021 leaves 187 economies. The Democratic Republic of the Congo leads at 22.66%, followed by Zambia at 21.02%, Mali at 13.15%, Burkina Faso at 12.62%, and Mongolia at 11.51%.
| 2021 rank | Country or territory | Mineral depletion/GNI |
|---|---|---|
| 1 | Congo, Dem. Rep. | 22.66% |
| 2 | Zambia | 21.02% |
| 3 | Mali | 13.15% |
| 4 | Burkina Faso | 12.62% |
| 5 | Mongolia | 11.51% |
| 6 | Chile | 9.41% |
| 7 | Kyrgyz Republic | 9.22% |
| 8 | Papua New Guinea | 9.15% |
| 9 | Guyana | 7.64% |
| 10 | Peru | 7.22% |
| 11 | Mauritania | 6.61% |
| 12 | Kazakhstan | 6.51% |
| 13 | Uzbekistan | 5.54% |
| 14 | Sudan | 5.35% |
| 15 | Bolivia | 4.65% |
The 2021 subset improves time comparability but drops economies whose latest observation is older. The 209-economy view maximizes coverage but mixes years. They answer different questions and should remain separate.
Reported zeros dominate the center
Exactly 115 observations are zero, so the median and first quartile are both zero. Expanding the threshold to below 0.1% covers 143 economies. Most of the distribution sits at zero or very small values while a small high-value group creates a long upper tail.
A reported zero is not a missing value filled with zero. Every row used here contains a number. But zero also does not prove that mining or mineral resources are absent. It only describes this specific depletion estimate relative to GNI.
Tiny positive values should remain positive
The United Kingdom records 0.000045%, Malawi 0.000471%, Algeria 0.002984%, Kenya 0.004455%, and Japan 0.005379%. These values are small enough to disappear under coarse rounding, but they are not zeros.
| Low positive rank | Country or territory | Observation year | Mineral depletion/GNI |
|---|---|---|---|
| 1 | United Kingdom | 2021 | 0.0000% |
| 2 | Malawi | 2021 | 0.0005% |
| 3 | Algeria | 2021 | 0.0030% |
| 4 | Kenya | 2021 | 0.0045% |
| 5 | Japan | 2021 | 0.0054% |
| 6 | Bhutan | 2021 | 0.0065% |
| 7 | Nigeria | 2021 | 0.0068% |
| 8 | Slovak Republic | 2021 | 0.0092% |
| 9 | Cyprus | 2021 | 0.0101% |
| 10 | Uruguay | 2021 | 0.0103% |
| 11 | Montenegro | 2021 | 0.0109% |
| 12 | South Sudan | 2015 | 0.0117% |
Reported zero, tiny positive values, and no data are three different statistical states. A useful map should preserve that distinction.
The 1.19% mean is not a typical country
The simple mean is 1.19% while the median is zero. There are 143 observations below 0.1%, 27 from 0.1% to under 1%, 23 from 1% to under 5%, 10 from 5% to under 10%, and only 6 at 10% or more.
The first quartile is 0.00% and the third quartile 0.46%. The distribution is strongly concentrated near zero, so the mean is pulled upward by a relatively small number of mineral-dependent economies.
The GNI denominator matters
The same estimated depletion value produces a higher percentage in a lower-GNI economy and a lower percentage in a higher-GNI economy. The indicator is therefore not a ranking of absolute depletion dollars.
Two countries with the same ratio also need not have the same mineral output or reserves. The numerator and denominator combine different economic quantities, making this best interpreted as the relative economic scale of mineral-asset depletion.
Mineral depletion inside adjusted savings
In the World Bank adjusted net savings framework, net national saving is combined with education spending and deductions for energy depletion, mineral depletion, forest depletion, and certain environmental damages. This series isolates the mineral component.
A high mineral-depletion percentage does not automatically make adjusted net savings negative. Other savings, education, resource-depletion, and damage components also matter. The indicator is one building block, not a complete sustainability score.
Mineral rents and mineral depletion are different
Mineral rents measure economic rents from extraction relative to GDP. Mineral depletion estimates loss of resource assets within adjusted-savings accounting and is scaled to GNI. Their accounting purposes, numerators, and denominators differ.
A country can rank highly on mineral rents without occupying the same position in mineral depletion. Prices, production, reserve life, stock valuation, and the difference between GDP and GNI all affect the relationship.
Older latest observations are not current values
193 observations are from 2020–2021 and 16 are from 2019 or earlier. The oldest latest observation is from 1985. An old value is still the last non-empty World Bank observation, but it is not a current measurement.
This is especially important for high older observations such as Eritrea in 2011 and New Caledonia in 2000. A strict recent-period comparison is better served by the 2021 subset, while the full set is useful for broader geographic coverage.
Source and calculation notes
The source is World Bank World Development Indicators series NY.ADJ.DMIN.GN.ZS. The analysis uses the latest non-empty observation for 209 economies and calculates distribution statistics and rankings directly. The official World Bank API provides the series.
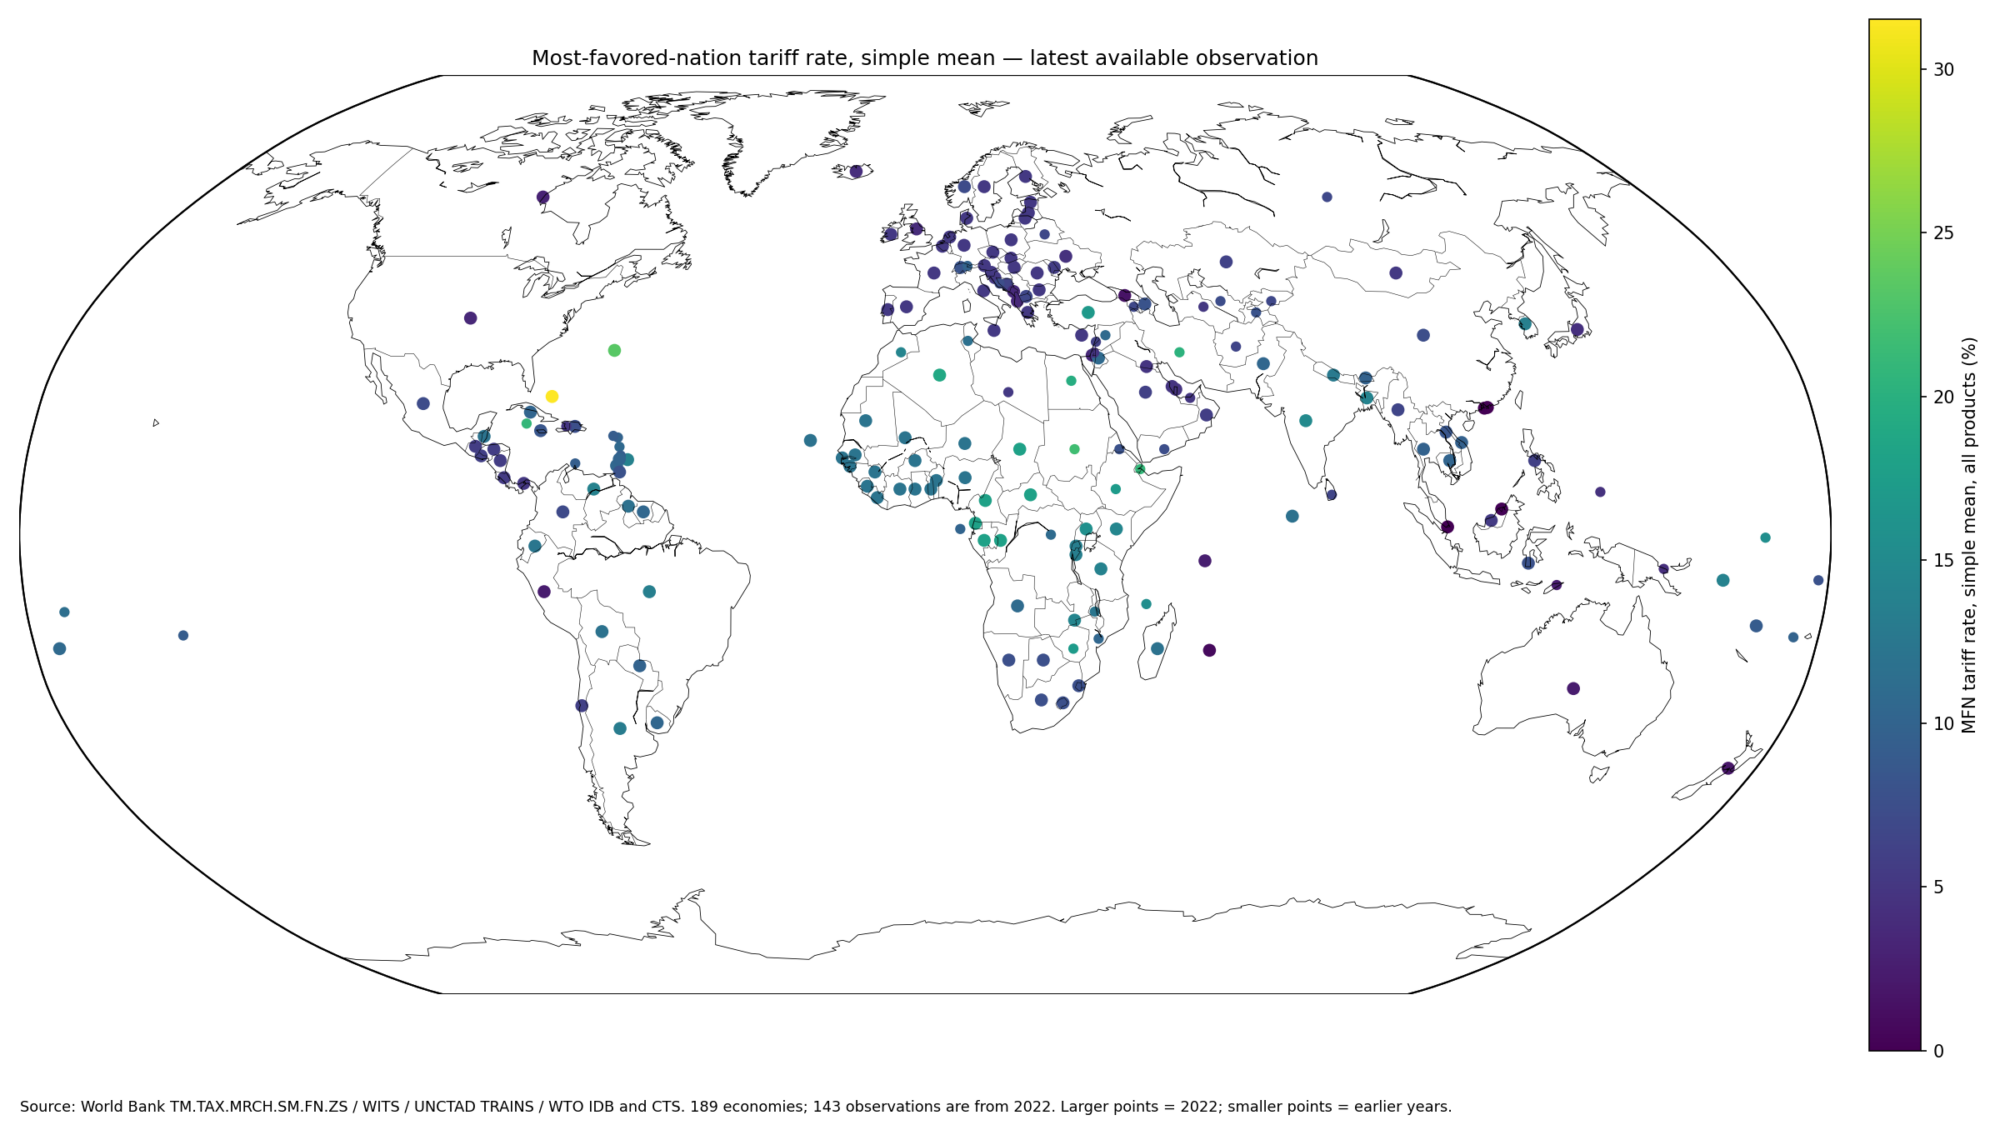
All 209 reported country codes are mapped to geographic centroids. Larger points mark 2021 and smaller points earlier observations. Missing economies are not converted to zero.
Frequently Asked Questions
Does mineral depletion measure physical mining output?
No. It estimates the economic value of mineral-resource depletion and expresses it as a share of GNI.
Does 0% mean a country has no mining or minerals?
No. It means this specific World Bank depletion estimate is zero relative to GNI.
Are all 209 observations from 2021?
No. 187 are from 2021 and the remainder are older. Use the 2021 subset for a strict same-year comparison.
Related Articles
Green Map creates custom-edited map images using open geographic data sources such as geoBoundaries, Natural Earth, OpenStreetMap, and government open data. These maps are edited visual materials, not raw data files, and are provided for education, documents, presentations, and graphic reference.