World Bank data for 2024 provide a gross-savings-to-GNI value for 146 countries and separately reported economies. The indicator is a national-accounts ratio: it compares gross saving for the economy as a whole with gross national income. It is not a household bank-deposit rate, a government budget balance, or a measure of how much cash corporations hold. Those concepts can move differently because they cover different institutional sectors and accounting definitions.
The median reported value is 22.54% of GNI and the simple unweighted mean is 22.89%. Singapore has the highest observation at 48.93%, followed by Macao at 48.40%, Ireland at 46.40%, Brunei Darussalam at 46.18%, and China at 43.01%. Timor-Leste is at -18.53% and Malawi at -2.02%; the next lowest positive observations include Solomon Islands at 1.08%, Mozambique at 1.92%, and Seychelles at 2.62%.
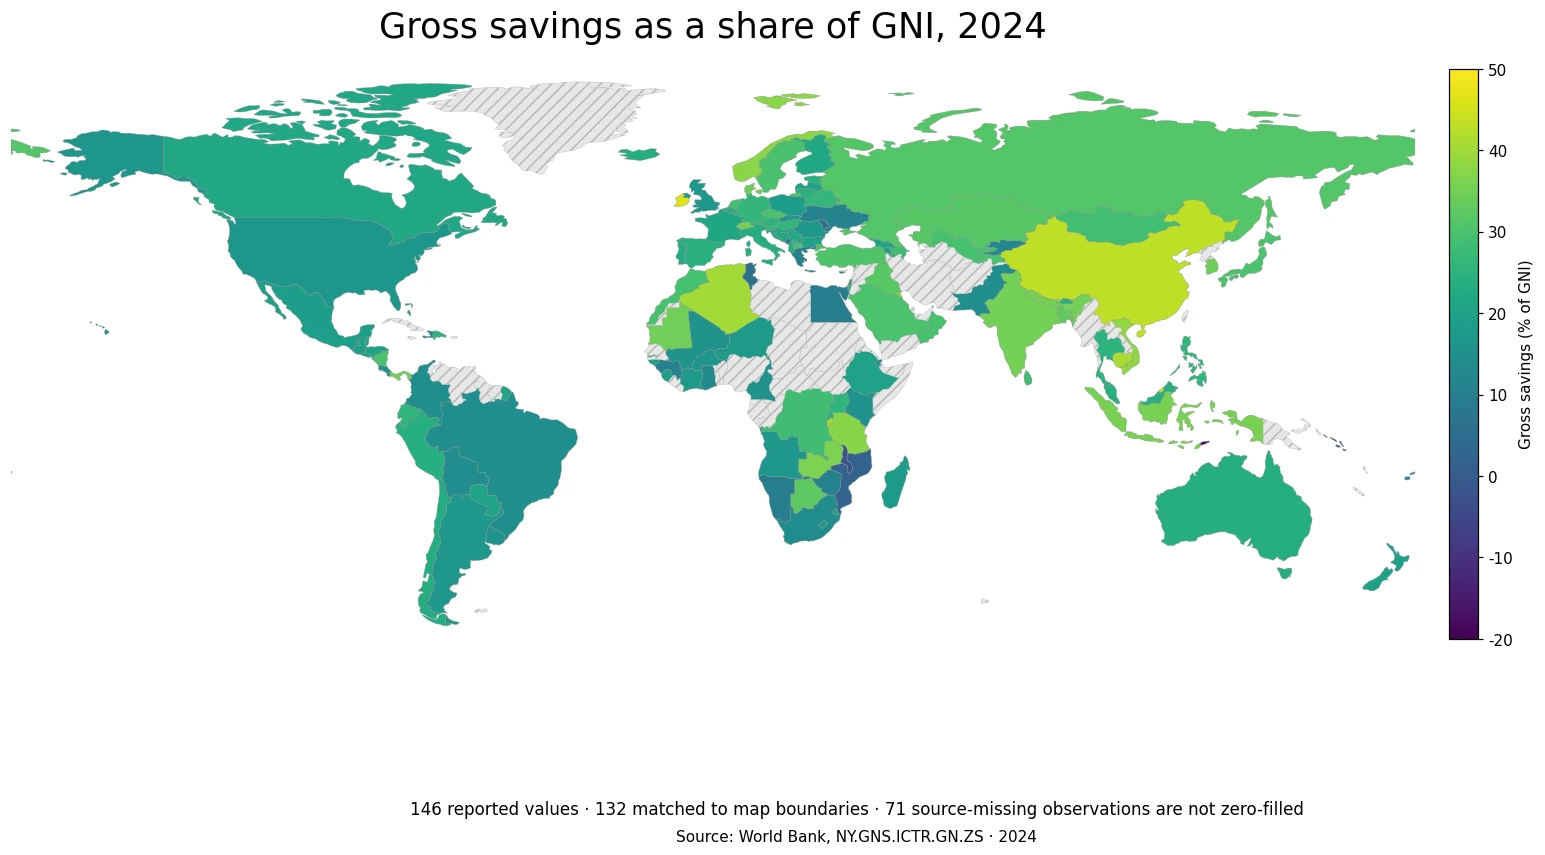
Table of Contents
Gross savings is broader than household saving
The first interpretation step is to keep the accounting unit straight. Gross savings covers the economy rather than households alone. Household behavior matters, but so do retained corporate income and the saving position of government and other sectors. A country can therefore have a high national gross-saving ratio without every household saving a large share of disposable income. Conversely, a low national ratio cannot be translated directly into a statement about personal financial habits.
The denominator is GNI, not GDP. GNI adjusts domestic production for primary income flows with the rest of the world. That matters in economies where cross-border wages, investment income, or multinational-company earnings are large. A gross-savings share of GNI should therefore not be assumed to equal a domestic-savings share of GDP or any other nearby savings indicator.
The center of the distribution is in the low twenties
Only 8 reported economies are at or above 40%, while 32 are at or above 30%. The first quartile is 16.89% and the third quartile is 29.62%, which means half of all reported observations fall within that band. The median of 22.54% is much closer to 20% than to the 40%-plus values that dominate the top of the ranking.
Looking at broader bands, 13 economies are below 10%, 46 are between 10% and 20%, 55 are between 20% and 30%, and 24 are between 30% and 40%. These counts make clear that a top-ten table is not representative of the typical observation. The map is most useful when the extremes are read alongside the middle of the distribution.
| Economy | Gross savings (% of GNI), 2024 |
|---|---|
| Singapore | 48.93% |
| Macao SAR, China | 48.40% |
| Ireland | 46.40% |
| Brunei Darussalam | 46.18% |
| China | 43.01% |
| Burundi | 40.93% |
| Cambodia | 40.85% |
| Algeria | 40.18% |
| Viet Nam | 38.30% |
| Norway | 37.48% |
East and Southeast Asia contain several high observations
Several of the highest ratios are in East or Southeast Asia: Singapore 48.93%, Macao 48.40%, China 43.01%, Cambodia 40.85%, Viet Nam 38.30%, Indonesia 35.61%, and India 35.20% are all above the global median of the reported set. The pattern is not uniform, however. The Philippines is at 25.79%, Thailand at 24.88%, and Malaysia at 24.21%, much closer to the middle.
The regional cluster does not establish a single causal explanation. High saving can reflect different combinations of household consumption, corporate income, public-sector balances, national income from abroad, and temporary cyclical conditions. Resource exporters and trade-oriented service economies can arrive at similar ratios through very different mechanisms, so the map should be treated as a comparison of outcomes rather than a causal model.
Europe shows large differences within the same region
Ireland records 46.40% and Norway 37.48%, while Germany is at 26.22%, France at 21.03%, and the United Kingdom at 16.92%. These gaps are large enough that a single European average would hide much of the cross-country variation. They also show why the ratio should not be reduced to a cultural description of thrift.
In economies with substantial multinational activity or cross-border investment income, both GNI and saving can be influenced by transactions that do not correspond to the everyday finances of a representative household. For questions about consumer behavior, household saving as a share of disposable income is the more direct indicator. The national gross-saving ratio answers a broader macroeconomic question.
African economies span both high and very low ratios
The African observations cover a wide range. Burundi is at 40.93%, Algeria at 40.18%, Tanzania at 37.40%, and Zambia at 36.08%. At the other end, Malawi is negative at -2.02%, Mozambique is 1.92%, Tunisia 5.60%, and Namibia 9.76%. The contrasts occur within the same continent and sometimes among nearby economies.
A high ratio is not the same as a high income level. A lower-income economy can save a large share of GNI while still having a much smaller income level per person than a high-income economy with a lower ratio. To compare prosperity, GNI per capita or other household-income and welfare measures are more appropriate. This map instead shows how large gross saving is relative to national income.
Negative values are observations, not missing data
There are 2 negative reported values in 2024: Timor-Leste at -18.53% and Malawi at -2.02%. A negative figure indicates negative gross saving in the national accounts for that year. It is not the same as a data gap. The 71 economies without a 2024 value are kept as missing and are excluded from averages and rankings.
A negative gross-saving ratio should also not be treated as a synonym for a government fiscal deficit, insolvency, or recession. Those are separate concepts with their own definitions and data. National gross saving combines sectors across the economy, while a fiscal balance focuses on government. The sign of this ratio is informative, but it does not by itself diagnose the condition of public finances or the business cycle.
| Economy | Gross savings (% of GNI), 2024 |
|---|---|
| Timor-Leste | -18.53% |
| Malawi | -2.02% |
| Solomon Islands | 1.08% |
| Mozambique | 1.92% |
| Seychelles | 2.62% |
| Tunisia | 5.60% |
| Moldova | 5.71% |
| West Bank and Gaza | 7.17% |
| Kiribati | 8.34% |
| Montenegro | 8.81% |
The Americas mostly sit in the middle of the reported range
Among large North American economies, the United States is at 16.78%, Canada at 21.67%, and Mexico at 18.95%. In South America, Brazil is 14.63%, Colombia 14.71%, Argentina 17.05%, Chile 23.02%, and Peru 24.02%. These values are generally well below the 40%-plus leaders but still cover a meaningful range.
Savings and investment are closely related in macroeconomic accounting, but this ratio is not an investment-rate measure. A country can finance investment partly through foreign saving, and international transactions affect the relationship between domestic saving and investment. Evaluating investment capacity therefore requires investment and external-balance data in addition to gross savings.
A percentage share does not reveal the absolute amount saved
A small economy with gross savings equal to 35% of GNI may save far less in currency terms than a large economy with a 20% ratio. The percentage answers a structural question about the share of national income, not the global amount of financial resources. Absolute gross-saving levels or underlying national-account values are needed when the question concerns size rather than proportion.
The same caution applies over time. A single year can be affected by swings in consumption, commodity prices, corporate profits, government spending, or cross-border income. One 2024 observation is useful for a current cross-section, but a structural assessment should add several years of history and compare the ratio with investment, current-account, and income-per-capita indicators.
Coverage and map geometry limit the visual comparison
The source table contains 217 country and separately reported economy rows, but only 146 have a 2024 observation. The remaining 71 are source-missing. Replacing them with zero would create observations that the source does not report, distort the distribution, and confuse “no data” with a true zero.
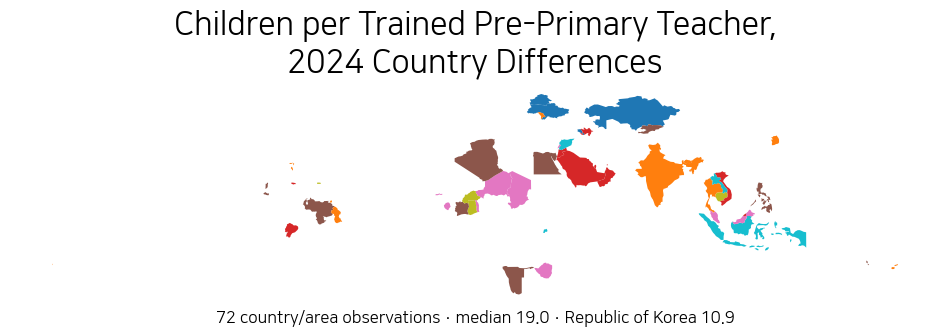
The simplified world boundary directly matches 132 of the 146 reported values, or 90.4%. Some small islands and separately reported areas, including Singapore, Macao, Bahrain, Marshall Islands, Samoa, and Malta, do not have an independent polygon in this low-resolution layer. Their values remain in every statistical calculation and table even when the map cannot shade them.
How to interpret the 2024 ratio
The most useful question is not “which country is wealthiest?” but “what share of gross national income was recorded as gross saving?” That keeps the indicator in its proper scope. Income level, household saving behavior, government finances, and investment each require different measures.
The 2024 distribution ranges from almost 49% to below zero, with a median near 22.5%. High ratios appear in several different regions and economic structures, while neighboring economies can differ sharply. Reading the map with the median, missing-data count, and definition in mind gives a more reliable picture than ranking countries by the top value alone.
Frequently Asked Questions
Is gross savings as a share of GNI the same as the household saving rate?
No. Gross savings is a national-accounts measure for the economy as a whole. Household saving is a separate measure based on household disposable income and consumption.
Does a negative gross-savings ratio mean the value is missing?
No. A negative value is an observed national-accounts result. Missing 2024 observations are kept as missing and are not replaced with zero.
Does a higher gross-savings share mean a country has higher income?
Not necessarily. The indicator is a percentage of GNI, not an income-level measure. GNI per capita or total GNI is needed for questions about income levels or scale.
Related Articles
Green Map creates custom-edited map images using open geographic data sources such as geoBoundaries, Natural Earth, OpenStreetMap, and government open data. These maps are edited visual materials, not raw data files, and are provided for education, documents, presentations, and graphic reference.