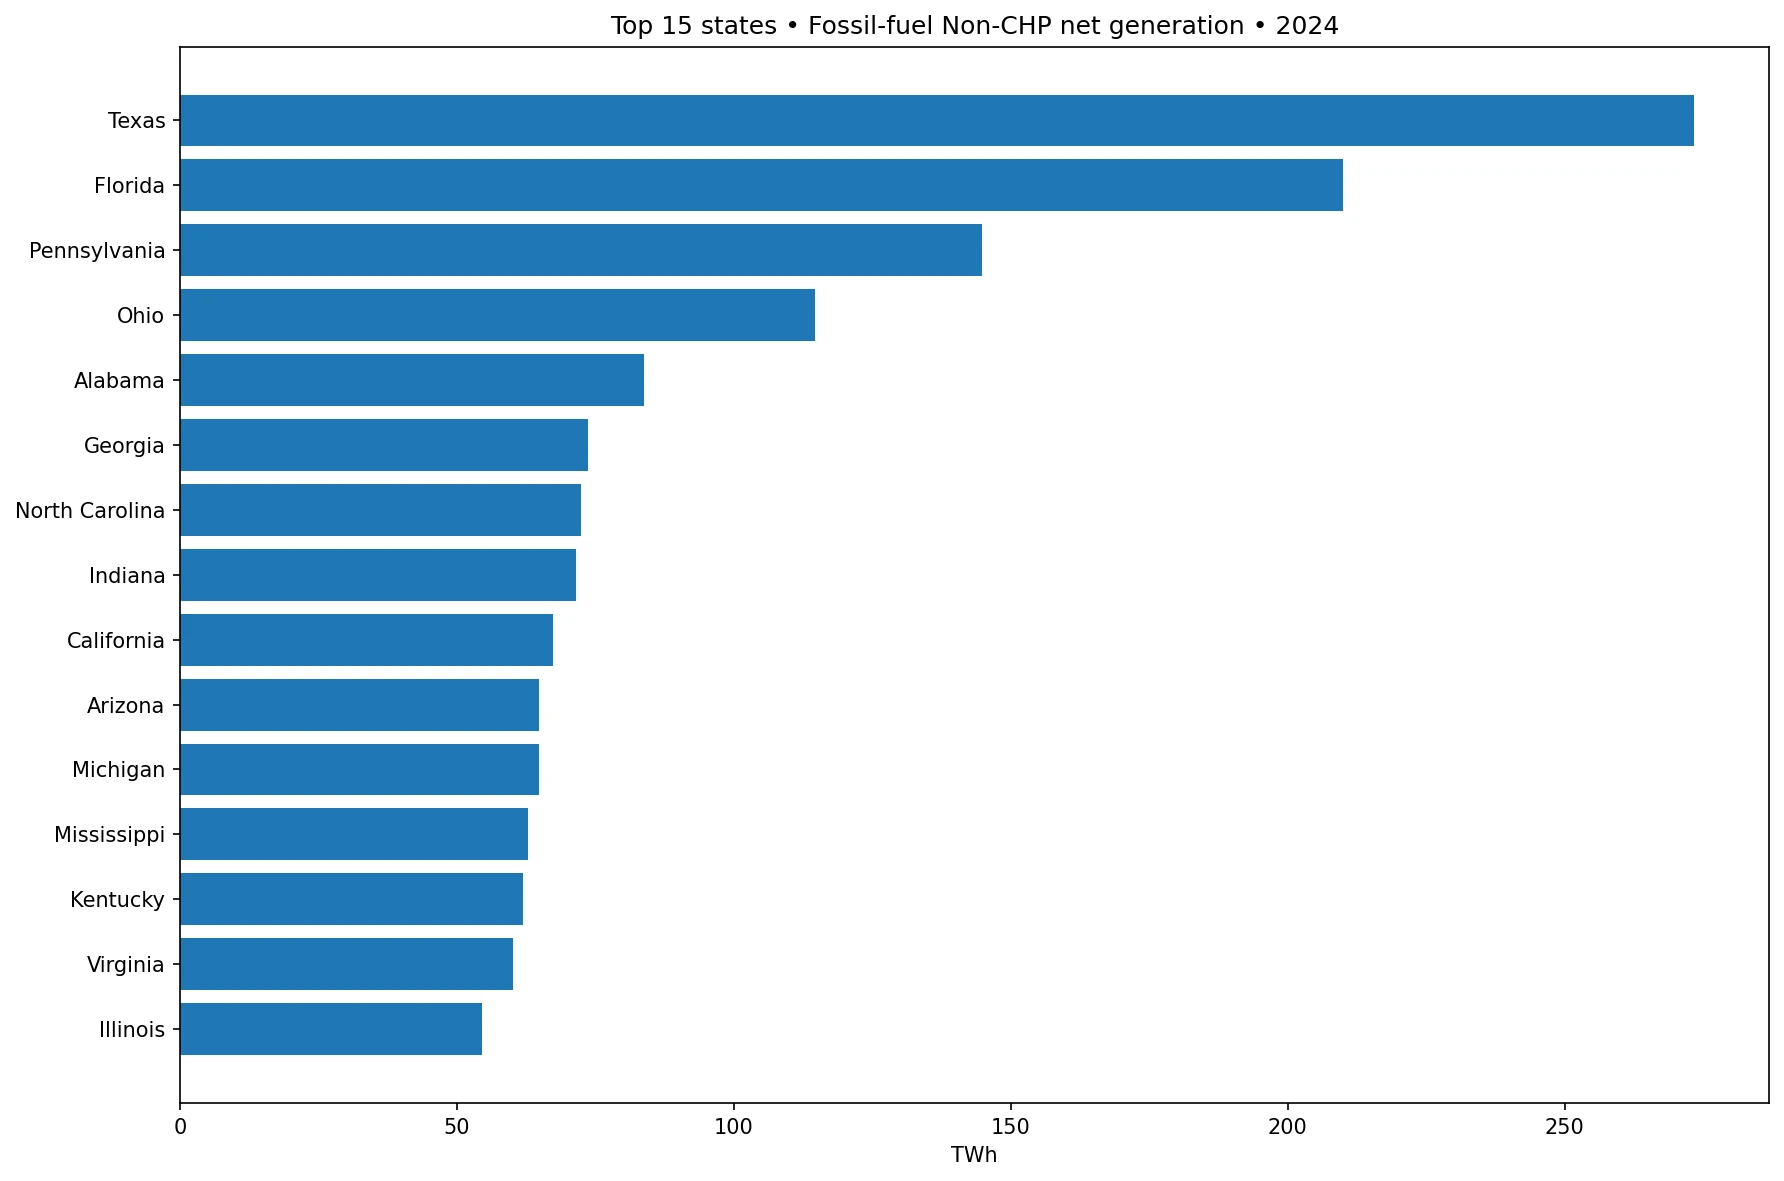
Texas led U.S. fossil-fuel net generation from Electric Power Sector Non-CHP facilities in 2024. In the U.S. Energy Information Administration’s Electric Power Operations data, the exact slice is annual `generation`, fueltypeid=FOS, and sectorid=90. The 50 state observations sum to about 2,297.46 TWh. Texas contributes 273.29 TWh, or 11.90% of that sum, followed by Florida at 210.02 TWh, Pennsylvania at 144.87 TWh, and Ohio at 114.57 TWh.
The identity of this article is the intersection of fossil fuels and the Non-CHP electric-power sector. It is not the same as the all-fuels Non-CHP series, which uses fueltypeid=ALL with sectorid=90, and it is not the same as the broader Electric Power fossil-fuel series, which uses FOS with another sector definition. One facet differs in each nearby series, so the state values and totals should not be merged.
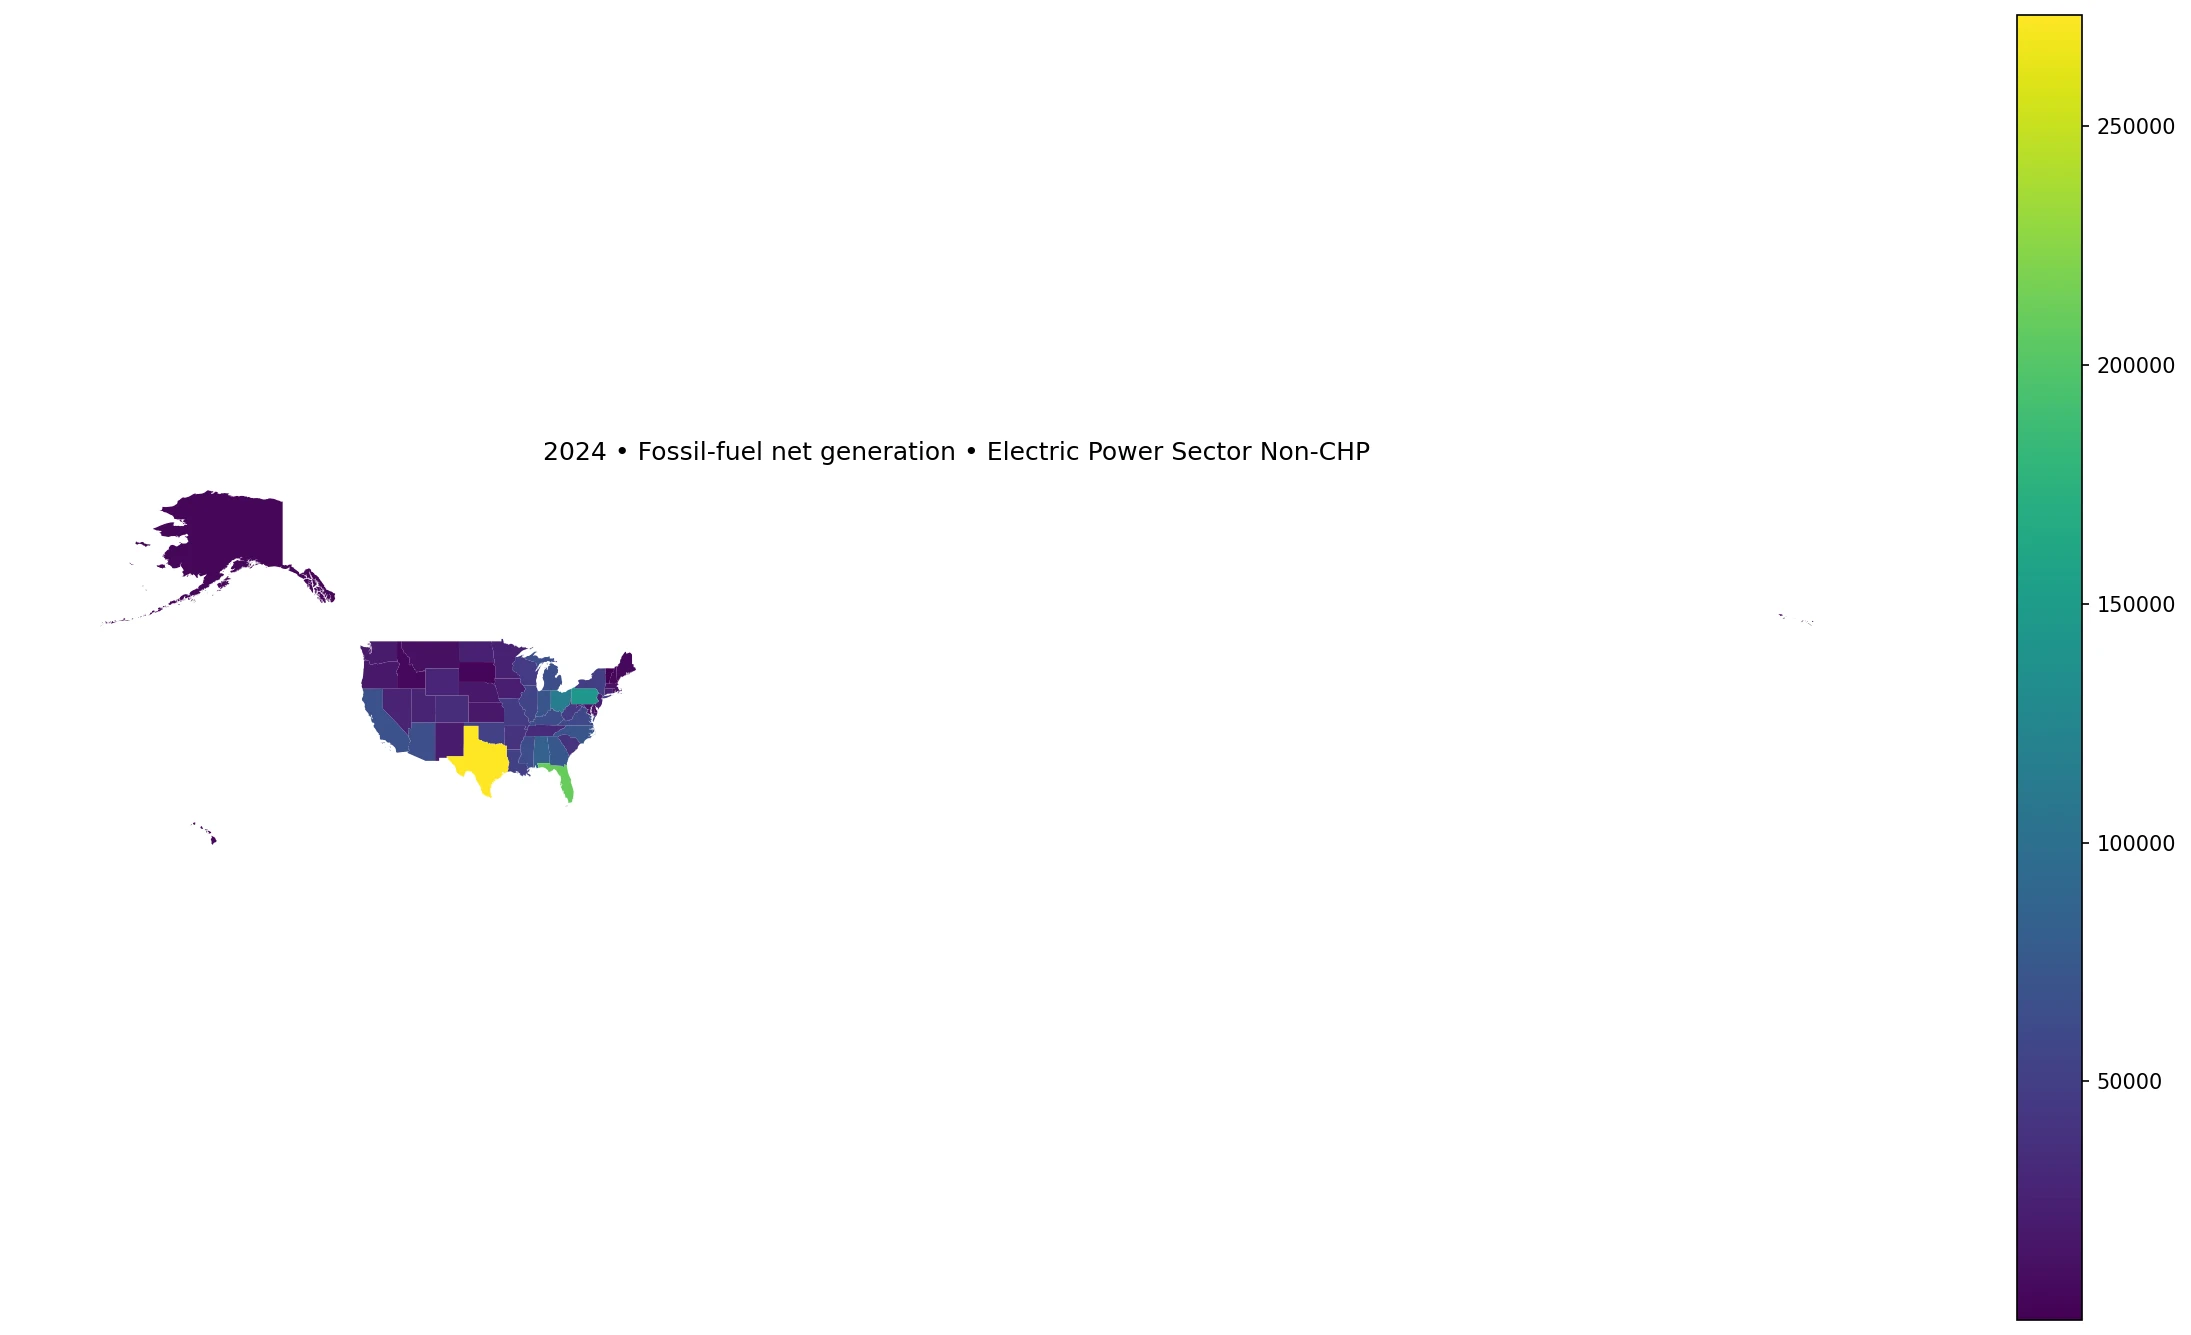
Table of Contents
The identity is FOS plus sector 90
EIA operating data are multi-dimensional. The field tells us what is measured, while the fuel and sector facets determine which generation is included. Here, `generation` is the output measure, FOS is the aggregate fossil-fuels category, and sector 90 limits the scope to Electric Power Sector Non-CHP. The combination matters more than a shortened headline.
A nearby all-fuels article can use the same year and sector 90 but fueltypeid=ALL. Another fossil-fuel article can use FOS but a broader Electric Power sector. Those are related datasets, not duplicates. The full key for the current comparison is 2024 + generation + FOS + sector 90 + state geography + thousand MWh.
The 50 states sum to about 2,297.46 TWh
The simple sum of the 50 observed values is 2297.46 TWh. Unlike an average heat-content factor, generation is an additive energy quantity when the year, unit, sector, and fuel scope are held constant. The sum is therefore meaningful for describing how this exact 50-state slice is distributed.
The unweighted state mean is 45.95 TWh and the median is 30.48 TWh. The mean is about 1.51 times the median, showing how large states lift the average. The first quartile is 17.51 TWh and the third quartile is 61.48 TWh.
Texas and Florida define the upper end
| State | Fossil Non-CHP net generation | Share of 50-state sum |
|---|---|---|
| Texas | 273.29 TWh | 11.90% |
| Florida | 210.02 TWh | 9.14% |
| Pennsylvania | 144.87 TWh | 6.31% |
| Ohio | 114.57 TWh | 4.99% |
| Alabama | 83.76 TWh | 3.65% |
| Georgia | 73.72 TWh | 3.21% |
| North Carolina | 72.42 TWh | 3.15% |
| Indiana | 71.53 TWh | 3.11% |
| California | 67.32 TWh | 2.93% |
| Arizona | 64.76 TWh | 2.82% |
Texas accounts for 11.90% of the 50-state sum and Florida for 9.14%. The top three states reach 27.34%, the top five 35.98%, and the top ten 51.20%.
The top ten include Texas, Florida, Pennsylvania, Ohio, Alabama, Georgia, North Carolina, Indiana, California, and Arizona. Large fossil Non-CHP generation is therefore spread across several regions rather than confined to one corridor.
Four states exceed 100 TWh
4 states are at or above 100 TWh, while 17 are at or above 50 TWh. At the other end, 9 states are below 10 TWh. The distribution therefore has a pronounced upper tail but still includes a substantial middle group.
The middle half of states lies between roughly 17.51 and 61.48 TWh. That range is broad enough to show substantial state differences, but it is far below the top observations in Texas and Florida.
Vermont is a tiny positive value, not zero
| State | Fossil Non-CHP net generation |
|---|---|
| Vermont | 0.004 TWh |
| Delaware | 3.335 TWh |
| South Dakota | 3.794 TWh |
| Alaska | 4.441 TWh |
| New Hampshire | 4.645 TWh |
| Hawaii | 5.498 TWh |
| Idaho | 6.082 TWh |
| Maine | 6.258 TWh |
| Rhode Island | 8.618 TWh |
| Montana | 10.794 TWh |
Vermont is the minimum at 3.59424 thousand MWh, or about 0.0036 TWh. Delaware, South Dakota, Alaska, and New Hampshire are the next-smallest observations. The dataset contains no exact zeros and no missing state values among the 50 rows.
A very small published number should not be converted to zero. It is also different from a missing jurisdiction. Keeping those distinctions prevents the lower tail from being distorted.
The District of Columbia is not a row in this FOS extract
The current file contains the 50 states and no District of Columbia row. That does not authorize adding D.C. as zero. Another sector-90 series using all fuels can include D.C., so fuel facet changes can affect not only the values but also the observed geographic coverage.
This is another reason to treat row count and included jurisdictions as part of series identity. Coverage differences can matter during duplicate review even when titles are similar.
How this differs from ALL + sector 90
The all-fuels Non-CHP series includes the eligible generation from fossil, nuclear, renewable, and other fuel categories represented by the EIA slice. The current FOS series keeps only the fossil-fuel component. Texas can lead both series while recording very different absolute values.
The difference between the two is not an error or a revision. It reflects the fuel filter. Comparing them can be useful for understanding how much of Non-CHP generation is fossil, but that calculation requires the two series to be aligned carefully.
How this differs from FOS in the broader Electric Power sector
A fossil-fuel article using another sector identifier can look even closer because it shares FOS and the 2024 generation field. The sector still changes what operations are included. Sector 90 is specifically Non-CHP, so it excludes generation outside that scope.
For duplicate control, the combination of fueltypeid and sectorid should be checked before semantic title similarity. This article consistently keeps FOS + 90 visible in the interpretation.
Net generation is not generating capacity
Net generation is energy output after subtracting electricity used by the generating facilities themselves. It is measured in MWh. Generating capacity is measured in MW and represents potential instantaneous output. A state can have high capacity but lower annual generation if plants operate fewer hours.
Texas ranking first in this generation series therefore does not prove that it has the highest fossil Non-CHP capacity or the highest utilization rate. Those require separate EIA capacity and operating data.
Absolute generation is not fossil-fuel dependence
The state ranking is based on TWh, an absolute quantity. A fossil share would divide fossil generation by total generation for the same scope. A large power system can rank high in absolute fossil generation even if non-fossil sources also produce a large amount of electricity.
The reverse is possible for a small system: fossil fuels can dominate its local mix while its absolute TWh remains modest. Amount and dependence answer different questions.
Generation alone does not measure fuel input or efficiency
Different plants require different amounts of fuel energy to produce one MWh. This dataset reports electricity output, not Btu input. Heat rate or efficiency analysis requires fuel consumption and generation together.
The same limitation applies to emissions. Fossil generation is related to emissions, but the amount depends on the underlying coal, gas, and petroleum mix and on plant efficiency. The FOS aggregate does not provide that detail.
FOS is an aggregate, not a single fuel
FOS combines multiple fossil fuel types. Similar state totals can be produced by very different internal mixes. One state may rely primarily on natural gas, another on coal, and another on a combination of fossil sources.
Fuel-specific analysis should use narrower EIA facets rather than infer the components from the FOS total. This article intentionally stays at the aggregate fossil level.
The distribution is concentrated but not dominated by one state
The top ten account for 51.20% of the 50-state sum. That is just over half, leaving nearly half of the total distributed across the other 40 states. Texas is the single largest contributor but remains far below a majority share.
This pattern is consistent with a power system where several large states form an upper tier while fossil Non-CHP generation remains present across most of the country.
Data source and calculation method
The source is the U.S. Energy Information Administration Electric Power Operations API. The slice uses annual 2024 data, field=`generation`, fueltypeid=FOS, sectorid=90 for Electric Power Sector Non-CHP, state geography, and the unit thousand megawatthours. The verified file contains 50 state observations.
The sum, mean, median, quartiles, rankings, and state shares are calculated directly from those 50 published values. No missing jurisdiction is converted to zero, and D.C. is not added. All 50 state rows match the state boundary layer used for the map.
Frequently Asked Questions
Is this the same as the broader 2024 U.S. fossil-fuel generation series?
No. This dataset fixes fueltypeid=FOS and sectorid=90, Electric Power Sector Non-CHP. A broader Electric Power fossil series uses a different sector scope.
Does Texas’s 11.9% mean 11.9% of Texas electricity was fossil-fueled?
No. It is Texas's share of the summed 50-state FOS + sector 90 generation values, not Texas's internal generation mix.
Why is the District of Columbia absent?
The verified FOS + sector 90 file contains 50 state rows and no D.C. row. D.C. was not added or zero-filled.
Related Articles
Green Map creates custom-edited map images using open geographic data sources such as geoBoundaries, Natural Earth, OpenStreetMap, and government open data. These maps are edited visual materials, not raw data files, and are provided for education, documents, presentations, and graphic reference.