St. Clair County occupies Michigan’s eastern edge along the St. Clair River, with Port Huron at the northern end of a long chain of waterfront communities. Marysville, St. Clair, Marine City, and Algonac continue south along the river, while Yale, Capac, Emmett, and Richmond sit farther inland. That contrast between the river corridor and the broader western interior is one of the clearest features on the county map. High-resolution map files are available for download in the section below.
This page combines the road and settlement map with a ranked city index, a water map, and an elevation map covering roughly 171 to 268 meters. High-resolution A3 JPG originals are available in the ZIP below, so the maps can be printed, used for school or local-reference work, or compared side by side.
Table of Contents
A river-side chain of cities from Port Huron to Algonac
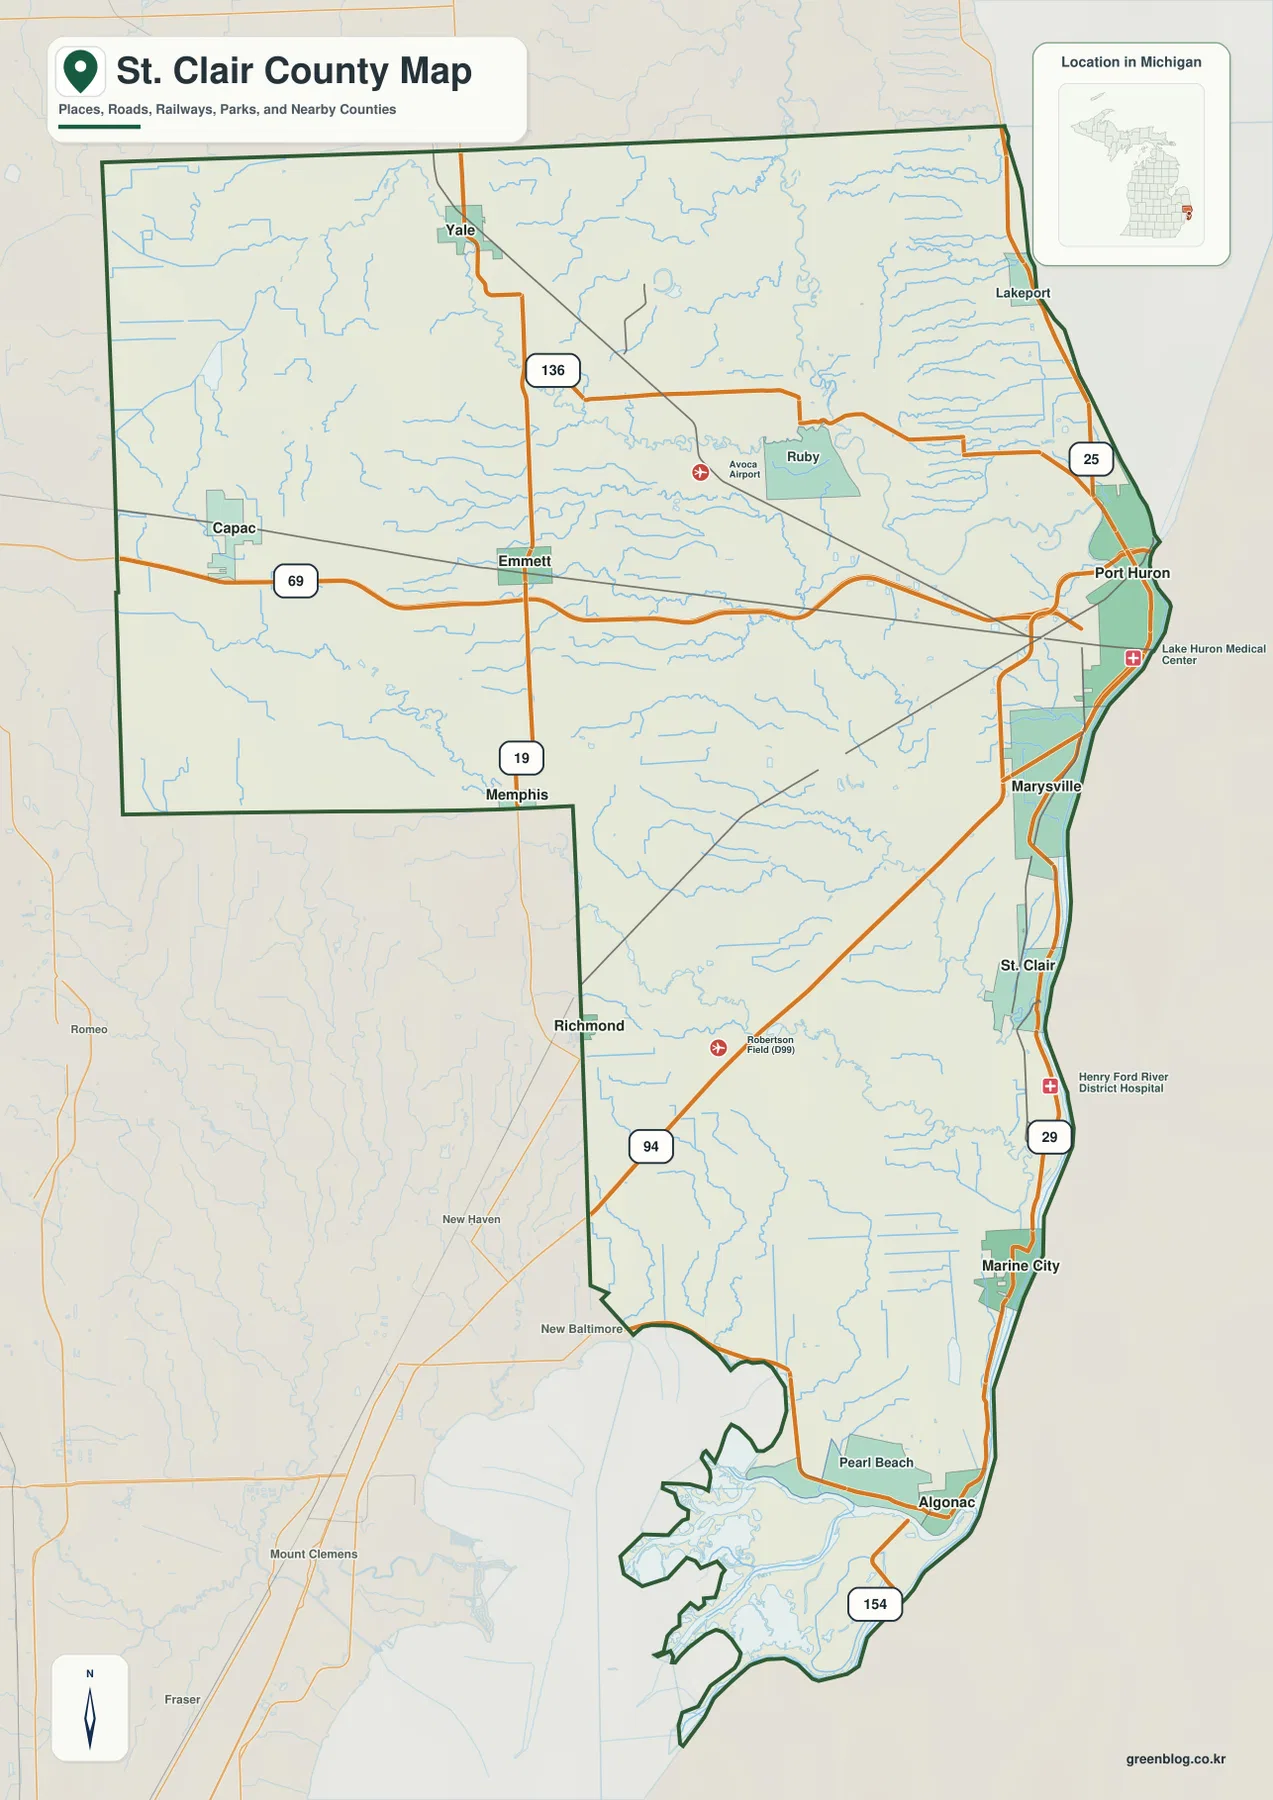
Port Huron is the most prominent city on the general county map and sits where several major routes converge near the upper St. Clair River. I-69 approaches from the west and I-94 reaches the area from the southwest. M-25 continues north from Port Huron toward the Lake Huron shore, while M-29 follows the river corridor south through Marysville, St. Clair, Marine City, and toward Algonac.
The western half has a different road pattern. M-19 runs north–south through the Memphis and Emmett area, and M-136 connects the Yale area with communities farther east such as Avoca and Ruby. I-69 forms the major east–west corridor across the middle of the county, while I-94 crosses the southern interior on its way toward Port Huron.
The county boundary becomes especially irregular around the southern waterways near Algonac and Pearl Beach. Islands, channels, and shoreline curves create a much more complex edge than the straighter land boundaries in the north and west. The general map is useful for county-scale orientation, but current driving times, closures, and local street details should be checked with a live transportation source.
Six ranked cities, with Port Huron clearly first
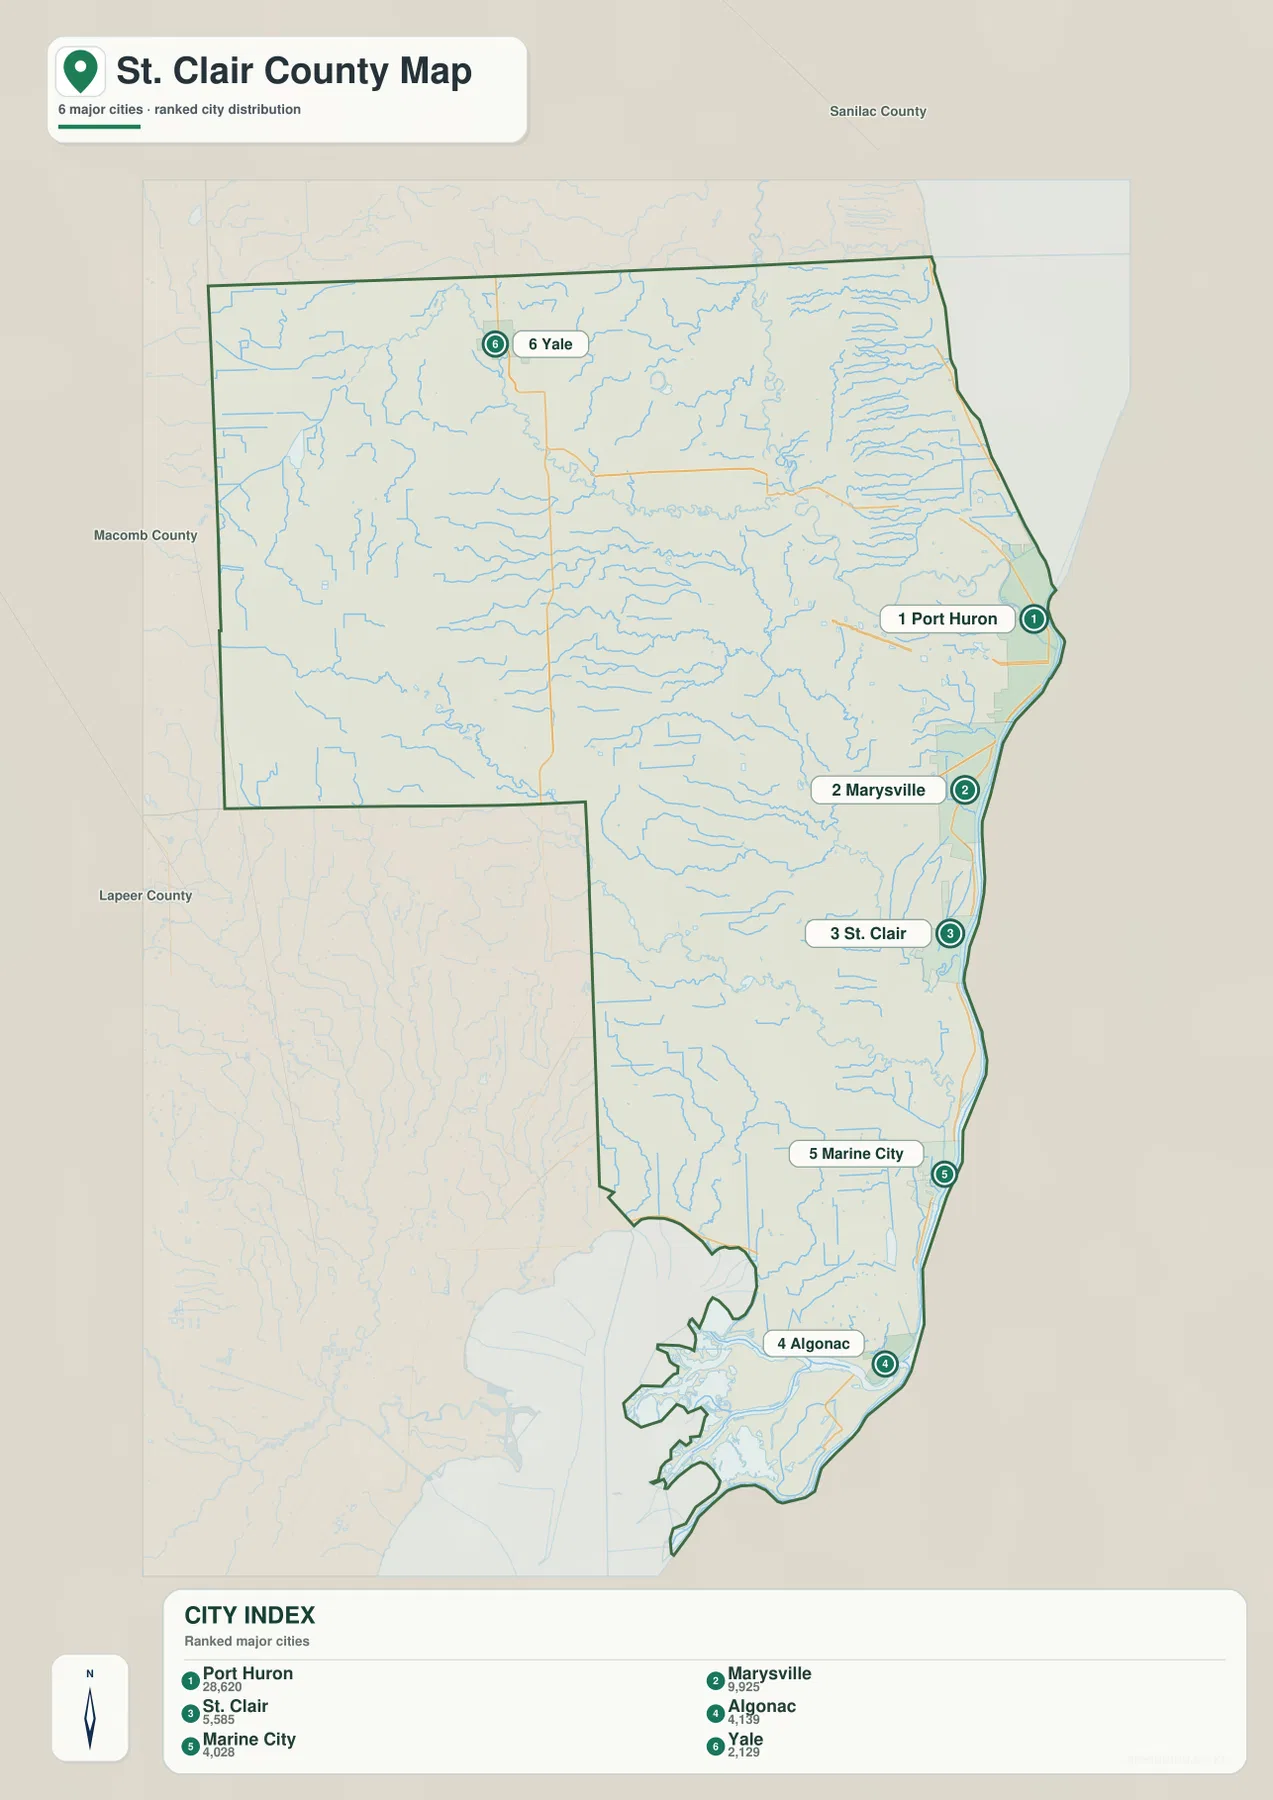
The city index ranks six selected cities. Port Huron is number 1 with a printed value of 28,620, followed by Marysville at 9,925, St. Clair at 5,585, Algonac at 4,139, Marine City at 4,028, and Yale at 2,129. These figures are reproduced from the supplied city-index graphic rather than replaced with a new population estimate.
Five of the six ranked cities lie along or very near the eastern river corridor. Port Huron occupies the northeast, Marysville and St. Clair sit farther south, Marine City continues the sequence, and Algonac is close to the southern end of the county. Yale breaks that pattern by appearing well inland in the northwest, making the difference between waterfront and interior settlement especially easy to see.
The city index contains no connector lines or mileage labels. It is therefore a distribution and ranking graphic, not a distance chart. Use it to compare the relative positions of the selected cities, then return to the general county map or a current routing service when actual road mileage is needed.
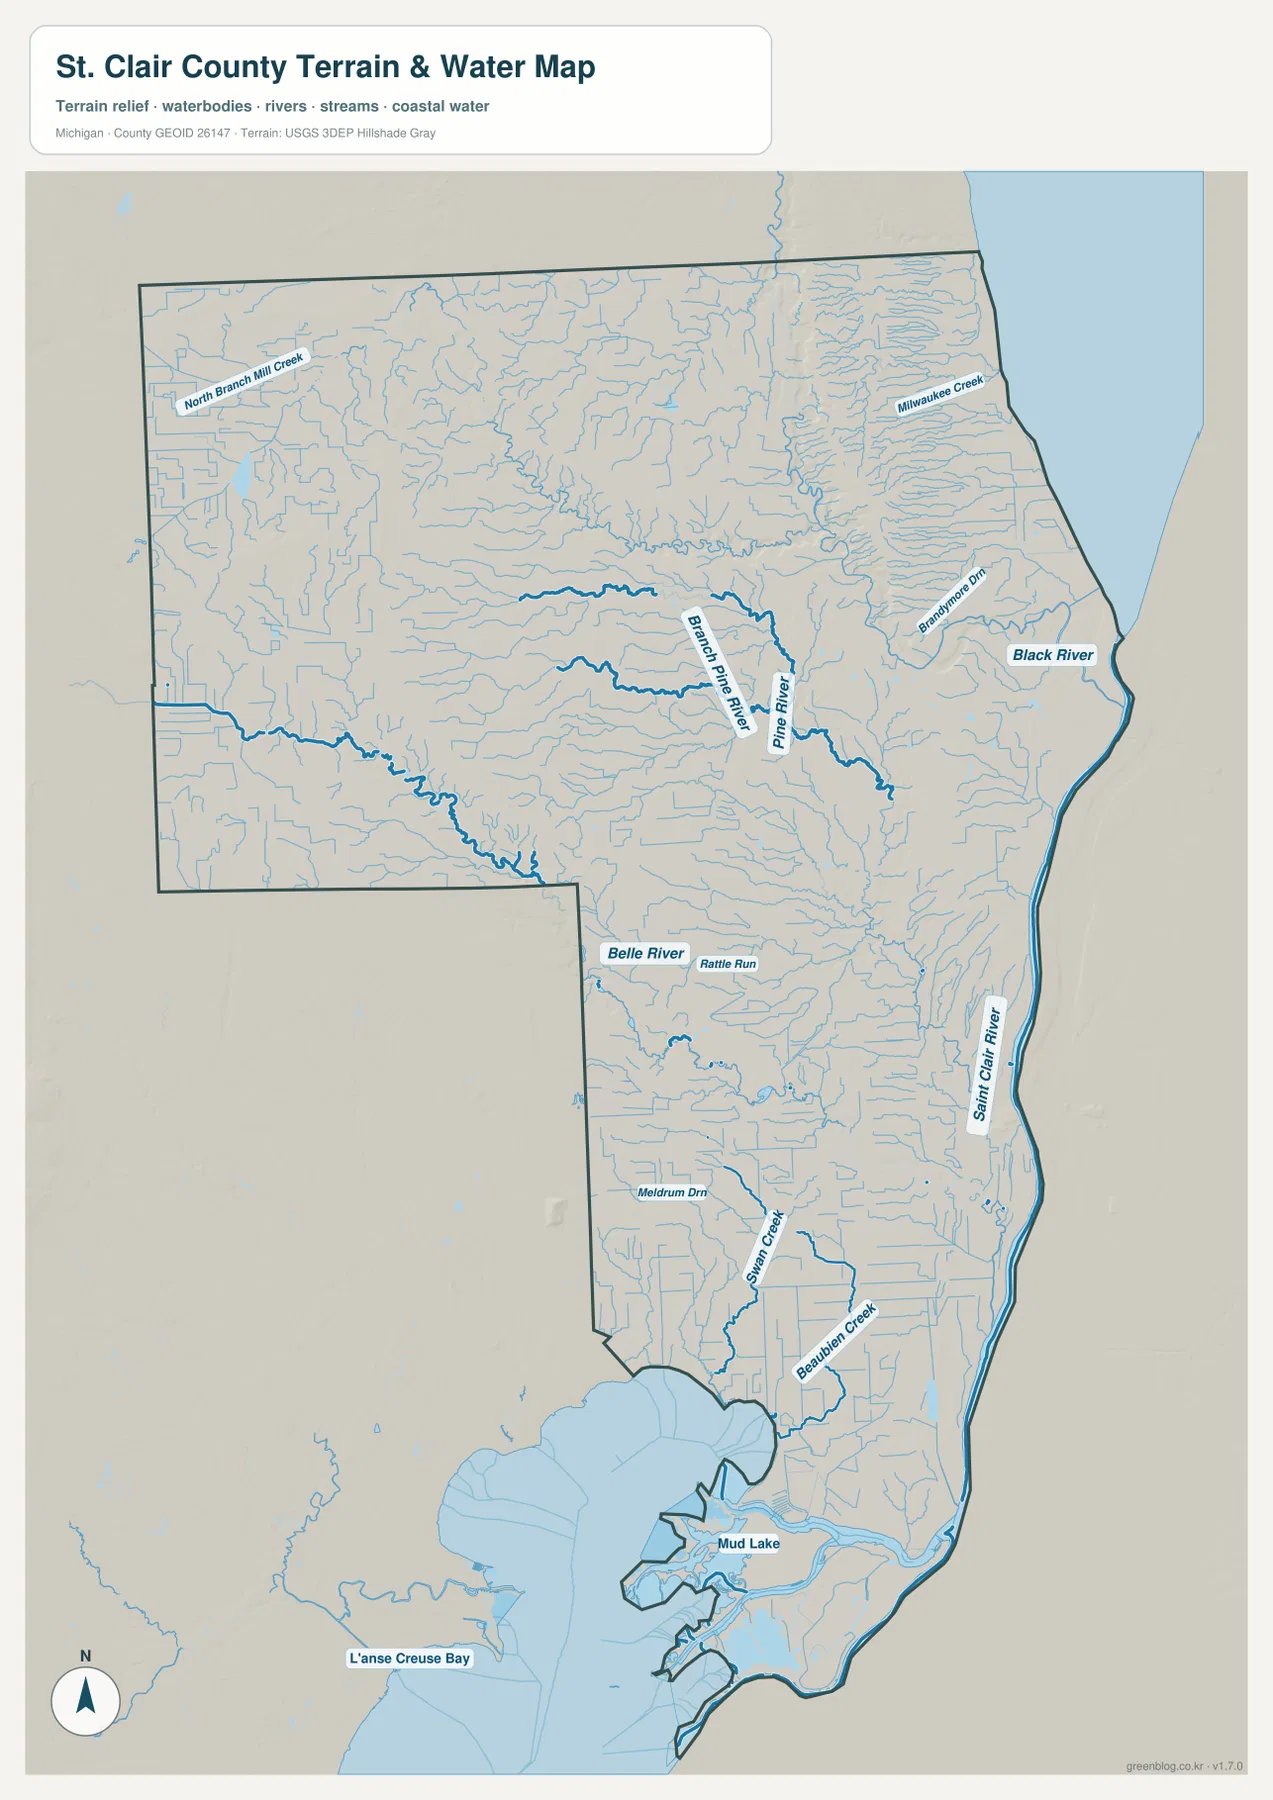
Black River, Pine River, and the St. Clair River corridor
The St. Clair River forms the dominant water feature along the county’s eastern side. From Port Huron it runs south past Marysville, St. Clair, and Marine City before reaching the complex channels around Algonac. The southern map area includes Mud Lake and broad channel networks, creating a very different waterscape from the simpler river edge farther north.
Black River is the most conspicuous inland river in the northeast. Pine River and Branch Pine River occupy the central part of the county, collecting water from numerous smaller tributaries before heading toward the eastern side. North Branch Mill Creek appears in the northwest, while Milwaukee Creek is among the smaller streams draining the northeastern area.
Farther south, Belle River and Rattle Run cross the interior, and Swan Creek and Beaubien Creek appear closer to the lower county. Many smaller streams and drains fill the spaces between those named waterways. The map makes clear that the county’s water geography is not limited to the St. Clair River; the inland plain is cut by a dense network of smaller channels.
St. Clair County Parks and Recreation manages sites including the Blue Water River Walk in Port Huron and supports the Bridge to Bay Trail. Those local recreation resources help connect the county’s riverfront geography with everyday public access, even though the water map itself is designed to show waterways rather than park facilities.
Use this water map for names and broad location relationships. It does not show flood probability, legal shoreline limits, navigation depth, parcel ownership, or real-time water conditions. Those questions require current products from the responsible public agency.
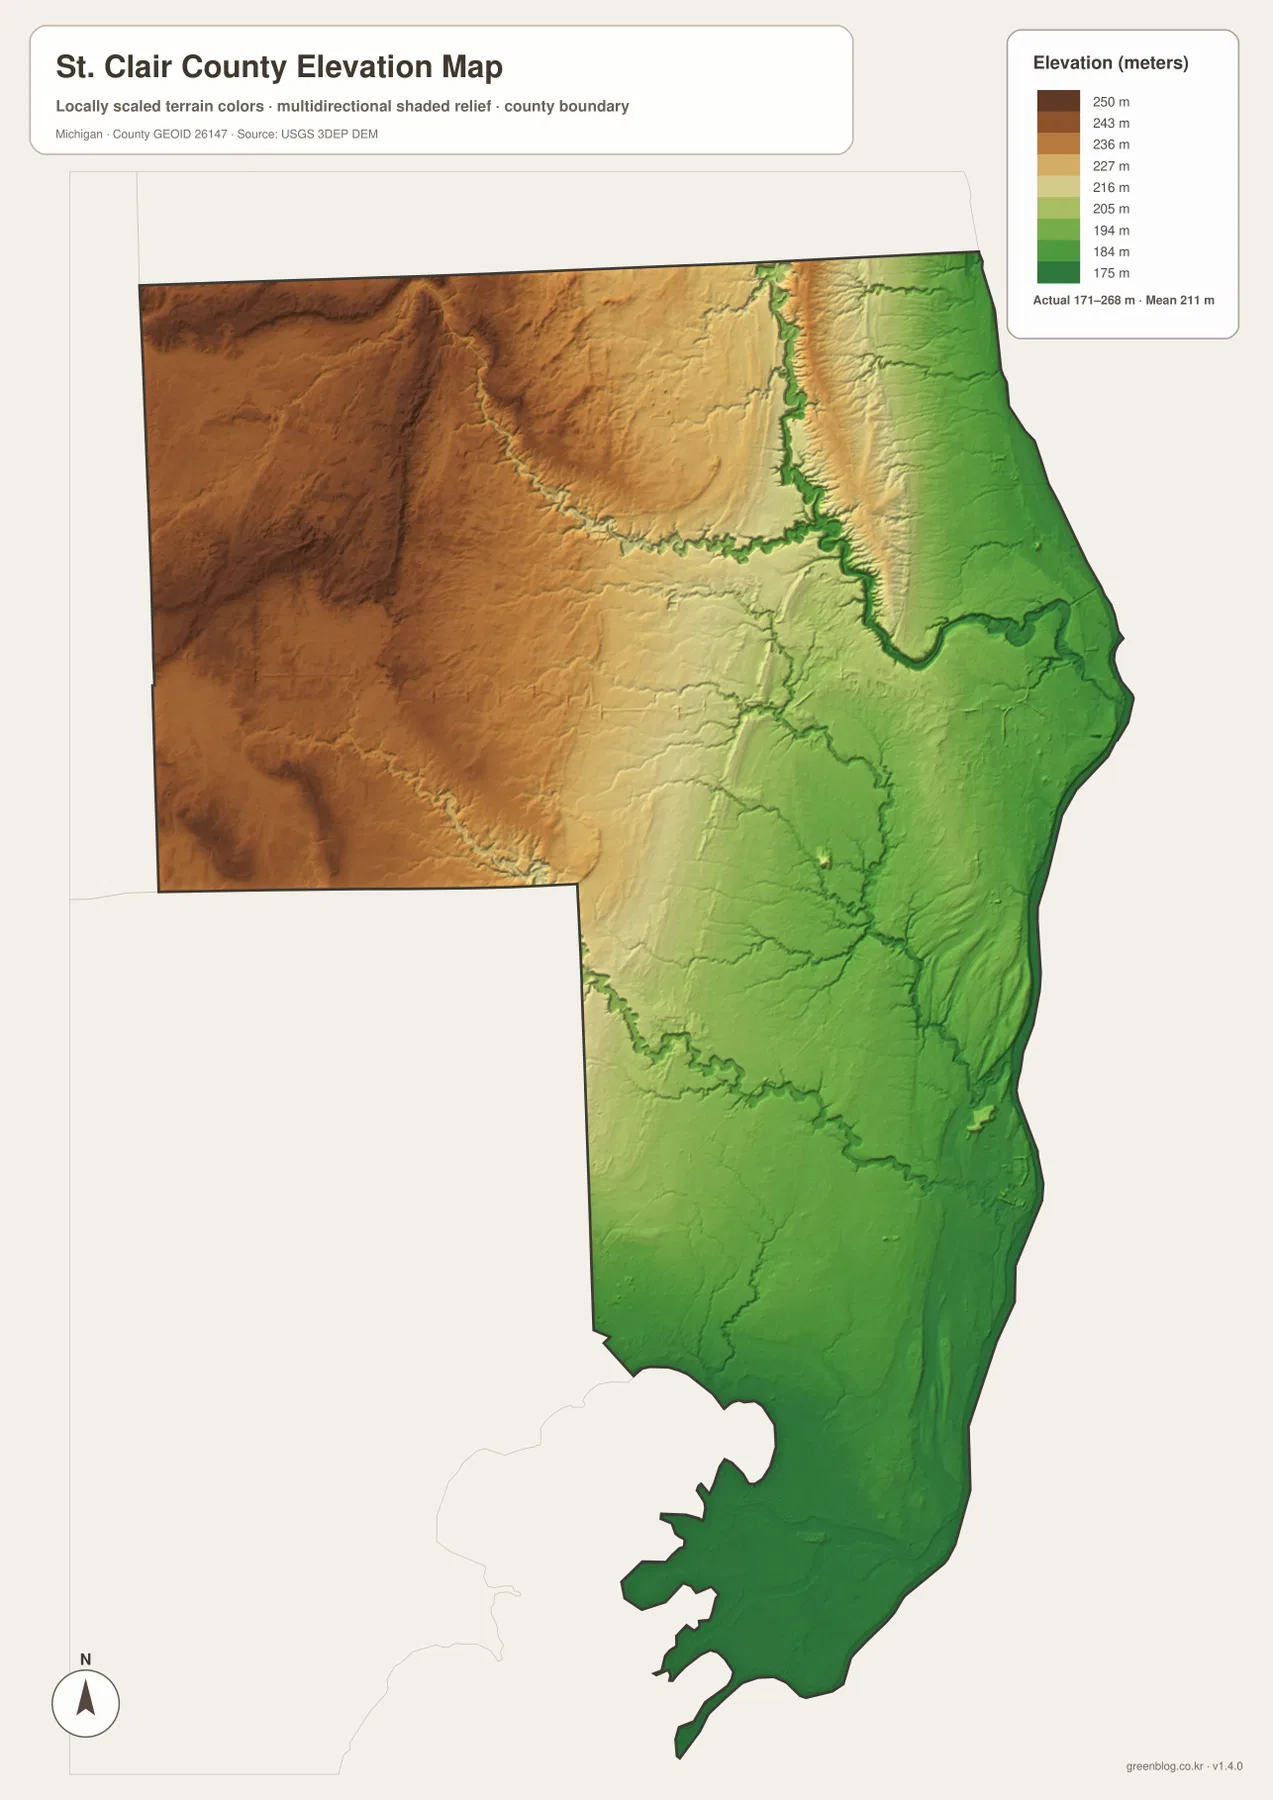
Elevation rises from the river lowlands toward the west
The elevation map reports an actual range of about 171 to 268 meters, with a mean near 211 meters. Green marks lower ground and tan-to-brown colors mark higher terrain. The lowest colors dominate the St. Clair River side and the southern channel country, while higher terrain becomes increasingly visible toward the west and northwest.
Black River and Pine River are easy to recognize on the relief surface because their valleys form narrow green corridors cut into higher surrounding land. The northwest contains the broadest area of darker brown terrain, while Port Huron and much of the eastern river corridor remain lower and gentler. The central county acts as a transition between those two settings.
The Algonac area is among the lowest parts of the map, which matches the concentration of channels, islands, and wet lowlands shown on the water layer. By contrast, the Yale and Capac side of the county includes much more elevated terrain. The overall relief is modest rather than mountainous, but a difference approaching 100 meters is enough to create visible changes in drainage and landform.
This elevation surface is intended for county-scale comparison, not survey or engineering work. A building site, road project, drainage design, or other task requiring precise elevations should use more detailed USGS products and field measurements.
How roads, rivers, and relief fit together
Port Huron is a useful place to compare all of the layers. The general map shows I-69 and I-94 converging near the city, the water map shows Black River approaching the same area, and the elevation map places the eastern edge in lower terrain. Together those details explain why the northeast functions as both a transportation node and a major riverfront location.
Marine City and Algonac present a different combination, with the highway closely following the waterfront and an increasingly complex network of channels appearing toward the south. Yale and Capac are distinctly inland, surrounded by higher terrain and a more open road pattern. Comparing those areas makes the east–west contrast inside St. Clair County much easier to understand.
The map set works well for classroom assignments, local-history presentations, trip preparation, and general county orientation. It is not a substitute for parcel records, zoning maps, flood-regulation products, legal surveys, or real-time transportation information, so specialized decisions should rely on current county, state, or federal sources.
Download the A3 JPG map files
The ZIP below contains the high-resolution A3 JPG originals for the general county map, ranked city index, water map, and elevation map. You can print one file, keep the complete set for reference, or compare two maps side by side when studying cities, roads, waterways, and terrain.
Frequently Asked Questions
Which map is best for comparing Port Huron and Algonac?
The city index is the quickest way to compare their relative positions, while the general county map provides the road context. Port Huron is in the northeast and Algonac is near the southern end of the river corridor, with M-29 and the St. Clair River extending between the two areas.
Are the city-index numbers current population estimates?
The values on this page are copied from the supplied city-index graphic. For the latest population figures, use current U.S. Census Bureau or St. Clair County statistics rather than treating the map values as a new estimate.
Can the 171–268 meter elevation range be used for surveying?
No. The elevation layer is useful for broad comparison of higher and lower terrain, but precise construction, drainage, engineering, or survey work requires more detailed official elevation data and field verification.
Map File Information
A ZIP containing the high-resolution A3 JPG originals for the St. Clair County map, city index, water map, and elevation map.
- Included Files: county map, city index map, water map, elevation map
- File Type: JPG
Related Maps
Sources and references
- U.S. Census Bureau TIGER/Line Shapefiles – official geographic files for county boundaries, roads, and place references.
- USGS National Hydrography – federal source for rivers, streams, lakes, and other hydrographic features.
- USGS 3D Elevation Program – official U.S. elevation and terrain data resources.
- St. Clair County official website – county government and local information for St. Clair County, Michigan.
- St. Clair County Parks and Recreation – official information about county parks, trails, Blue Water River Walk, and Bridge to Bay Trail.
Green Map creates custom-edited map images using open geographic data sources such as geoBoundaries, Natural Earth, OpenStreetMap, and government open data. These maps are edited visual materials, not raw data files, and are provided for education, documents, presentations, and graphic reference.