Lake County has one of the most urban northern edges in Indiana, with Hammond, East Chicago, and Gary pressed close to the Lake Michigan shoreline and Merrillville, Schererville, Hobart, and Crown Point extending the developed pattern southward. You can download the high-resolution JPG ZIP directly from this page when you need to inspect small road labels, river names, lake features, or relief shading. This Lake County Indiana Map page combines the dense northern road-and-city pattern with the Grand and Little Calumet rivers, Cedar Lake and Lake Dalecarlia, and an elevation surface that rises sharply into the county’s central and south-central uplands.
The county changes character quickly from north to south. Hammond and East Chicago occupy the northwest shoreline side, while Gary spreads farther east along the Lake Michigan edge. Merrillville lies south of Gary, Schererville farther west, and Hobart to the east. Crown Point provides a strong south-central city reference, with Cedar Lake to its west. Farther south, the map contains fewer large developed areas even though major roads continue through the county.
The elevation image reinforces that contrast. Its legend gives an actual range of about 137 to 243 meters and a mean of 201 meters. The Lake Michigan shoreline and the northern urban belt occupy broad low green terrain. Farther south, tan and brown ridges spread across the central and south-central interior before the far southern edge becomes gentler and lower again. Lake County therefore has a layered north-to-south relief pattern rather than one steady slope.
Table of Contents
Hammond, East Chicago, and Gary define the Lake Michigan urban edge
The general county map is dominated at the top by closely spaced northern cities. Hammond sits near the northwestern boundary, East Chicago lies just to its northeast, and Gary occupies a broad area farther east. Indiana DNR’s Lake Michigan Coastal Program includes Lake County within northwest Indiana’s coastal region, matching the map’s clear shoreline setting and the broad water body along the county’s northern edge.
The road and rail pattern is much denser here than in the southern half. Multiple east-west and north-south routes cross the Hammond–Gary area, and numerous rail lines appear around the industrialized northern corridor. Calumet College of Saint Joseph is labeled near East Chicago, while Lake Station provides an eastern transition between Gary and the county line. The simplest way to orient this section is to remember Hammond in the west, Gary farther east, and Lake Station beyond Gary.
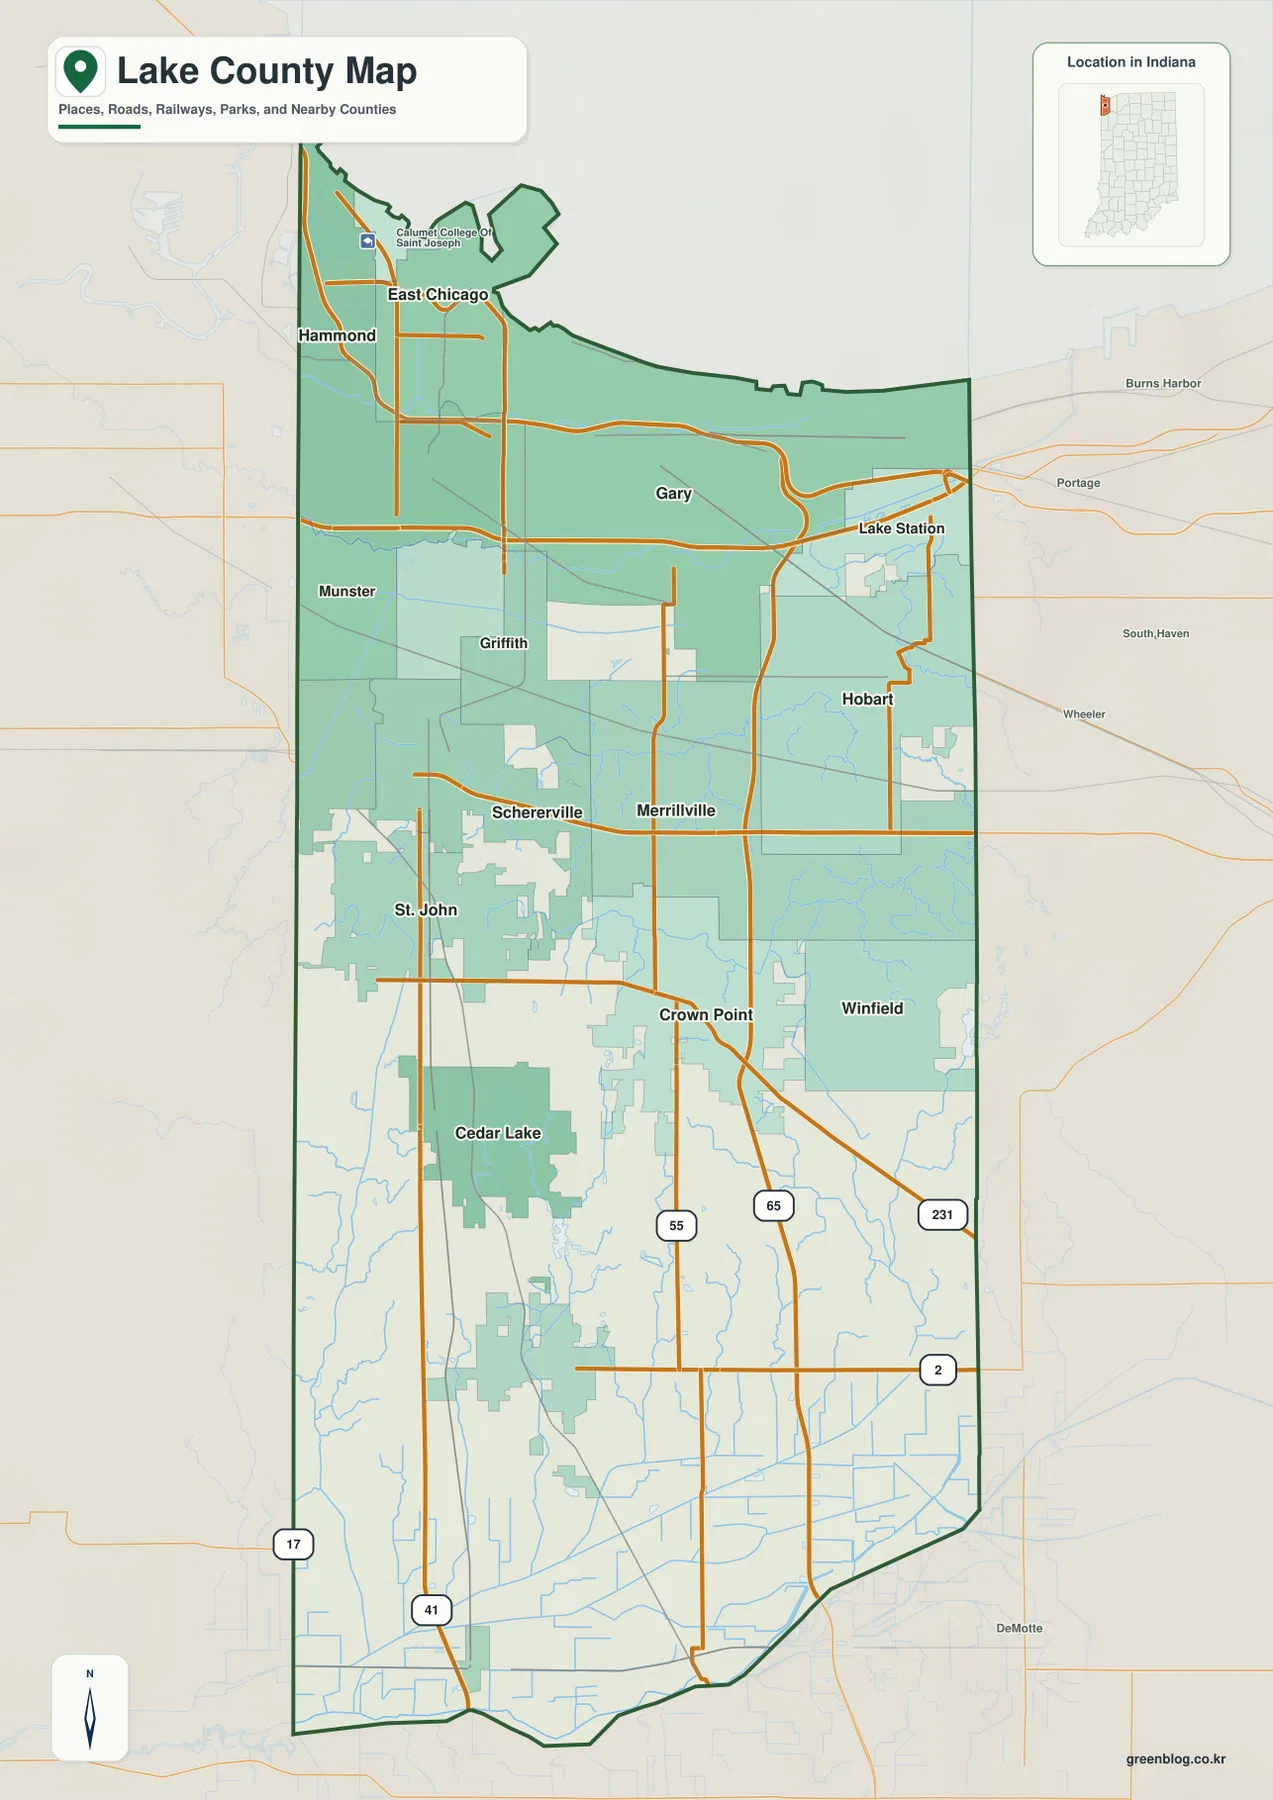
Below the shoreline cities, Munster, Griffith, Merrillville, and Schererville form another closely spaced group. Merrillville is especially useful because it sits below Gary near several major road crossings, while Schererville anchors the western side and Hobart the east. The developed areas no longer form one continuous block, but the number of nearby city labels still makes this part of Lake County much more urban-looking than the lower third.
Crown Point is the strongest city reference farther south, with Winfield to the east and Cedar Lake to the west. Roads marked 55, 65, 231, 2, and 41 continue into the lower county. Once the map reaches this area, town labels thin out and the landscape becomes increasingly rural. Crown Point and Cedar Lake therefore make useful transition markers between the northern metropolitan pattern and the southern half.
The city index highlights two large northern cities and a second tier farther south
The supplied city index highlights six places. Hammond is printed at 76,768 and Gary at 68,113. Merrillville follows at 36,476, Crown Point at 34,393, Schererville at 29,701, and Hobart at 29,558. These are values printed on the supplied map edition, not a live population feed. Their strongest use here is spatial: Hammond and Gary occupy the northern belt, three of the remaining cities sit immediately below, and Crown Point provides the southernmost major-city reference.
| Rank | City | Value printed on map | Position |
|---|---|---|---|
| 1 | Hammond | 76,768 | Northwest |
| 2 | Gary | 68,113 | North / east of Hammond |
| 3 | Merrillville | 36,476 | North-central |
| 4 | Crown Point | 34,393 | South-central |
| 5 | Schererville | 29,701 | West-central |
| 6 | Hobart | 29,558 | East-central |
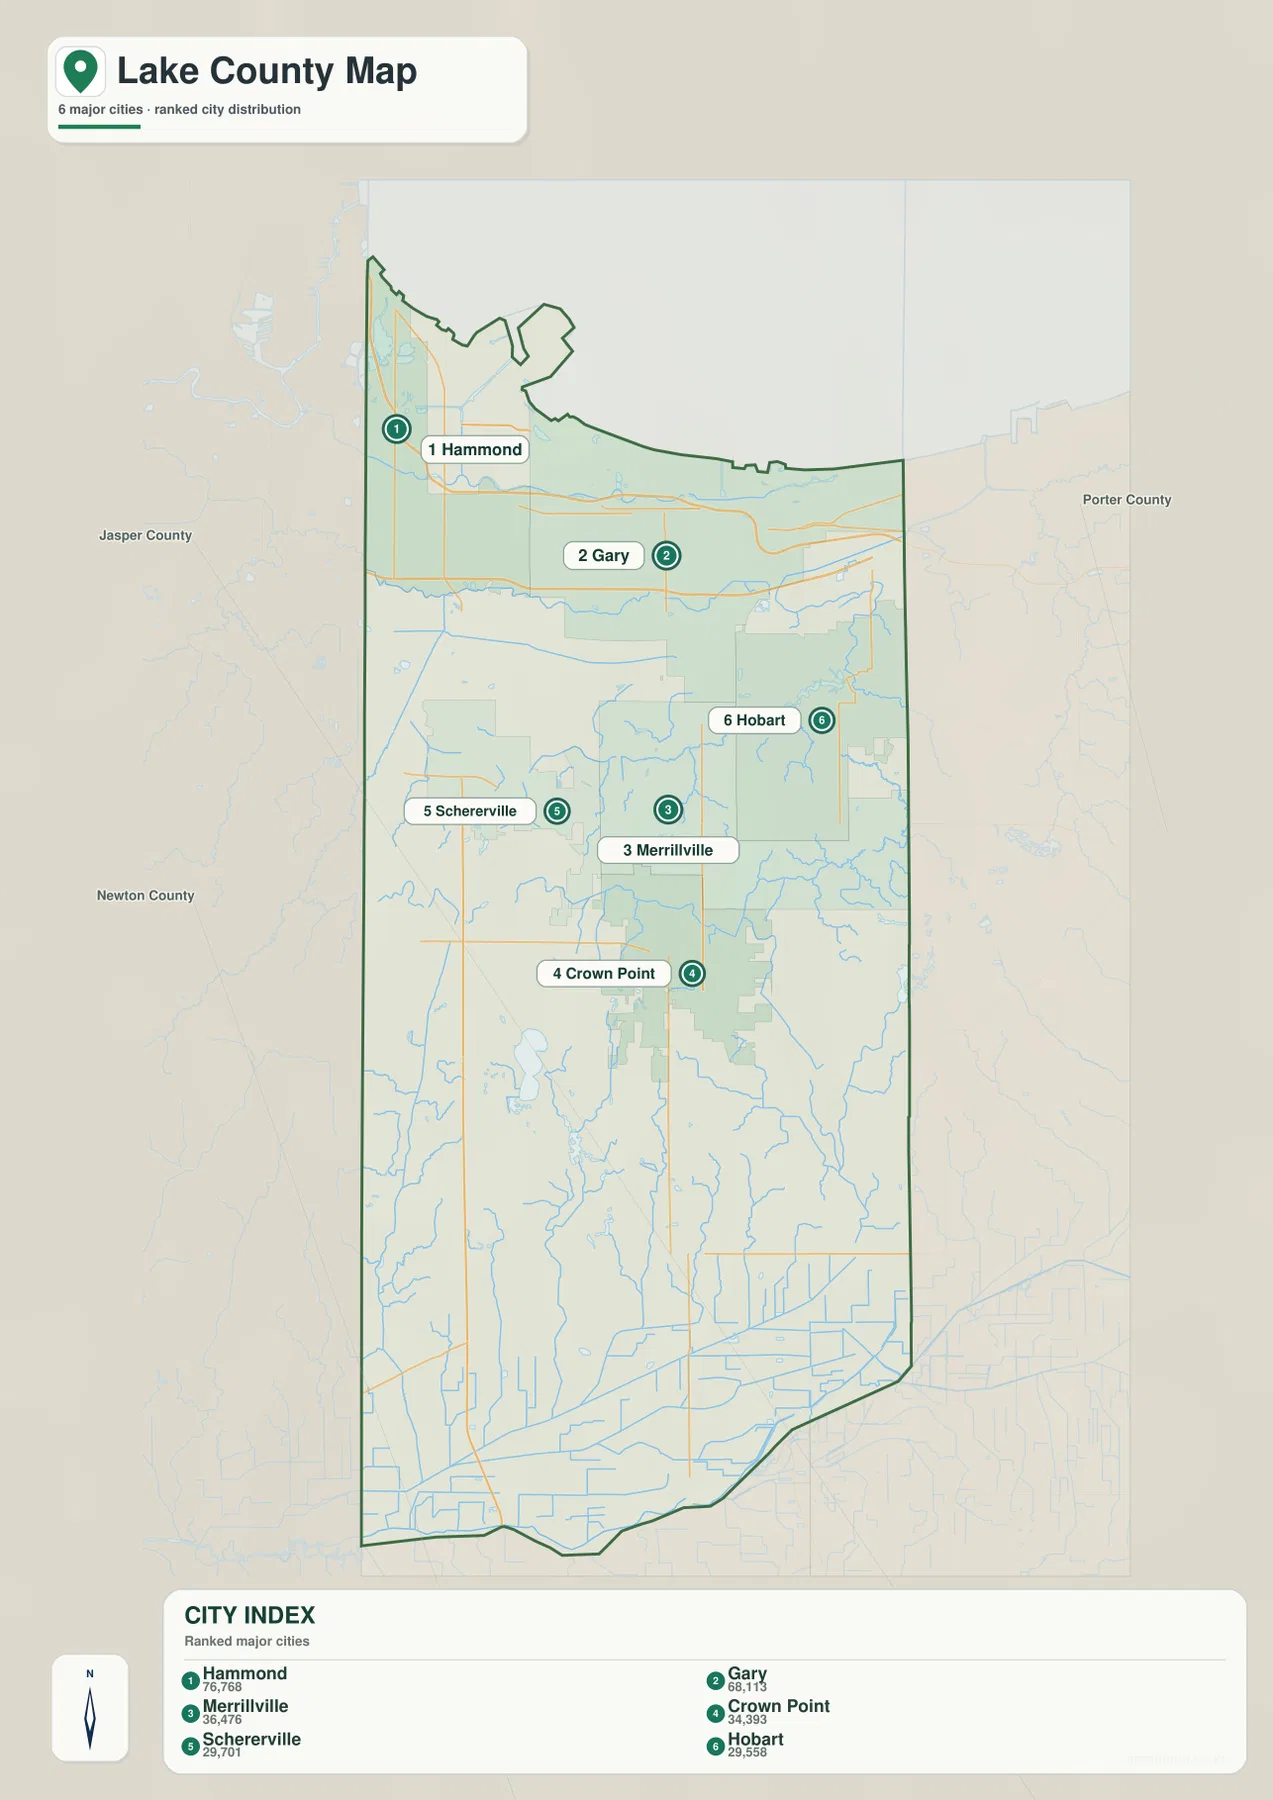
Hammond and Gary are both northern cities but provide different side-to-side references: Hammond is close to the western edge, while Gary spreads eastward along the Lake Michigan side. Merrillville, Schererville, and Hobart fill the next band to the south. Crown Point is separated from that group and makes it easier to judge how far the major urban pattern extends down the county.
The general map includes many additional names that are absent from the six-place index, including East Chicago, Munster, Griffith, Lake Station, Winfield, St. John, and Cedar Lake. Use the general map when those places or exact road connections matter. Use the index when the goal is to compare the six highlighted centers without the visual competition of the full northern road network.
Grand and Little Calumet rivers divide the northern lowlands, with Deep River farther east
The terrain-and-water map starts with the broad Lake Michigan water body across the top edge. Just south of it, Grand Calumet River crosses the northern part of the county and reaches the area labeled Calumet Lagoon. Little Calumet River runs farther south on another long east-west line. Together, these waterways provide the clearest internal framework for understanding the low northern section.
Deep River creates a different reference on the eastern side, bending north-south before connecting into the wider drainage network. Turkey Creek crosses the middle of the county from west toward east. Compared with the long Calumet channels, these streams define the transition between the northern lowland and the higher central interior.
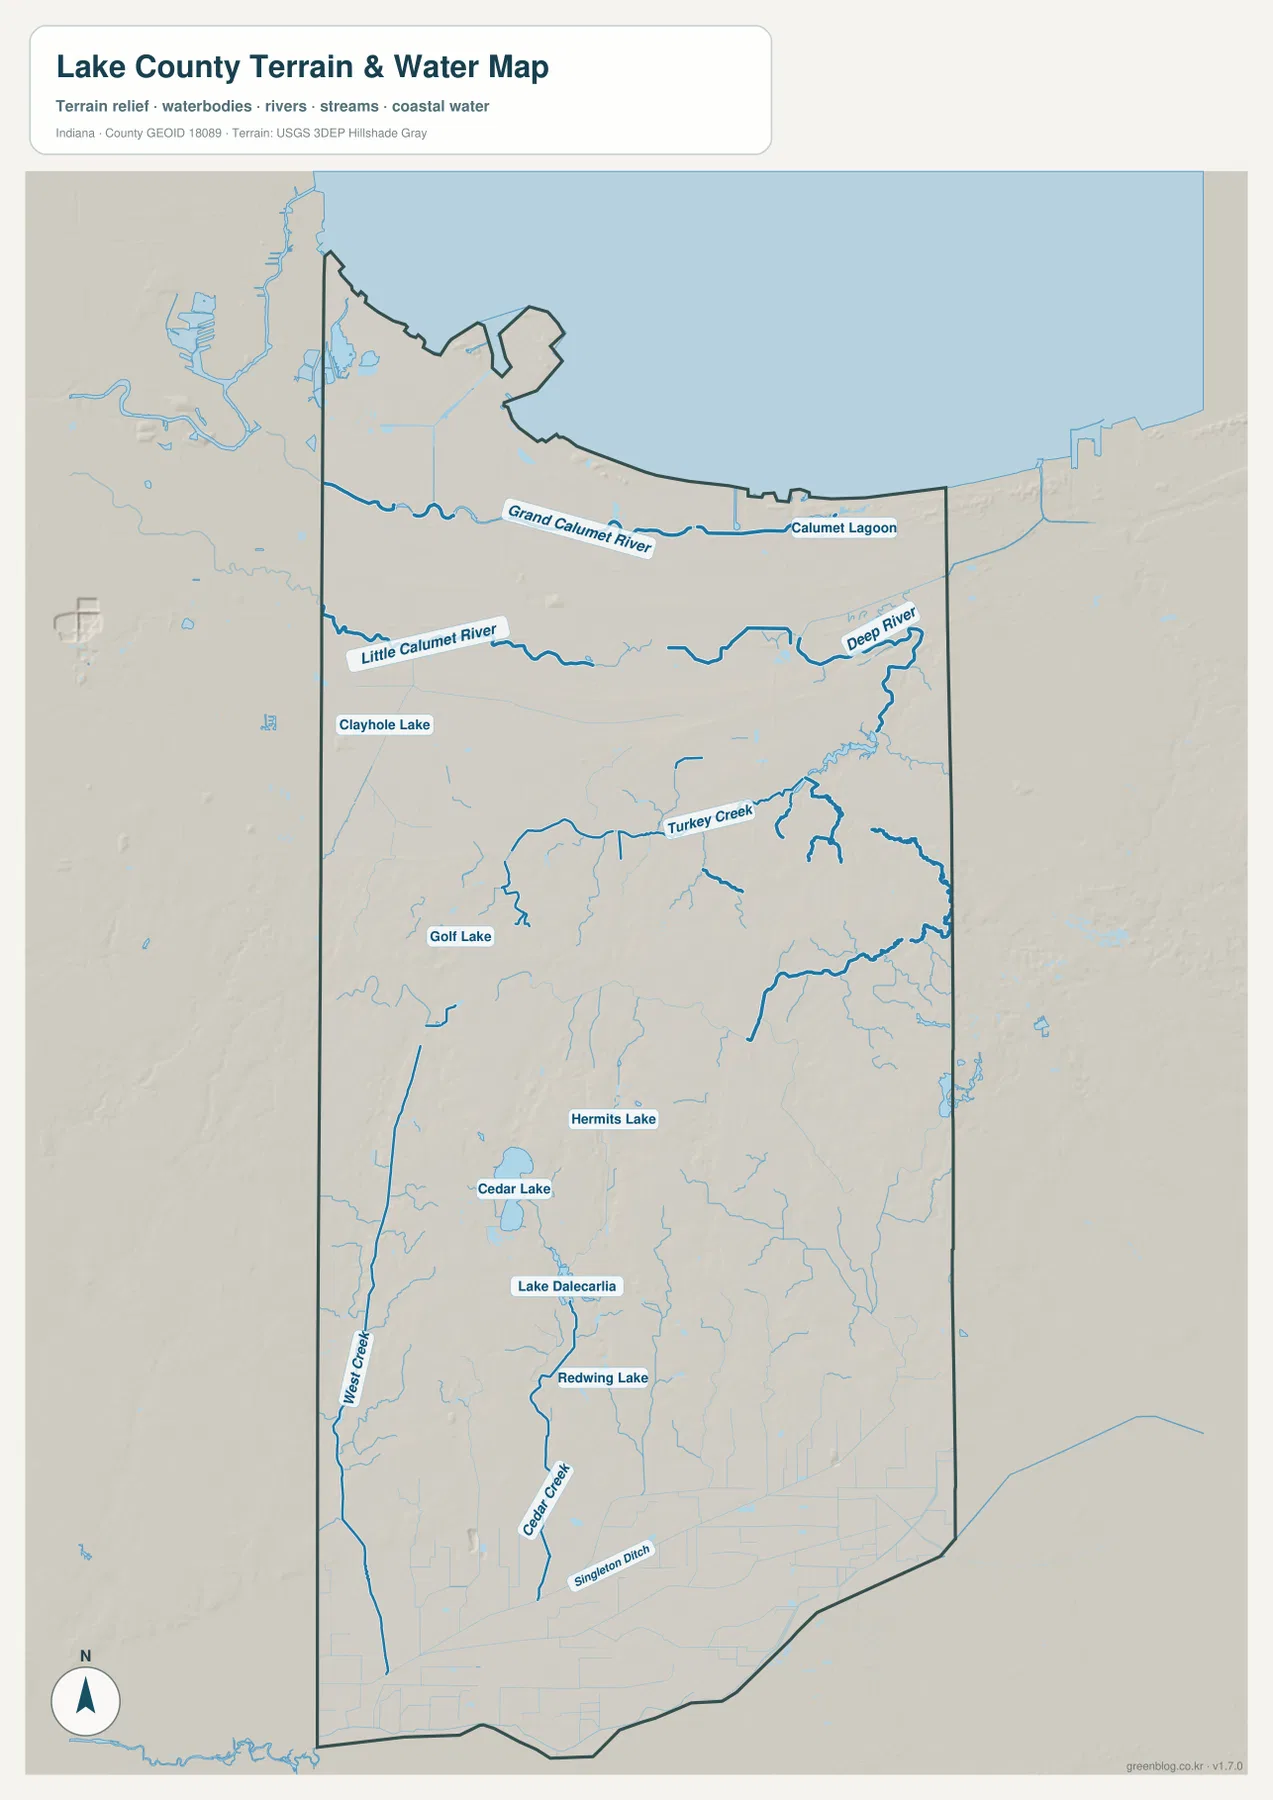
Several lakes and ponds make useful interior landmarks. Cedar Lake is the largest obvious inland water body in the south-central-western area, with Lake Dalecarlia farther south. Redwing Lake lies below Lake Dalecarlia, Hermits Lake appears near the middle, and Golf Lake and Clayhole Lake provide smaller western references. They are local orientation features rather than substitutes for the much larger Lake Michigan shoreline.
In the lower western half, West Creek runs a long north-south course, while Cedar Creek lies farther east and Singleton Ditch appears near the south. The drainage map therefore becomes finer-grained toward the lower county: instead of the broad Calumet rivers, many smaller channels divide the rural landscape.
This water view is meant to show geographic location and terrain relationships. It should not be used by itself to decide flood exposure, current water conditions, navigation rights, or legal shoreline and property boundaries. Lake Michigan shore use and regulatory limits have separate Indiana DNR guidance, and other water-management questions likewise require the current agency source for that specific purpose.
The 137–243 m surface rises from the Lake Michigan lowland into broad central ridges
The elevation legend gives an actual Lake County range of about 137 to 243 meters and a mean of 201 meters. The northern shoreline belt is dark green and low, and the Calumet river corridors remain within that low terrain. Moving south from the Gary–Hammond area, the surface gradually rises and then expands into a large tan-and-brown upland zone through the central and south-central interior.
The low northern surface overlaps strongly with the county’s densest urban belt. Hammond, East Chicago, and Gary sit within the green shoreline plain, and terrain remains relatively low around the Merrillville–Hobart transition. Little Calumet River and Deep River remain visible as lower cuts within or beside this gradual rise.
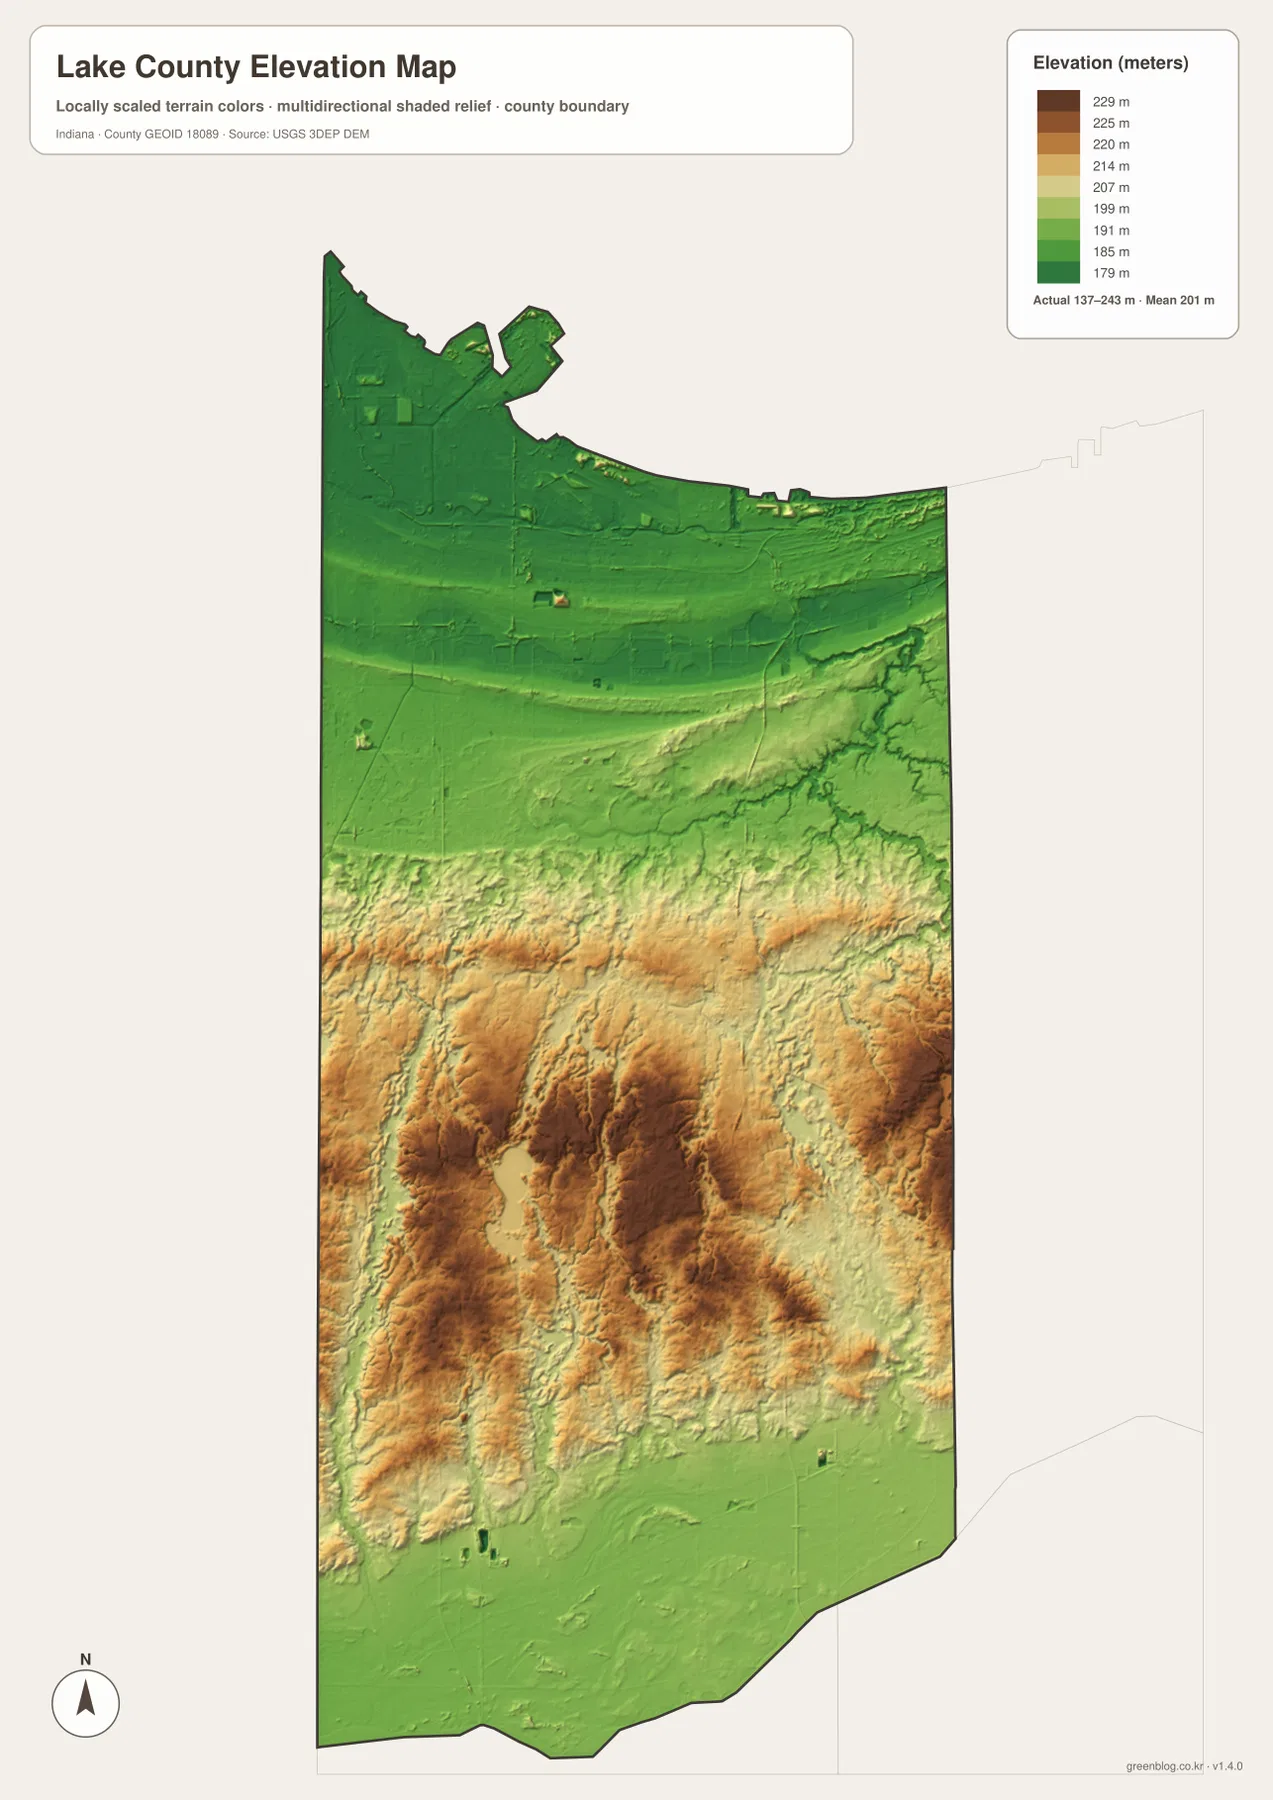
The highest-looking terrain spreads across and south of the Crown Point latitude, especially through the central-western and central interior. Long ridge forms are separated by narrow creek valleys. Cedar Lake occupies lower ground within this broader upland setting, so the water and relief maps together show a sharp local contrast between the lake basin and nearby higher terrain.
The far southern edge becomes greener and gentler again. Lake County therefore does not simply rise continuously away from Lake Michigan. A better county-scale picture is a low shoreline plain, a broad central upland belt, and a lower southern fringe, all cut by streams such as West Creek and Cedar Creek.
The 137–243 meter range is designed for broad terrain comparison. It is not a surveyed elevation for a parcel corner, foundation, road grade, or drainage plan. Site-level work should use original elevation data such as the USGS 3D Elevation Program or professional survey measurements rather than the generalized county image.
Start with the northern city belt, then trace the Calumet rivers into the central uplands
For roads and settlements, begin with Hammond, East Chicago, and Gary along the northern edge. Move south to Merrillville, Schererville, and Hobart, then use Crown Point and Cedar Lake to transition into the lower half. In the far south, route numbers and the county boundary become more useful than large city labels.
The city index gives a quick comparison of six highlighted centers without the dense road background. Hammond and Gary dominate the printed values, Merrillville, Schererville, and Hobart occupy the next band south, and Crown Point is the lower reference. Anyone needing current demographic counts should use a current official statistical source rather than the printed index.
For physical geography, identify Lake Michigan and the Grand and Little Calumet rivers first, then follow Deep River and Turkey Creek farther south. Switch to the elevation map at those same locations and the relationship becomes clear: broad northern lowlands give way to a high central belt. Cedar Lake, Lake Dalecarlia, and West Creek can then be used to navigate the lower county.
The WebP images on the page are reduced for faster loading. The archive below contains four original 2572×3638-pixel JPG files—the general county map, city index, terrain-and-water map, and elevation map. Those full-size files are better for reading small urban labels, road shields, river names, and relief shading at print scale.
A practical comparison is to keep one northern city and one central city fixed as references. Find Gary and Crown Point on the general map, compare the major-city pattern on the index, trace the Calumet rivers and Cedar Lake on the water view, and then check how the elevation surface changes between the shoreline plain and the central ridges. That sequence makes the county’s strong north-to-south differences much easier to see.
Frequently Asked Questions
Which cities have the largest values on the supplied city index?
Hammond is printed at 76,768 and Gary at 68,113. Merrillville follows at 36,476, Crown Point at 34,393, Schererville at 29,701, and Hobart at 29,558. These values belong to the supplied map edition; current demographic work should use an up-to-date official source.
Which water features are easiest to recognize?
Lake Michigan forms the major northern water reference, with Grand Calumet River and Little Calumet River just inland. Deep River and Turkey Creek help orient the middle of the county, while Cedar Lake and Lake Dalecarlia stand out farther south. The map shows location and terrain relationships rather than flood status or legal water boundaries.
Can the 137–243 m elevation range be used for exact property elevations?
No. The elevation image gives a county-wide relief range with a mean of 201 meters and is intended to compare the Lake Michigan lowland, central ridges, and lower southern fringe. For a Lake County building site, drainage project, or parcel-level elevation, use original elevation data or a qualified survey rather than this county-scale relief image.
Map File Information
The Lake County ZIP combines the general road-and-place map, six-city index, terrain-and-water map, and elevation map as full-resolution JPG originals.
- File Type: ZIP containing four 2572×3638px JPG files
Related Maps
Sources and References
The article is based primarily on the supplied Lake County map set and asset manifest. The following official sources provide county, Lake Michigan coastal, boundary, hydrography, and elevation context.
- Lake County, Indiana – official county government information
- Indiana DNR Lake Michigan Coastal Program – official coastal-region information for northwest Indiana
- U.S. Census Bureau TIGER/Line Shapefiles – county-boundary reference for the Lake County map framework
- USGS National Hydrography – hydrography reference for the Calumet rivers, Deep River, creeks, and inland lakes
- USGS 3D Elevation Program – source terrain data for comparing the shoreline lowland and central uplands
Green Map creates custom-edited map images using open geographic data sources such as geoBoundaries, Natural Earth, OpenStreetMap, and government open data.
These maps are edited visual materials, not raw data files, and are provided for education, documents, presentations, and graphic reference.