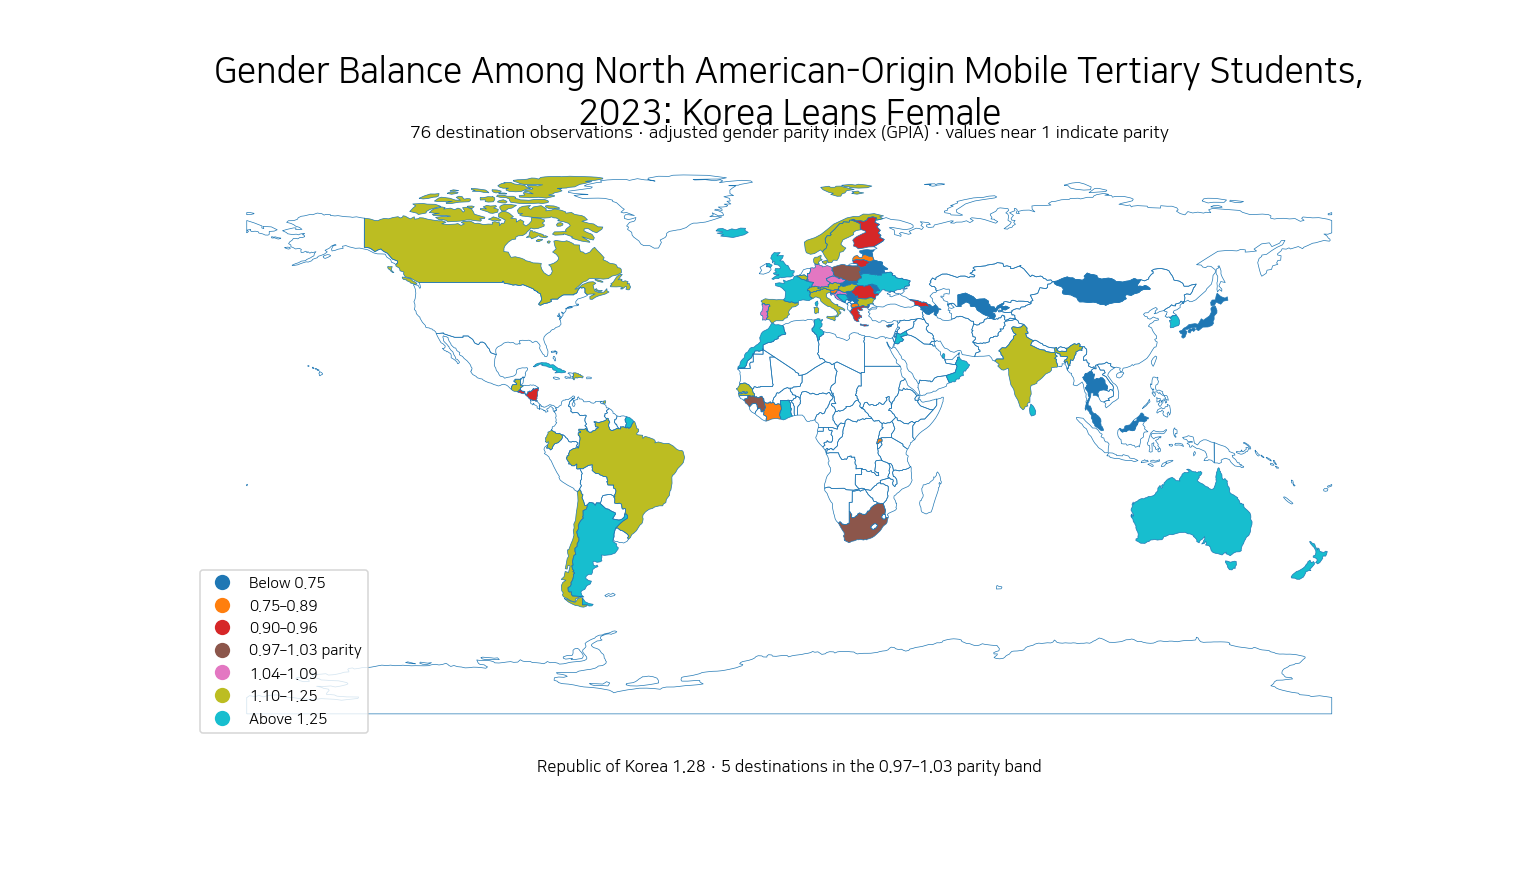
UNESCO Institute for Statistics (UIS) data for 2023 show how the gender balance of internationally mobile students from Central and Eastern Europe differed across destination countries. The measure is the adjusted gender parity index (GPIA), not a student count. It is bounded between 0 and 2, with 1.00 as the parity reference point. UIS generally treats values from 0.97 to 1.03 as the gender-parity range.
The dataset contains 73 country and area observations for 2023. Of these, 8 fall within 0.97–1.03, 21 are below 0.97 and 44 are above 1.03. That distribution shows that most observed destinations lie outside the narrow parity band, but it does not tell us which destinations host the largest numbers of students. A GPIA of 2.00 is not a larger student population than a GPIA of 1.10.
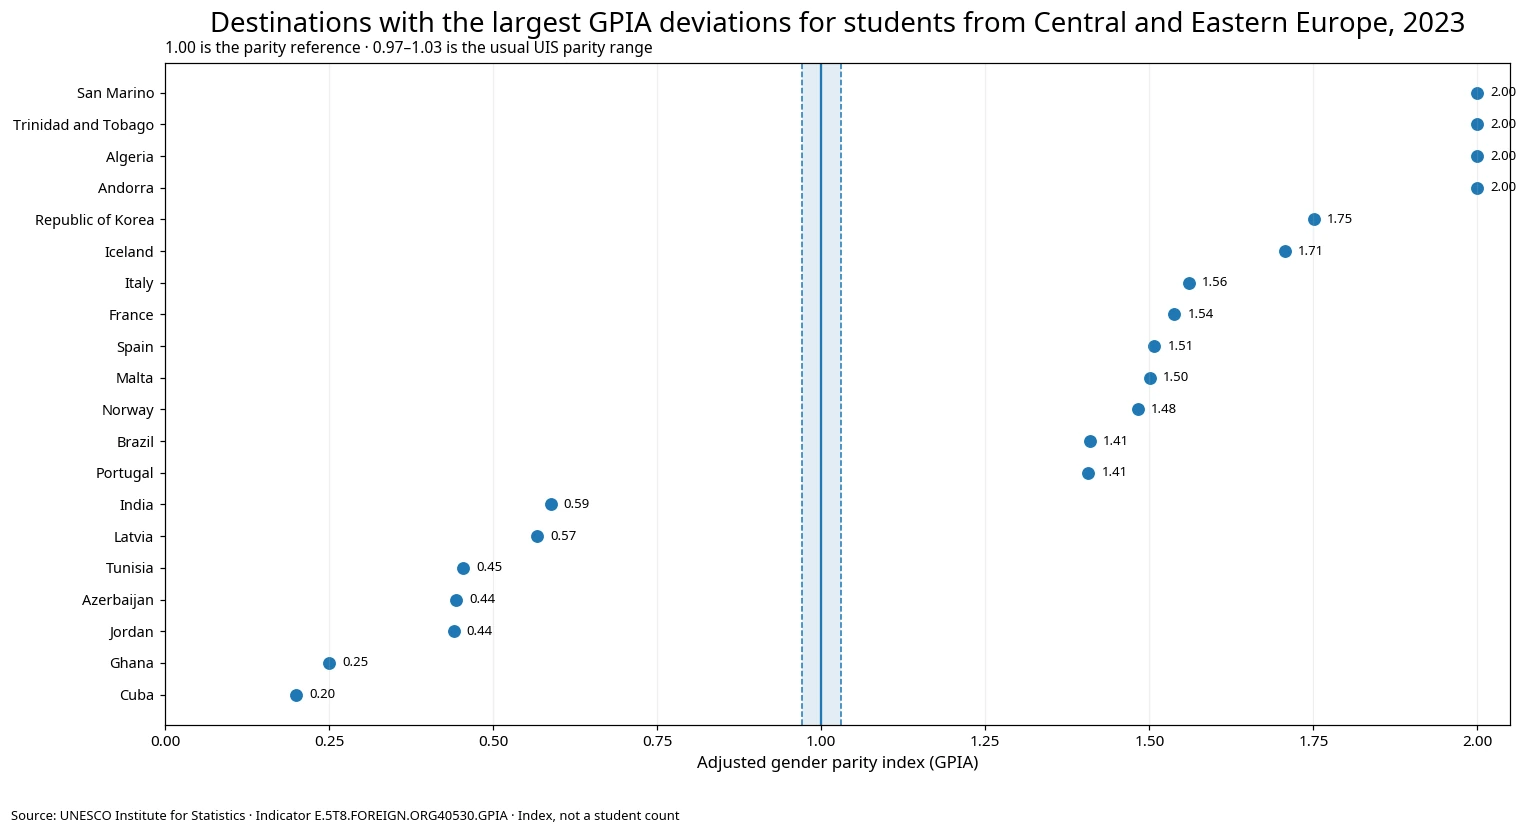
Table of Contents
Why GPIA is read around a reference value of 1
The standard gender parity index divides the female value of an indicator by the male value. A value of 1 means the two are equal. The ordinary ratio, however, is not symmetric around 1 when values rise above the reference point. UIS therefore uses an adjusted version that keeps the scale between 0 and 2 and represents disadvantages on a more comparable scale on either side of 1.
For this indicator, the underlying measure is the number of internationally mobile students from Central and Eastern Europe. A GPIA below 1 therefore points toward a lower female value than male value in the destination, while a value above 1 points toward a higher female value. Values between 0.97 and 1.03 are commonly interpreted by UIS as parity. That threshold describes the ratio, not the cause of any difference.
A ratio can become extreme even when the underlying population is small. Without the separate female and male counts, a value such as 0.20 or 2.00 cannot be translated into an absolute number of students. The dataset supplied for this article contains the GPIA only, so no student totals or sex-specific counts are inferred from the index.
Only 8 of 73 destinations fall inside the parity band
Eight destinations, or about 11.0% of the observations, lie between 0.97 and 1.03. Another 21 destinations (28.8%) are below 0.97, while 44 (60.3%) are above 1.03. By destination count, values on the female-higher side are more common in this 2023 extract.
The unweighted mean across the 73 destination indices is 1.127, and the median is 1.130. Both are above 1, but neither should be interpreted as the overall gender ratio of all Central and Eastern Europe-origin students. Each destination contributes one index regardless of whether it hosts a handful of students or a very large population.
Exactly 4 destinations have a value of 1.00, 22 are below 1 and 47 are above 1. The practical parity interpretation is broader than exact equality, which is why countries with values such as 0.998, 1.007 or 1.011 belong in the same parity band rather than being described as meaningful gender gaps.
The lowest and highest values are ratio extremes, not enrollment rankings
The observed minimum is 0.20 and the maximum is 2.00. Cuba at 0.20 and Ghana at 0.25 sit far below the parity reference, while Andorra, Algeria and several other destinations reach the adjusted index ceiling of 2.00. These are strong ratio deviations, but the GPIA alone does not reveal whether the underlying student populations are large or small.
Ukraine is around 0.605, Bulgaria is 0.998, Canada 1.007 and Thailand 1.011. France at 1.538, Italy at 1.560 and Iceland at 1.706 are much farther above the parity reference. The values show direction and relative distance from parity within the adjusted scale.
The Republic of Korea has a GPIA of 1.751, placing it on the female-higher side of the index. That observation is not evidence that it hosts more Central and Eastern Europe-origin students than other destinations, because the index contains no information about total student volume.
Selected destination values illustrate the three interpretation zones
The table below is not an enrollment ranking. It selects destinations from the low side, the parity band and the high side to make the index easier to read. Two destinations can have similar GPIA values while having very different student counts, so no size comparison is attached to these index values.
| Destination | 2023 GPIA | Interpretation |
|---|---|---|
| Cuba | 0.200 | Female value lower |
| Ghana | 0.250 | Female value lower |
| Jordan | 0.440 | Female value lower |
| Azerbaijan | 0.443 | Female value lower |
| Tunisia | 0.455 | Female value lower |
| Ukraine | 0.605 | Female value lower |
| Bulgaria | 0.998 | Parity range |
| Canada | 1.007 | Parity range |
| Thailand | 1.011 | Parity range |
| South Africa | 1.022 | Parity range |
| Greece | 1.402 | Female value higher |
| Argentina | 1.402 | Female value higher |
| France | 1.538 | Female value higher |
| Italy | 1.560 | Female value higher |
| Iceland | 1.706 | Female value higher |
| Republic of Korea | 1.751 | Female value higher |
| Andorra | 2.000 | Female value higher |
| Algeria | 2.000 | Female value higher |
Values below 0.97 are classified here as female-lower, 0.97–1.03 as the parity range, and values above 1.03 as female-higher. Those labels summarize the direction of the underlying female-male ratio. They do not identify the mechanisms that produced the difference.
The Central and Eastern Europe origin label is a regional aggregate
This indicator does not fix one origin country. It groups students whose origin is Central and Eastern Europe and then reports a destination-level gender parity index. The dataset therefore cannot separate the gender balance of students originating in Poland, Ukraine, Romania, Belarus or other individual countries within the regional grouping.
A destination may itself be located in Central or Eastern Europe. That does not turn the observation into a domestic-student statistic, because internationally mobile students are defined around cross-border movement for education. The measure is also not the gender composition of all foreign citizens or of all students enrolled in the destination.
The regional aggregation also limits causal interpretation. A destination’s high or low GPIA does not show which origin countries contributed most, how many students were involved, or whether scholarships, visa rules, language, migration networks or academic fields explain the observed ratio. Those questions require additional data.
A value of 2.00 is the upper bound of the adjusted scale
UIS bounds the adjusted gender parity index between 0 and 2. A reported value of 2.00 therefore sits at the top edge of the adjusted scale. It should not automatically be read as proof that every student was female or used to reconstruct exact female and male counts, because those underlying counts are not present in this dataset.
The same caution applies to very low values. They indicate a strong imbalance toward a lower female value, but not the absolute number of students affected. Ratio indicators compress information, and extreme ratios can occur in small populations as well as larger ones.
For that reason, the visual in this article focuses on distance from the parity reference rather than using a choropleth or volume-style graphic that could be mistaken for student counts. The chart is meant to show the shape of the index, not the size of international student flows.
A single 2023 cross-section cannot establish a trend or a cause
All 73 observations use the same 2023 reference year, which makes cross-destination comparison straightforward. The dataset can show which destinations are closer to or farther from gender parity at that point in time.
It cannot show whether a destination moved toward parity relative to 2022 or whether a long-term shift is occurring. A trend requires comparable GPIA observations across multiple years. Similarly, explaining the differences would require evidence on fields of study, institution type, scholarships, visa policy, migration links, costs and other conditions.
The fact that more destinations sit above 1.03 than below 0.97 also should not be transformed into a claim about the overall gender composition of all mobile students from the region. The country indices are unweighted, so a small destination counts just as much as a large destination when tallying how many observations fall on each side of parity.
Data source and calculation method
Country values come from UNESCO Institute for Statistics indicator E.5T8.FOREIGN.ORG40530.GPIA, “Inbound internationally mobile students from Central and Eastern Europe, adjusted gender parity index (GPIA) (UIS estimate),” using the 2023 NATIONAL observations in this comparison. The candidate metadata also carries a trailing “(number)” label, but the actual values are a 0–2 adjusted parity index, so the public article treats the unit as an index rather than a student count.
- UNESCO UIS official API — indicator E.5T8.FOREIGN.ORG40530.GPIA
- UNESCO UIS — explanation of the Adjusted Gender Parity Index
The mean, median, counts inside and outside the parity band, and deviation comparisons are calculated directly from the 73 non-missing observations. Missing destinations are not zero-filled, and no female or male student counts are inferred. The 0.97–1.03 parity interval follows the standard UIS interpretation of GPI/GPIA values.
The most defensible conclusion is that destination-level gender parity varied widely in the 2023 observations and that only a minority of destinations fell inside the narrow parity band. Student volume, origin-country composition, time trends and the causes of the differences remain separate questions that require additional data.
Frequently Asked Questions
What does a GPIA of 1 mean?
It is the reference point where the female and male values are equal. UIS generally treats 0.97–1.03 as the gender-parity range.
Does a GPIA above 1 mean the female student value is higher?
For this student-count-based indicator, yes: it indicates that the female value is higher than the male value. The index alone does not provide the actual female and male counts.
Does a GPIA of 2.00 mean the destination has the most students?
No. 2.00 is the upper bound of the adjusted parity scale, not an enrollment total. Student volume requires separate count data.
Can the 2023 cross-section show whether gender parity is improving?
No. A one-year comparison shows differences across destinations at that time. A trend requires comparable observations across multiple years.
Related Maps
Green Map creates custom-edited map images using open geographic data sources such as geoBoundaries, Natural Earth, OpenStreetMap, and government open data.
These maps are edited visual materials, not raw data files, and are provided for education, documents, presentations, and graphic reference.