Kent County sits in the middle of Delaware, with Dover as its main urban anchor and Delaware Bay shaping the entire eastern side of the county. The maps on this page make that geography easier to see from several angles: the general county map places towns and highways inside the boundary, the city index highlights the most prominent population centers, the terrain-and-water map follows rivers to the bay, and the elevation map shows how the western interior stands slightly higher than the coastal side. After reviewing them on screen, you can download the same four maps as high-resolution JPG files for printing, presentations, or local reference.
Kent County government describes Dover as both the county seat and the capital of Delaware. The county is bordered by New Castle County to the north, Sussex County to the south, Maryland to the west, and Delaware Bay to the east. That arrangement explains the map’s distinctive outline: a straighter western edge, a much more irregular bay-facing side, and a long north–south span that carries the viewer from Smyrna and Clayton through Dover to Harrington and the Milford area. The maps are most useful when those broad relationships are understood first rather than treating every road or river label as an isolated feature.
Table of Contents
Dover anchors the middle of a long north–south county
The general map places Dover near the center of Kent County, where several roads converge and the settlement pattern becomes noticeably denser. Cheswold and Smyrna lie to the north, with Clayton farther northwest. Immediately south of Dover are Wyoming and Camden, followed by Felton and Harrington farther down the county. Frederica and Bowers provide useful eastern reference points closer to Delaware Bay, while Milford appears near the southeastern edge. This arrangement gives the county a clear central focus without turning Dover into the only place that matters on the map.
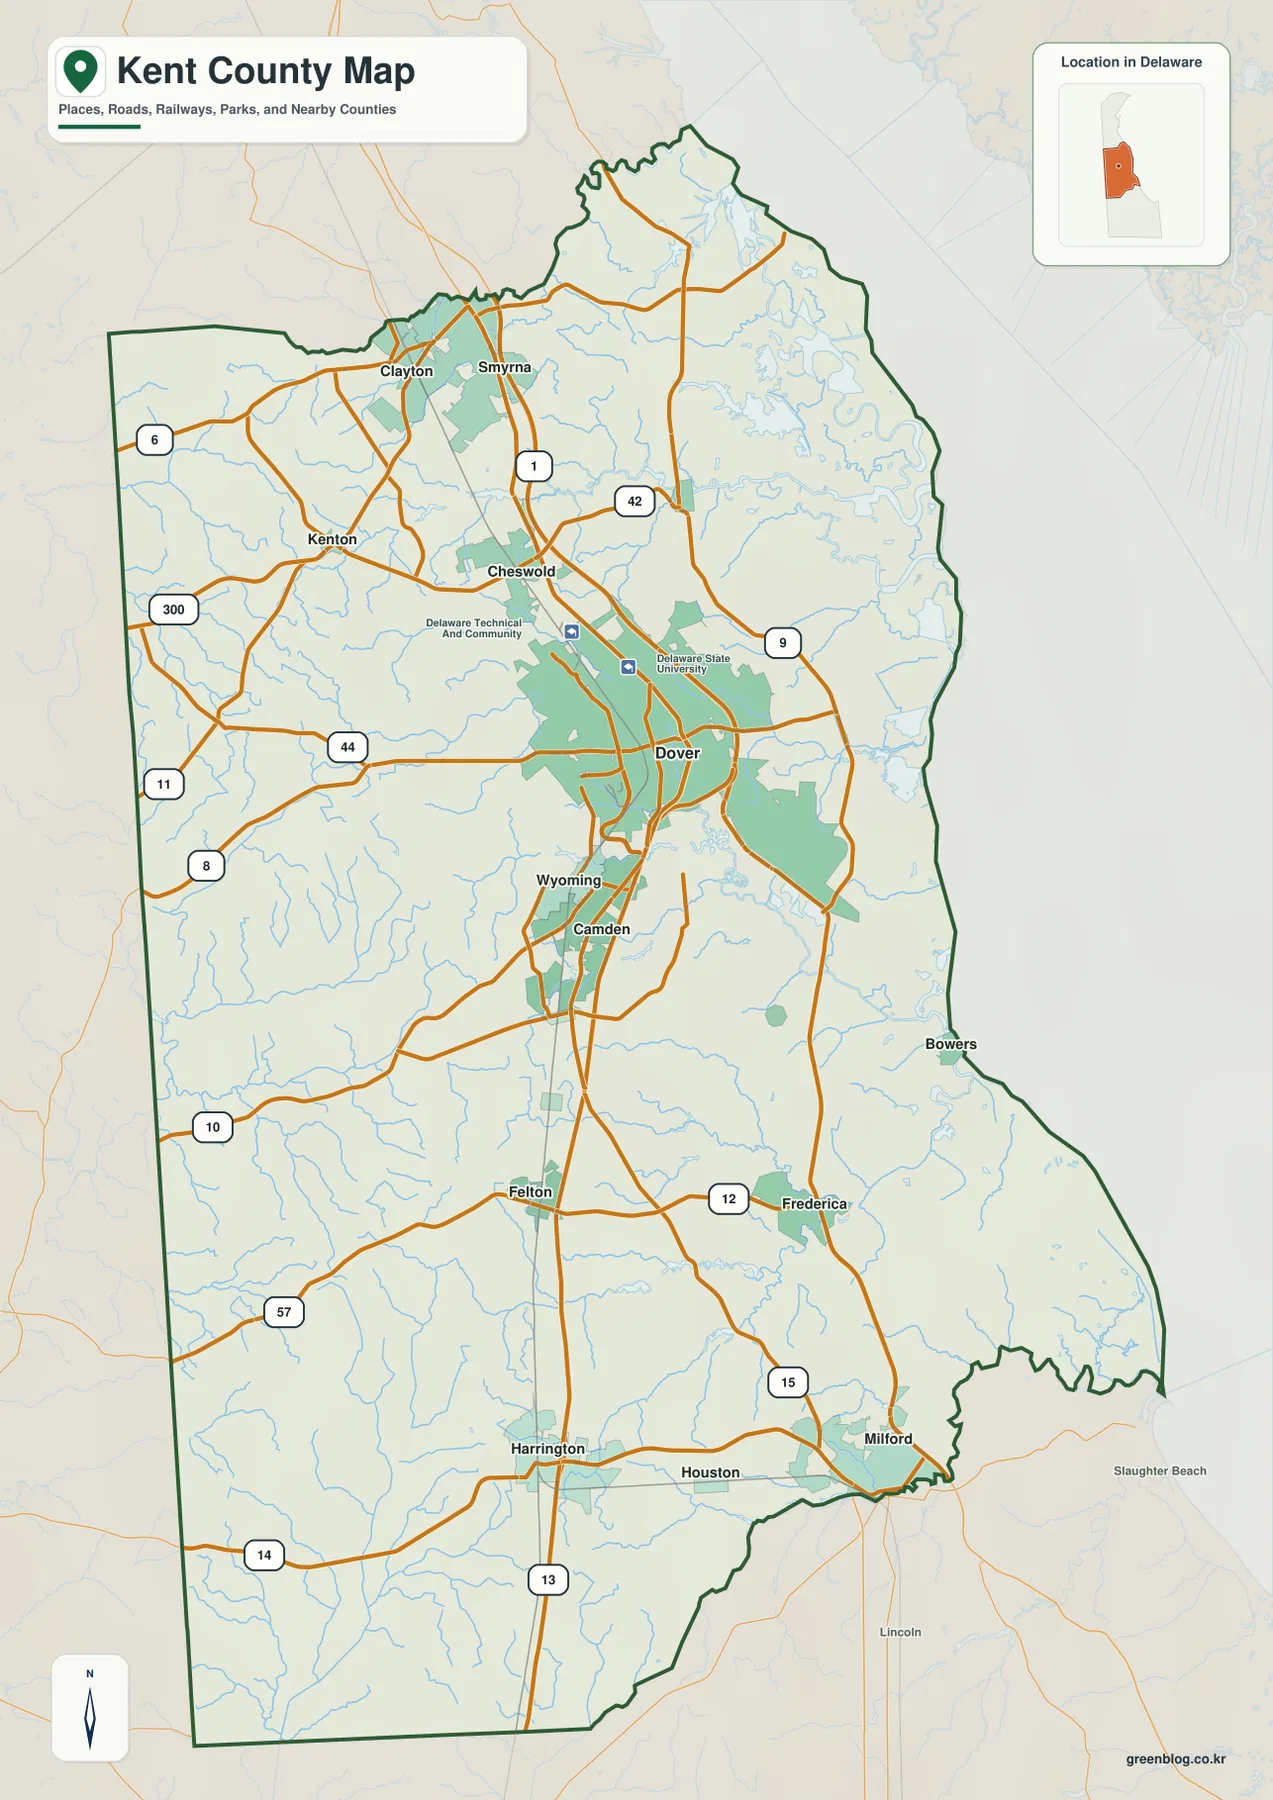
The road pattern reinforces that central position. Delaware Route 1 runs down the eastern side of the Dover area, while U.S. 13 provides a strong north–south reference through Dover, Camden, and toward Harrington. Routes 8 and 9 extend west and east from the central area, and the map also labels routes such as 42, 44, 10, 12, 14, 15, 57, and 300 in different parts of the county. The purpose is not turn-by-turn navigation. Instead, the road network helps explain which towns sit on the same corridor and how the central urban area connects to the bay side and the more rural western interior.
Delaware State University is labeled in the Dover area, providing a useful orientation point inside the county’s densest cluster of roads and mapped development. Once Dover is located, Camden and Wyoming are easy to place just to the south, while Cheswold marks the next step north before Smyrna. The same map then stretches much farther south to Felton, Harrington, Houston, and the Milford vicinity, showing why a single Kent County map needs to cover a fairly long vertical distance.
The outline also changes character from west to east. The Maryland side is comparatively straight, while the Delaware Bay side bends around tidal rivers, creeks, and low coastal land. Bowers and Frederica help locate that eastern half of the county, which becomes especially important when the water and elevation maps are viewed later. Remembering this contrast makes the other layers easier to interpret: the most intricate waterways and the lowest terrain are concentrated toward the bay-facing side rather than the western edge.
The city index separates the Dover cluster from the northern Smyrna–Clayton pair
The city-distribution map removes much of the road detail and focuses on six major places. In the index printed on the map, Dover is ranked first with a value of 39,837. Smyrna is second at 13,165, followed by Clayton at 4,222, Camden at 4,106, Harrington at 3,838, and Cheswold at 2,143. These are the values carried by the supplied city map and are best treated as the map’s ranking reference rather than as a live population counter. Their main value here is to show the relative prominence and spacing of the mapped communities.
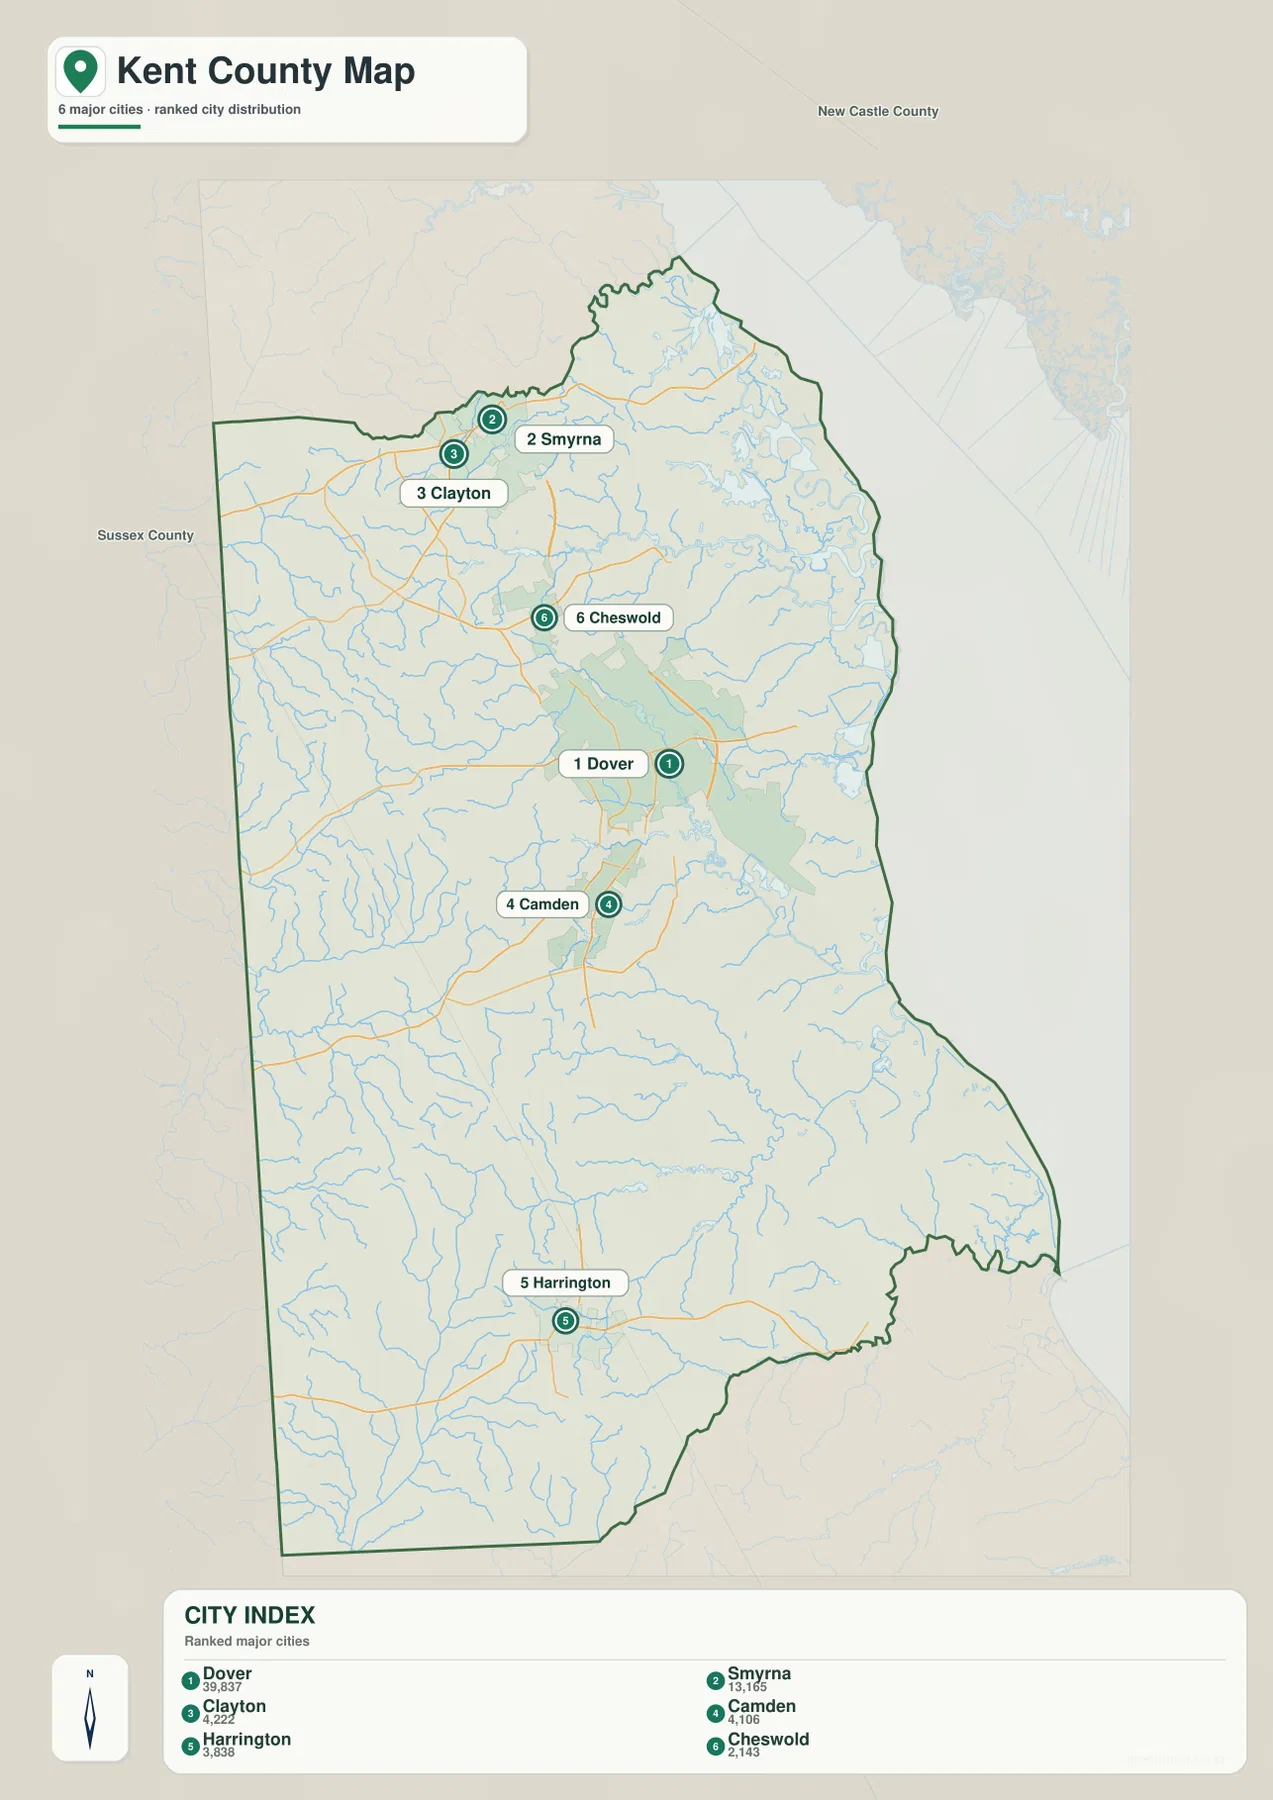
The geographic spacing is as important as the numbers. Smyrna and Clayton form a close northern pair, while Cheswold sits between that pair and Dover. Camden lies directly south of Dover, making the central cluster feel much tighter than the distance from Dover to Harrington. Harrington, by contrast, stands well to the south and gives the lower half of the county a separate urban reference point. Reading the city map this way is more useful than memorizing a list because it reveals the county as a series of distinct clusters along a north–south span.
This simplified city view is useful when a full road map feels too busy. A reader can start with Dover, move north through Cheswold to Smyrna and Clayton, then return south through Camden to Harrington. After those anchors are clear, the general map becomes easier to read because smaller names such as Kenton, Felton, Houston, Frederica, Bowers, and Milford can be placed around the better-known reference points. The city map does not claim to show every municipality or legal municipal boundary, so county GIS or local government mapping should be used when those details are required.
For a report or classroom handout, this map works well as a compact location guide beside the more detailed county map. The index tells the reader which places the map emphasizes, while the plain background makes the spacing easier to compare. That is especially helpful in Kent County because Dover dominates the center, yet the county continues a substantial distance both north and south of the capital.
A chain of rivers links the interior to Delaware Bay
Water is the defining feature of the eastern side of Kent County. The terrain-and-water map labels Delaware Bay along the coast and shows a sequence of rivers entering the bay from north to south. Smyrna River appears near the northern tip, followed by the Leipsic River and Mahon River. Farther south, the Little River and St. Jones River occupy the Dover-area portion of the bay shore, while the Murderkill River crosses the southern half of the county and the Mispillion River reaches the coast near the Milford area. The result is not one dominant river valley but several short coastal systems spread along the county’s eastern side.
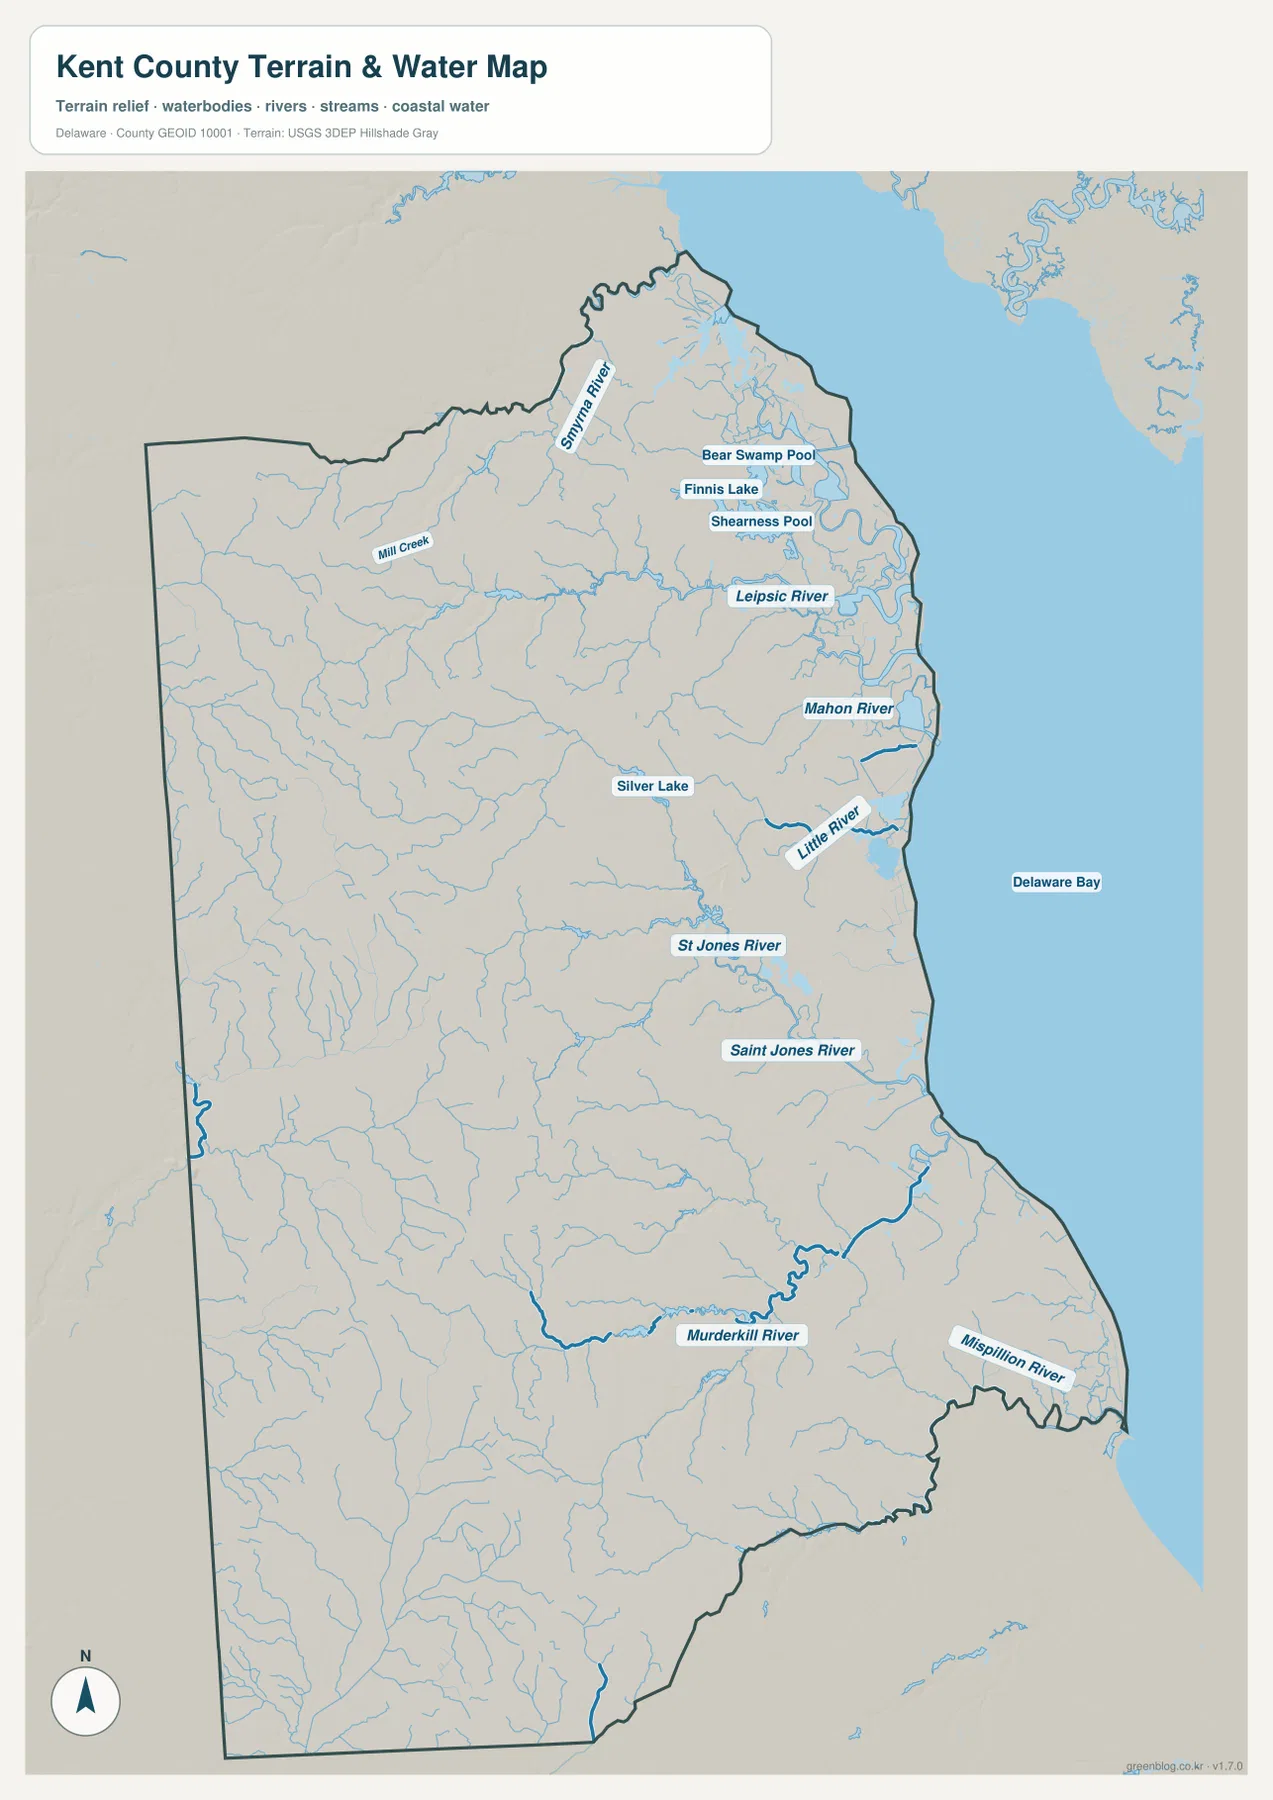
Several smaller named waters add detail to that pattern. Bear Swamp Pool, Finnis Lake, and Shearness Pool appear close together in the northeast, while Silver Lake is labeled nearer Dover. Mill Creek is marked in the western half, and a dense network of smaller tributaries covers much of the map. The eastern edge becomes increasingly intricate where streams and tidal channels meet the bay, which explains why the county boundary looks far more irregular there than along the Maryland side.
The St. Jones River is particularly useful for connecting the city map with the coastal landscape. Delaware’s Department of Natural Resources and Environmental Control describes the St. Jones Reserve as lying south of Dover on the north shore of the St. Jones River and including part of Delaware Bay. On the map, Dover sits inland from that river-and-bay setting. Following the St. Jones eastward therefore provides a simple way to understand how the county’s central city relates to tidal water and coastal natural areas without assuming that Dover itself is directly on the bay shoreline.
The Murderkill River provides a similar reference farther south, and the Mispillion River helps orient the Milford side of the county. Those rivers also show why the water map should be read as a regional hydrography reference, not as a flood-hazard or navigation chart. It does not provide legal parcel lines, regulated wetland boundaries, flood insurance zones, channel depths, or boating routes. Kent County GIS and the appropriate state or federal datasets are better sources when those specific questions matter.
Elevation falls from the western interior toward the bay-facing lowlands
Kent County is low overall, but the elevation map still shows a strong west-to-east contrast. Broad brown and tan areas cover much of the western interior, indicating relatively higher ground within the county. Greens become more common around Dover and dominate the eastern side toward Delaware Bay. The difference is gradual rather than mountainous: the map is showing subtle relief across a coastal county, not a transition from plains to high peaks.
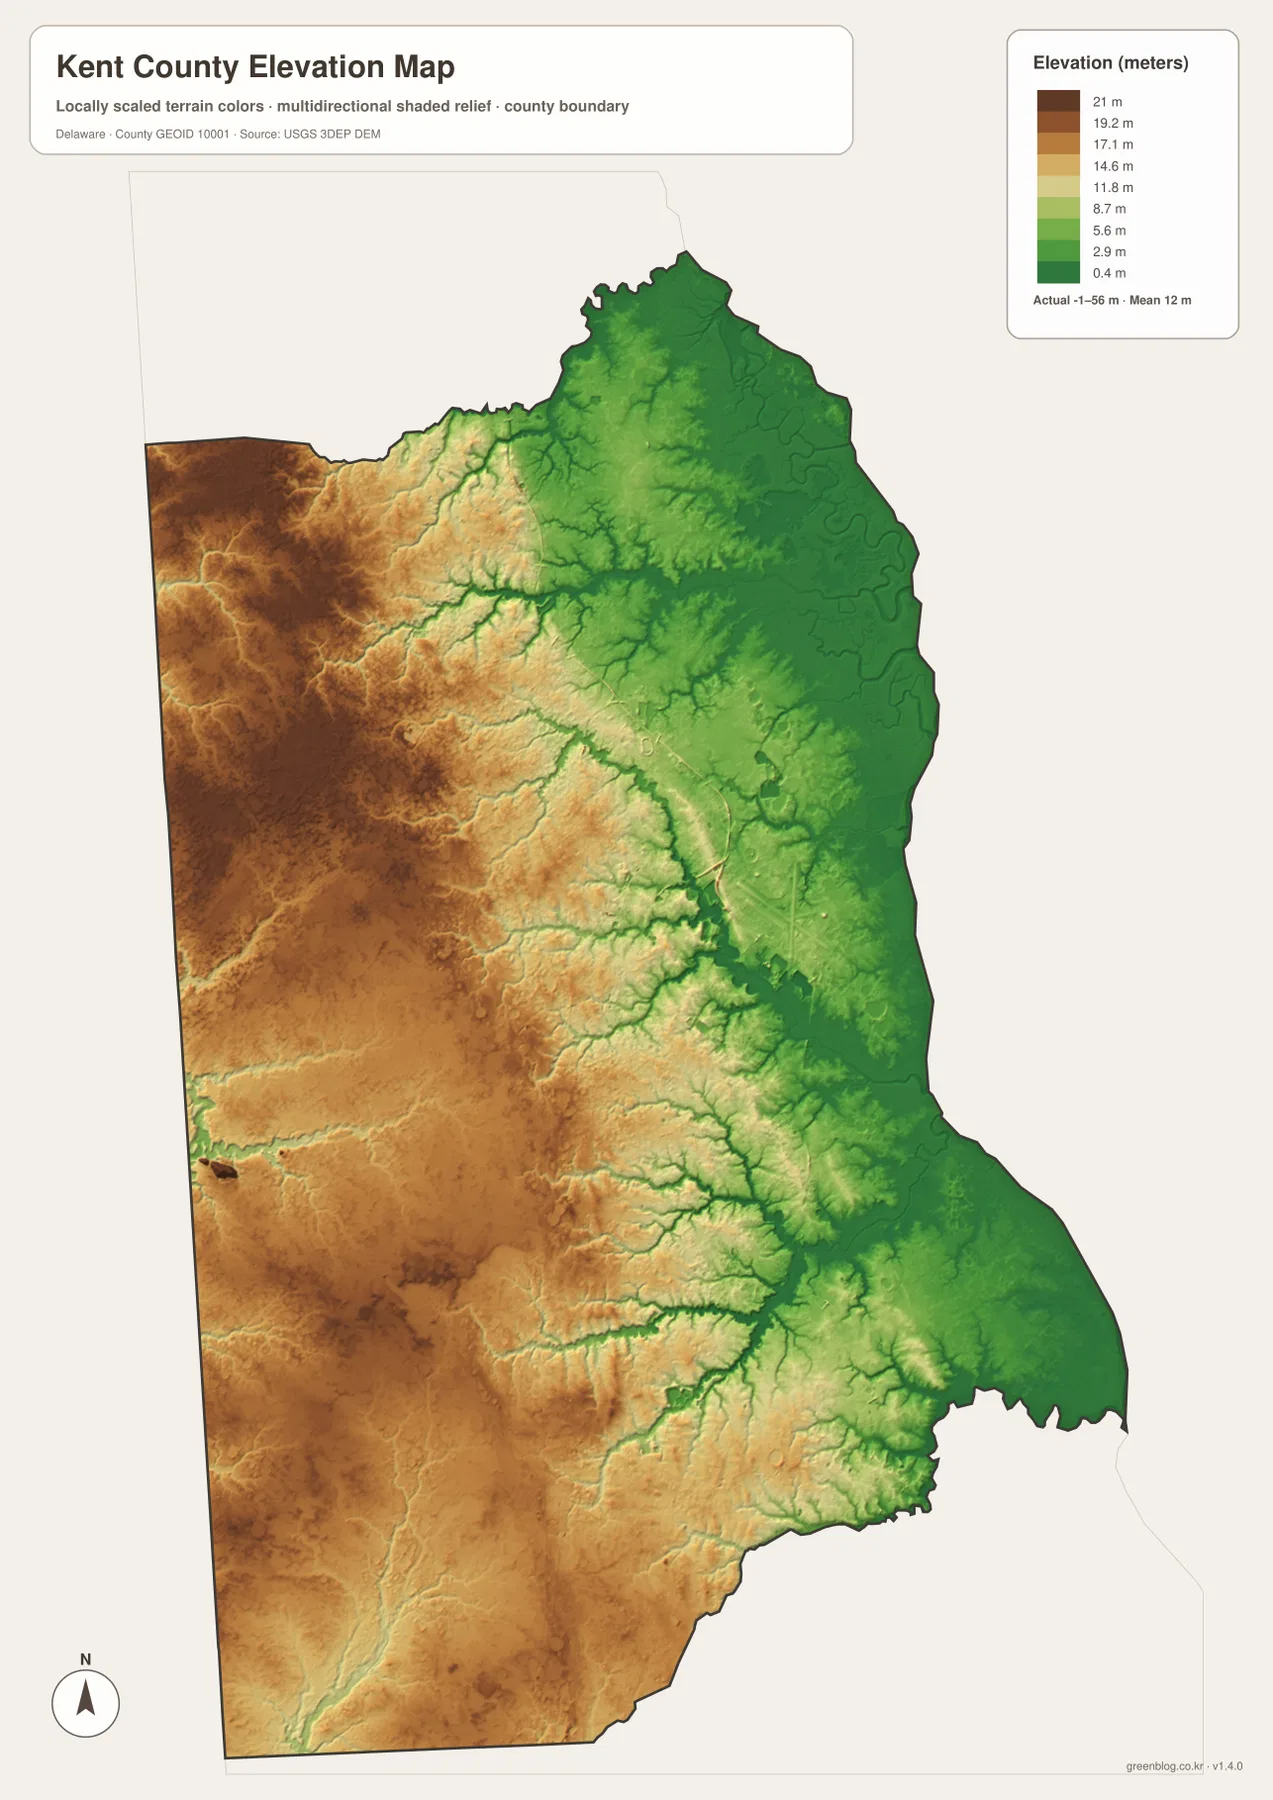
The map annotation reports an actual elevation range of about -1 to 56 meters and a mean near 12 meters. Its locally scaled colors are designed to make small differences visible, which is why the western side can look dramatically higher than the east even though the absolute elevations remain modest. The map is excellent for regional comparison, but it should not be treated as survey-grade or engineering-grade measurement. Exact site elevations should be checked against U.S. Geological Survey elevation data or professional survey information.
One of the most useful details appears where low green corridors extend inland along streams. The water map shows many tributaries feeding the St. Jones, Murderkill, and other rivers, while the elevation map shows lower channels cutting through the slightly higher interior. Placing the two maps side by side makes the relationship clear: waterways tend to occupy the lower parts of the local landscape, and those low corridors broaden as they approach the eastern coastal side.
The western edge is comparatively higher, but it is not a single flat plateau. Narrower low lines interrupt the brown and tan surface wherever creeks and small drainageways cross the interior. That texture matters because it keeps the reader from reducing Kent County to a simple “high west, low east” diagram. The larger trend is real and easy to see, yet the interior still contains many shallow valleys that connect eventually to the county’s river systems.
Choosing the right map for a Kent County question
The four files answer different practical questions without requiring specialized GIS software. Use the general county map when you need towns, major roads, the overall boundary, and quick orientation around Dover. Use the city index when the main task is comparing the locations of Dover, Smyrna, Clayton, Camden, Harrington, and Cheswold without the distraction of every road label. The terrain-and-water map is the best choice for Delaware Bay, named rivers, lakes, and stream networks, while the elevation map is the clearest view of the higher western interior and lower eastern side.
Combining two maps can be more informative than forcing one map to do everything. A local geography lesson could place the county map beside the water map to show how Dover sits inland from the St. Jones River and Delaware Bay. A terrain discussion could pair the water and elevation maps so that river corridors can be compared with low ground. A transportation or settlement overview could use the general map together with the city index to explain why Dover is the central anchor even though important communities continue well beyond it to both the north and south.
The maps are intended as clear geographic reference products, not substitutes for specialized official systems. Parcel research, zoning, flood zones, property addresses, and detailed municipal boundaries belong in county or state GIS applications. Engineering elevations require source DEM data or surveying. Route navigation requires a current road-navigation service. Keeping those limits clear makes these files more useful because each map can be used for the job it was designed to do: explain Kent County’s broad layout in a printable, readable form.
The download below contains the same four subjects shown on the page as full-size JPG files. Each image is 2572 by 3638 pixels, giving you more room than the web previews for printing or placing the maps into documents. The ZIP includes one general county map, one city-distribution map, one terrain-and-water map, and one elevation map.
Frequently Asked Questions
Which maps make the Dover-to-Delaware Bay relationship easiest to understand?
Start with the general county map to place Dover within Kent County, then compare it with the terrain-and-water map. The first shows Dover, surrounding communities, and the main roads; the second makes the St. Jones River and other waterways leading toward Delaware Bay much easier to follow. Together they show that Dover is inland rather than directly on the bay shore.
Does the brown area on the elevation map mean Kent County has mountains?
No. Kent County has low relief, and the elevation colors are scaled to make small local differences visible. The map annotation shows an approximate range from -1 to 56 meters with a mean near 12 meters. Brown therefore marks the higher parts of the county, especially toward the western interior, not mountain terrain.
Can the water map be used for flood zones or parcel boundaries?
No. It is a regional reference for Delaware Bay, rivers, streams, lakes, and surrounding terrain. It does not show legal parcel lines, flood insurance zones, regulated wetland boundaries, or navigation depths. Use Kent County GIS and the appropriate state or federal program when those details are required.
Map File Information
Download the same county, city-distribution, terrain-and-water, and elevation maps shown on this page as original high-resolution JPG files in one ZIP archive.
- Included Files: Four A3 high-resolution JPG maps
Related Maps
Sources and reference links
The following official sources are useful for checking county geography, local mapping, hydrography, elevation, and the St. Jones coastal setting. Use the specialized official datasets when a legal, engineering, parcel, or flood-related decision depends on the information.
- Kent County Levy Court – Cities and Towns
- Kent County GIS
- U.S. Census Bureau TIGER/Line Shapefiles
- USGS National Hydrography
- USGS 3D Elevation Program
- Delaware DNREC – St. Jones Reserve
Green Map creates custom-edited map images using open geographic data sources such as geoBoundaries, Natural Earth, OpenStreetMap, and government open data.
These maps are edited visual materials, not raw data files, and are provided for education, documents, presentations, and graphic reference.