Forest is the defining surface on the supplied 2025 map of Wilkes County, Georgia. It accounts for 59.43% of the county, while agriculture covers 16.86%. Grassland adds 7.91%, shrubland 5.53%, developed land 4.74%, wetlands 4.64%, and open water 0.79%. The county is therefore heavily wooded without being uniformly forested: fields, pasture-like open cover, small wet corridors, and one clear developed center interrupt the green background throughout the map.
Four map views are provided on this page so those differences can be checked without treating one layer as a complete description. The WebP images cover current land cover, forest and farmland, impervious surface and developed land, and the 1985–2025 class comparison. The four original 2480 × 1754 JPG files are also grouped in a single ZIP download for presentations, county profiles, classroom work, and side-by-side regional comparison.
Table of Contents
A wooded county with open land threaded through the interior
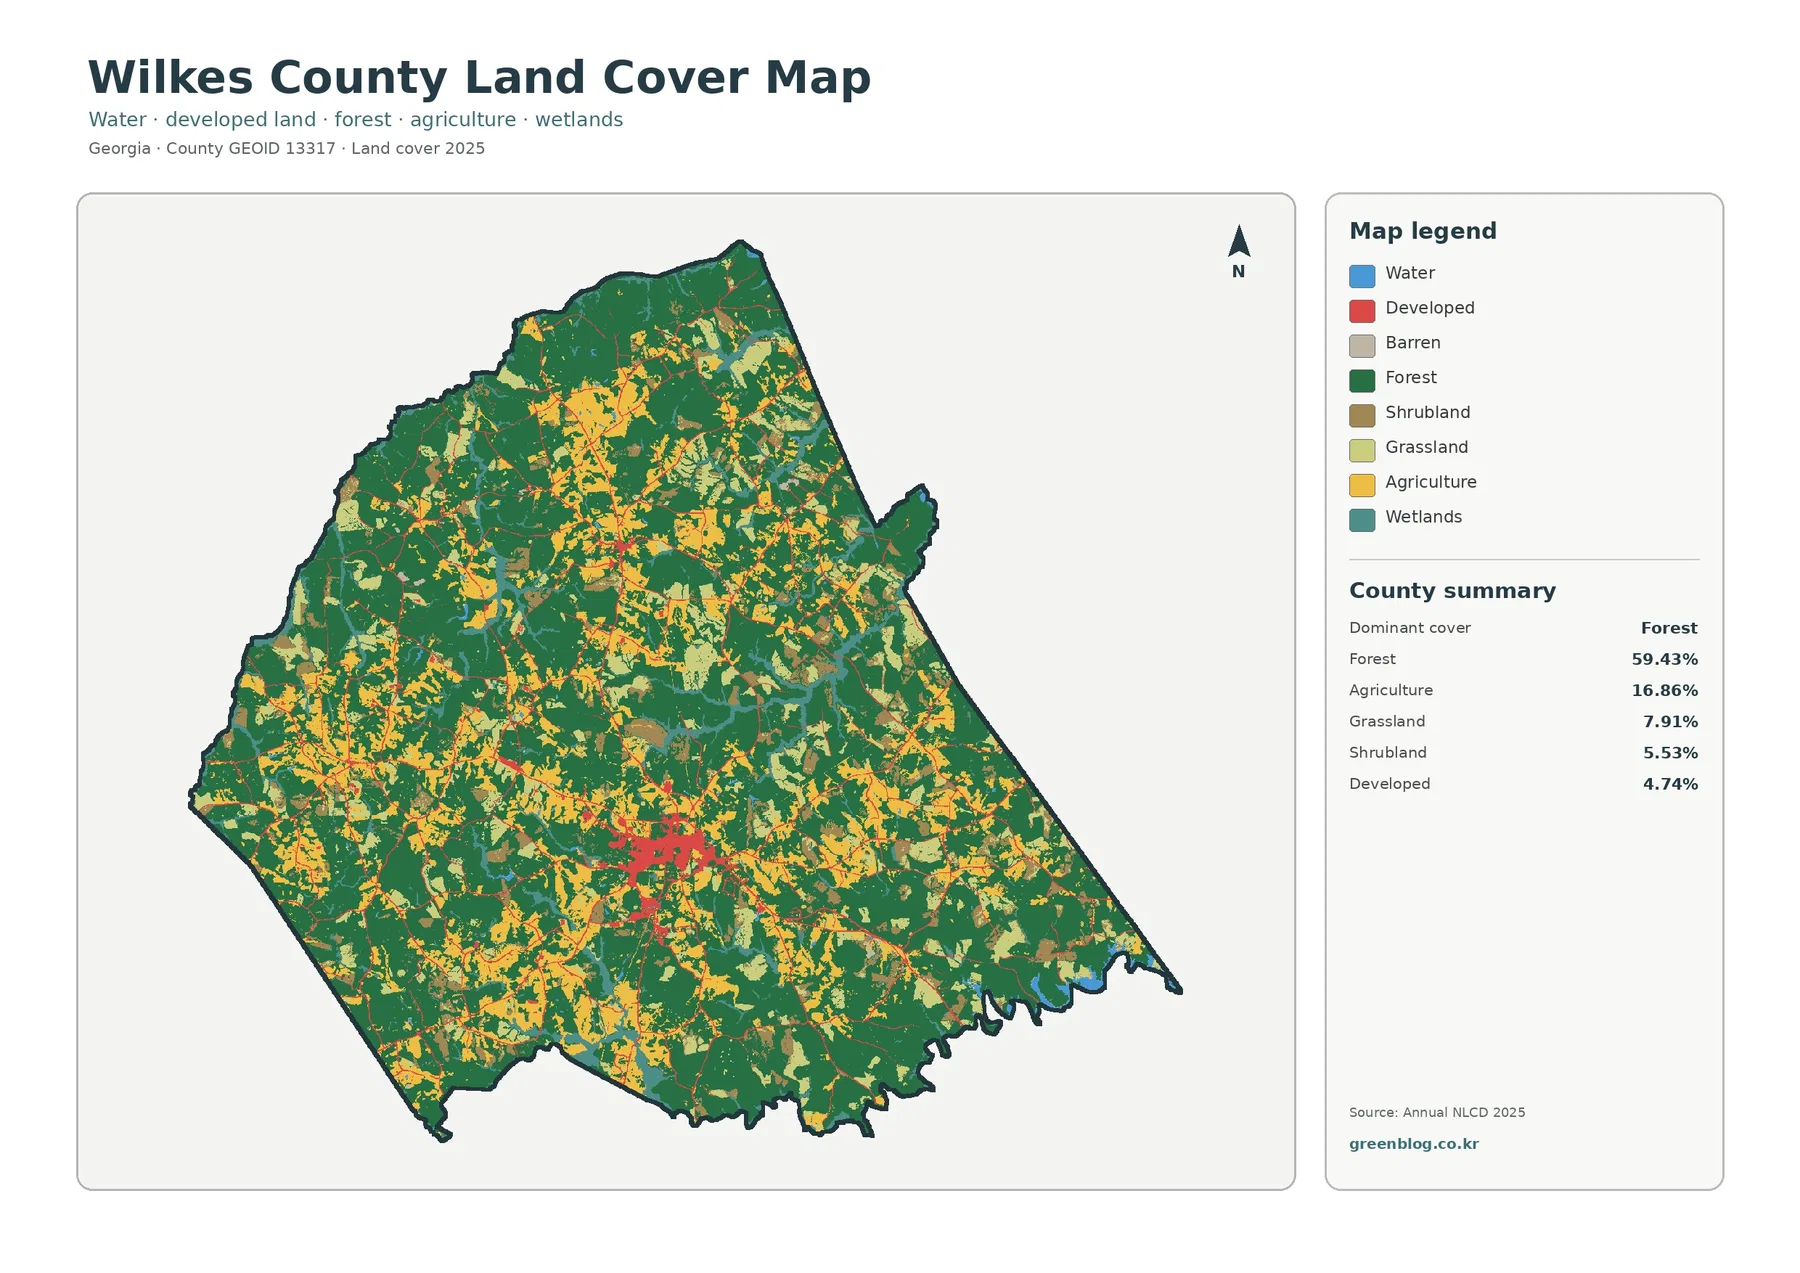
The countywide map does not show one solid forest block. Large dark-green areas dominate the north, east, and southeast, but yellow agricultural patches and lighter open-cover classes appear repeatedly through the west and middle of the county. This matters because the 59.43% forest share could otherwise suggest a much more continuous landscape than the map actually shows. Wilkes County has a forest-majority pattern, yet its working land and open cover form many local breaks and edges.
Developed land represents only 4.74% of the 2025 summary, but its distribution is more concentrated than its percentage. A strong red cluster stands near the center-south portion of the county. Georgia Department of Community Affairs material lists Washington as the county seat, and that principal developed cluster aligns with the Washington area. Smaller developed traces occur elsewhere, but none approaches the same concentration in the supplied countywide view.
Wetlands and open water occupy much smaller shares than forest or agriculture. Wetlands are 4.64% and water is 0.79%. They appear mainly as scattered corridors, irregular patches, and edge features rather than one dominant wetland block. The southeastern boundary contains some of the clearest blue water on the map. Open water and wetland should still be kept separate: the first represents exposed water surfaces, while wetland classes may include vegetated or seasonally saturated ground.
The forest and farmland view reveals a patchwork instead of a simple east-west split
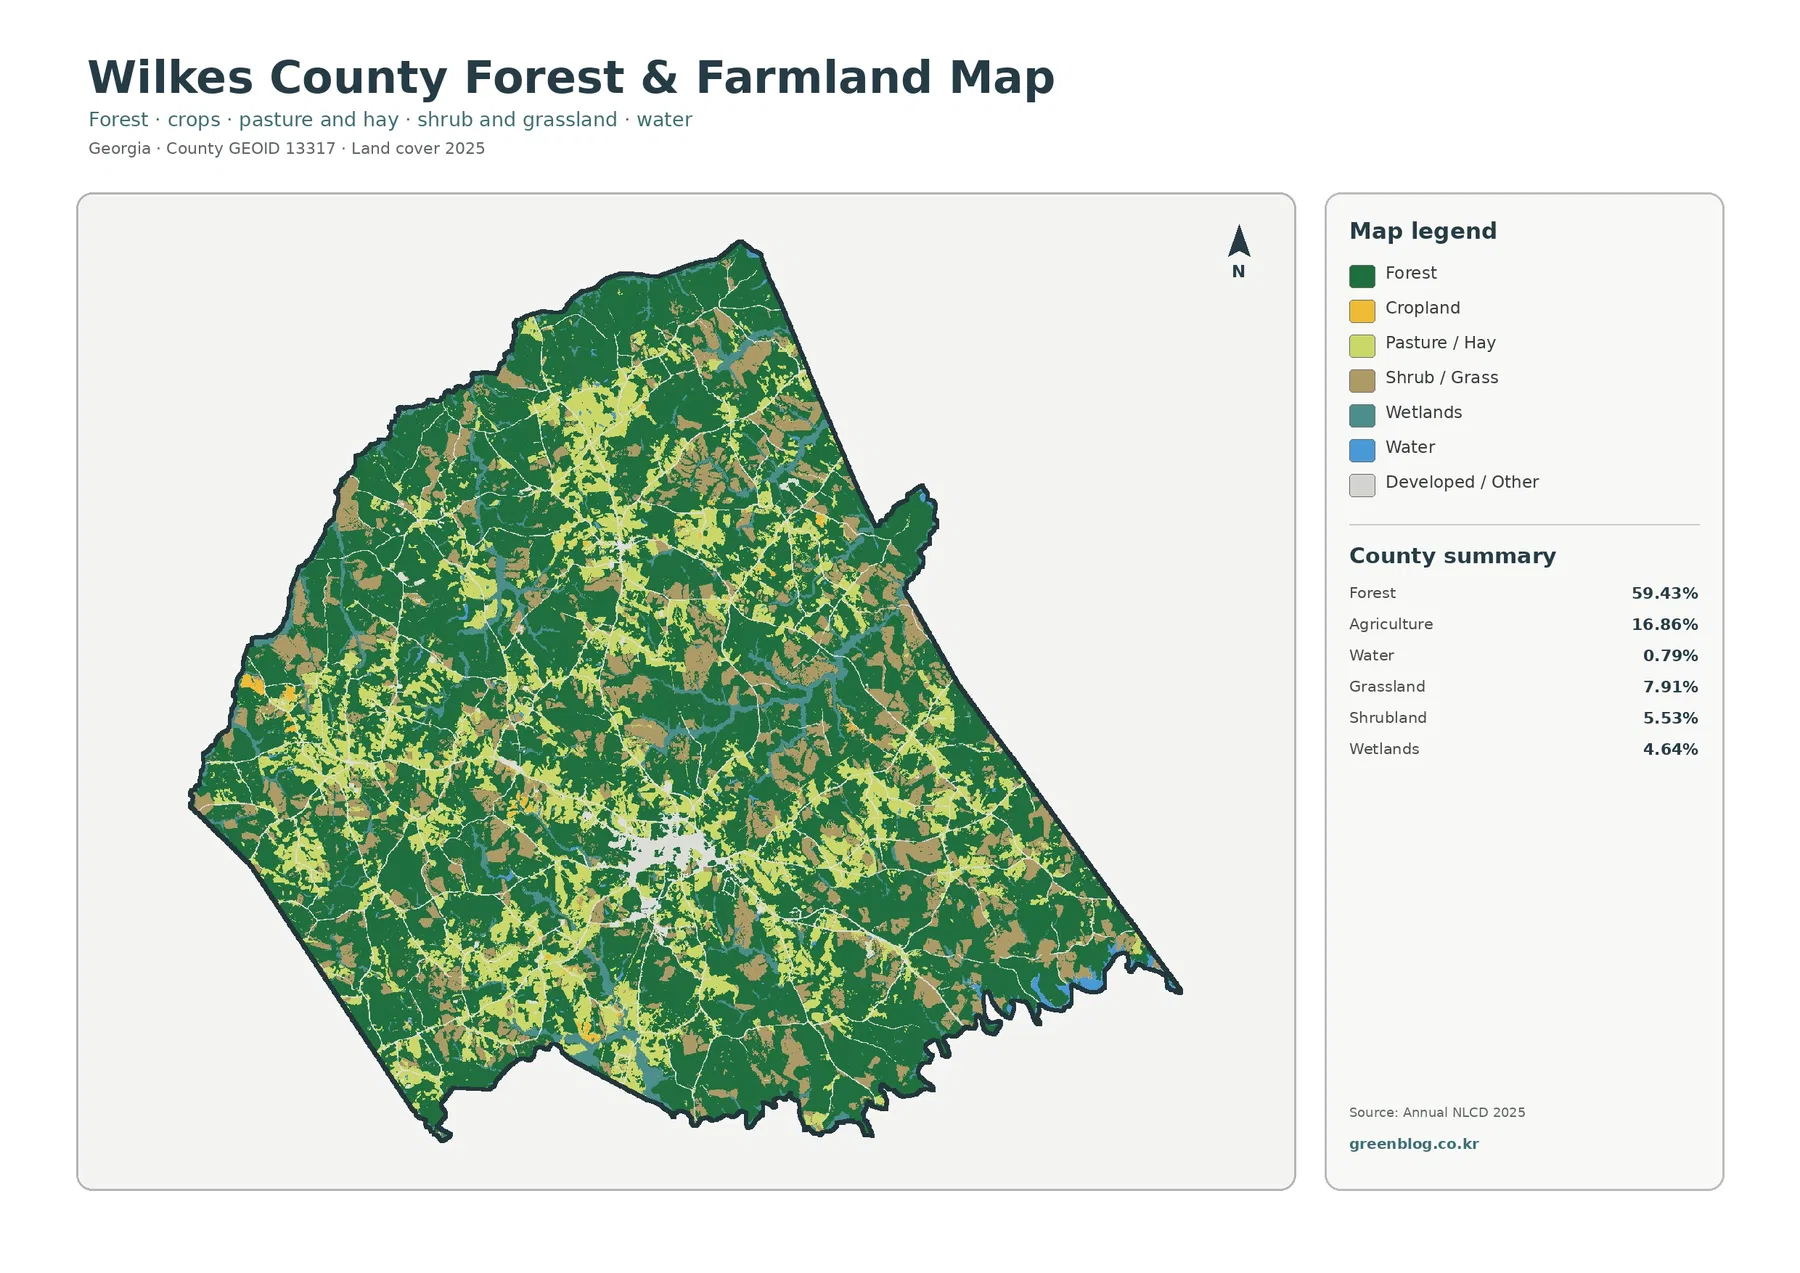
Removing most of the developed detail makes the working-land pattern easier to follow. Forest remains broad and connected, especially toward the eastern and southern sides, but cropland and pasture-like areas recur throughout the interior. Agriculture totals 16.86%, yet the yellow cropland areas are not gathered into one large farming district. They appear as many separate blocks that sit among forest and lighter green pasture or hay cover.
Grassland accounts for 7.91% and shrubland for 5.53%, so open non-forest cover is a meaningful part of the county even before agriculture is counted. On this map those classes often occupy transitions between larger forest blocks and farmed areas. That visual relationship is useful for describing the county, but it should not be converted into a claim about ownership or legal land use. Land cover describes what the surface is classified as, not what a parcel is zoned for or who owns it.
Agriculture also has real local importance beyond its map share. The University of Georgia Cooperative Extension office for Wilkes County reports that county agriculture contributed more than $187 million to the state economy based on the 2023 Georgia Farm Gate Value Report. That economic figure is not equivalent to the 16.86% land-cover share, but it gives useful context for why dispersed agricultural patches on the map matter to the county rather than being incidental open areas.
Hard surfaces are scarce countywide but sharply concentrated around Washington
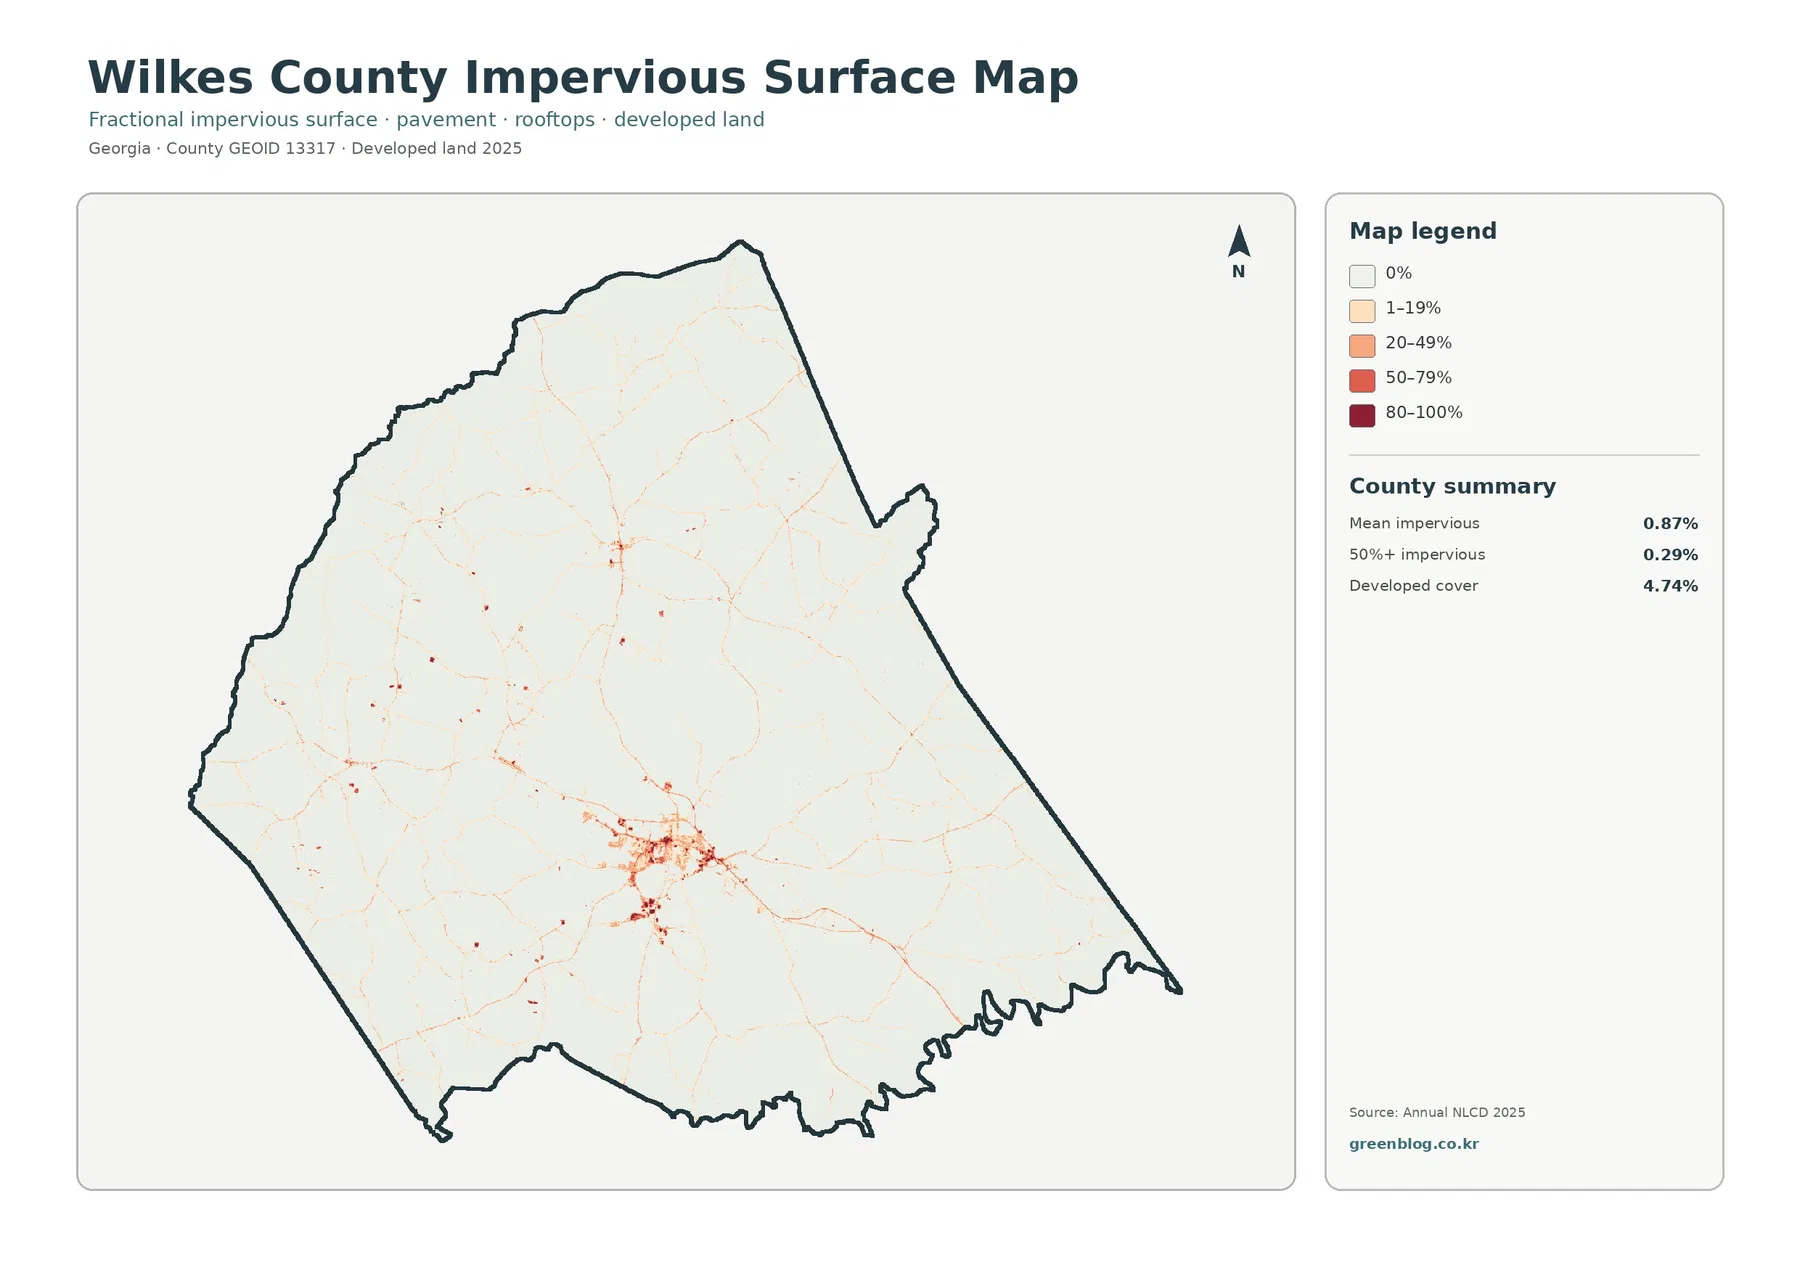
Impervious surface means rooftops, pavement, and similar materials that do not readily absorb rainfall. Wilkes County has a mean impervious value of just 0.87%, and only 0.29% of the county is mapped at 50% impervious or greater. Those averages make sense when the image is viewed as a whole: most of the county is very pale, with narrow road-like lines and scattered small nodes rather than broad urban surfaces.
Washington is the exception. The central-southern cluster contains the strongest orange and red concentrations on the map, making it the clearest built center in Wilkes County. Thin connections extend away from it along transportation corridors, while the surrounding rural landscape quickly returns to low values. The map is therefore more useful for showing concentration than for describing the county with one average number.
The 4.74% developed-land share is higher than the 0.87% mean impervious value because the two measures are not interchangeable. A developed land-cover class can contain lawns, trees, bare soil, drainage areas, and other permeable surfaces around streets and buildings. The impervious product isolates the fraction occupied by harder surfaces. A residential or institutional area can therefore appear as developed land without being covered mostly by pavement and roofs.
The 1985–2025 layer shows widespread endpoint differences, led by forest loss
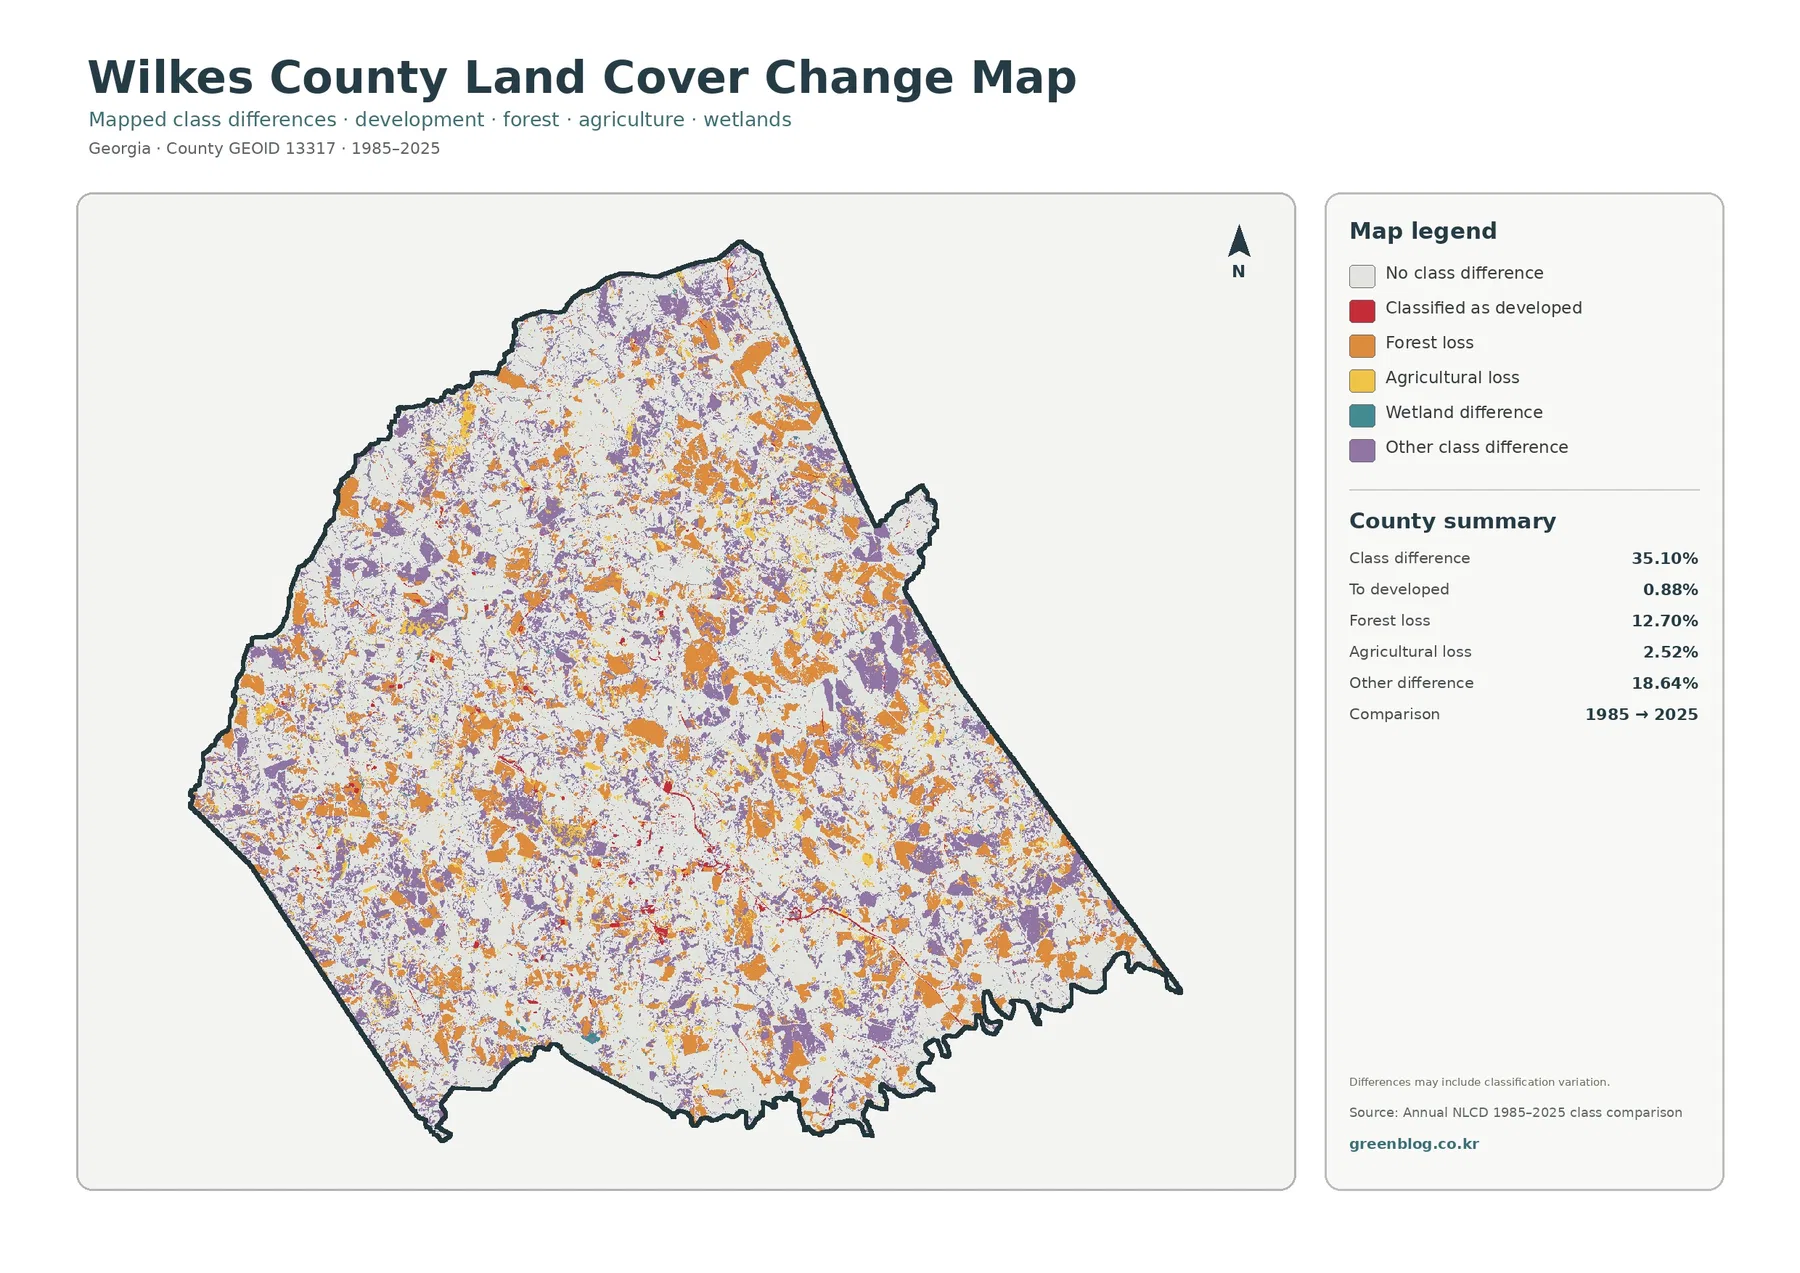
The change map marks 35.10% of Wilkes County as a different class in 2025 than in 1985. Forest loss is listed at 12.70%, agricultural loss at 2.52%, and land classified to developed at 0.88%. Other class differences account for 18.64%. These categories make clear that the total is not a development statistic. Most of the mapped difference belongs to forest and other class changes rather than new developed classification.
Orange forest-loss patches are scattered through the county instead of forming one single cleared zone. They appear in the north, west, center, and south, often mixed with purple areas representing other class differences. That distribution fits a landscape in which forest edges, agricultural openings, and managed land are interwoven. It does not prove why a particular patch changed; timber activity, regrowth, farming, hydrologic conditions, and classification variation would need additional evidence to separate.
Red developed-conversion marks are much less extensive than the forest-loss and other-difference colors. Some occur around the main Washington cluster and along narrow routes, but the 0.88% figure shows that only a small portion of the total two-date difference ends in the developed class. A reader using this image to study growth should therefore keep the current impervious map beside it rather than treating every colored change cell as urbanization.
Reading the four maps together prevents common interpretation mistakes
The most reliable sequence starts with present-day cover. Use the 2025 overview to identify the broad mix of forest, agriculture, open cover, wetlands, water, and development. Then move to the forest-and-farmland view when the question concerns working land or the continuity of wooded areas. The impervious layer is best for the built center and road network, while the change layer belongs at the end because its colors describe differences between two dates rather than current surface classes.
Washington provides a useful example. The general map identifies a compact developed cluster, and the impervious image confirms that the same area contains the county’s strongest concentration of hard surfaces. The forest-and-farmland view then shows how quickly that center gives way to open land and forest. Finally, the change map identifies some nearby cells that differ between 1985 and 2025, but it does not assign a cause or exact development year.
A different reading works in the eastern and southeastern parts of the county. There, current forest cover is much more prominent and impervious values are mostly faint. The change layer still contains many orange and purple patches, which means a place can remain broadly rural or forested in the current view while also containing substantial two-date classification differences. Current condition and historical endpoint difference answer separate questions.
What the 30-meter classification can and cannot tell you
Annual NLCD is a raster dataset, meaning the landscape is divided into square cells and each cell receives a predominant classification. A single cell can contain trees, grass, a driveway, a small building, and cultivated ground even though the final map assigns it one main class. Enlarging the JPG makes the colored pattern easier to see, but it cannot recover parcel-scale detail that was not present in the source grid.
This limitation matters along the many forest-field boundaries in Wilkes County. A sharp green-to-yellow edge on the screen should not be treated as a surveyed property line. The same caution applies to wetlands: the mapped wetland class is a land-cover category, not a legal wetland-jurisdiction determination. Zoning, ownership, building permission, flood requirements, and regulatory boundaries require current local or agency records.
Time is another limitation. The current image represents the supplied 2025 observation year. Construction, harvest, vegetation recovery, crop changes, storms, or water conditions after that date may not appear. The 1985–2025 comparison is also an endpoint product, not an annual narrative of everything that happened in between. A cell could change more than once during forty years and still end in a class similar to one of its earlier states.
Practical ways to use the Wilkes County map set
For a county profile, the general map is the strongest opening image because it immediately establishes the forest-majority setting and the concentrated Washington core. A second image can then support the topic: use forest and farmland for agriculture or natural-cover discussion, impervious surface for built intensity, and the two-date comparison when historical change is the question. Showing all four at once at a very small size usually makes the legends and fine patterns harder to read.
For classroom or presentation work, keep the percentages tied to what the map visibly shows. Forest at 59.43% is a countywide share, not a claim that every part of Wilkes County looks the same. Agriculture at 16.86% is dispersed through many separate patches. Mean impervious cover at 0.87% is low because most of the county is rural, even though Washington has a clearly stronger built concentration. These pairings of number and pattern are more informative than a list of percentages alone.
The original downloadable JPG files measure 2480 × 1754 pixels each. They work well for screens, documents, and many presentation layouts, but the supplied asset manifest does not identify them as meeting an A3 high-resolution reference. If a large poster is planned, test the intended print size first and make sure the legend text remains readable before producing multiple copies.
Download the four original JPG maps
The ZIP groups the same four map views discussed in the article: 2025 land cover, forest and farmland, impervious surface and developed land, and 1985–2025 land-cover change. Keeping the files together makes it easier to compare the same county across current cover, working-land patterns, hard surfaces, and long-term endpoint differences without mixing in maps from another place or year.
Frequently Asked Questions
What is the largest land-cover class in Wilkes County?
Forest is the largest class in the supplied 2025 summary at 59.43%. Agriculture follows at 16.86%, with grassland at 7.91%, shrubland at 5.53%, developed land at 4.74%, wetlands at 4.64%, and water at 0.79%. The broad forest presence is visible across the county, especially away from the main Washington developed cluster.
Why is developed land 4.74% when mean impervious cover is only 0.87%?
Developed land can include permeable surfaces such as lawns, trees, soil, and open space around roads and buildings. Impervious cover focuses on harder surfaces such as roofs and pavement. Wilkes County therefore can have a recognizable developed center around Washington while still maintaining a very low countywide impervious average.
Does the 35.10% class difference mean 35.10% of Wilkes County was developed after 1985?
No. Only 0.88% is listed as classified to developed at the 2025 endpoint. The total difference also includes 12.70% forest loss, 2.52% agricultural loss, 18.64% other class differences, and additional mapped differences. Determining the timing and cause of change at a specific location requires intermediate imagery and local records.
Sources and Reference Data
- MRLC Annual NLCD Data – official access point for the land-cover and annual comparison products used for the map set.
- USGS Annual NLCD Land Cover Classification – class definitions for forest, agriculture, developed land, wetlands, and other mapped surfaces.
- UGA Extension Wilkes County Agriculture & Natural Resources – county-specific agricultural and natural-resource information, including the cited 2023 farm-gate context.
- Georgia Department of Community Affairs County/City List – official statewide listing identifying Washington as the Wilkes County seat.
Map File Information
The ZIP contains the four original JPG maps used to compare forest, agriculture, Washington-area hard surfaces, and 1985–2025 class differences in Wilkes County.
- Included Files: General land cover, forest and farmland, impervious/developed surface, and land-cover change maps
- File Type: Four original JPG map files bundled in one ZIP archive
- Intended Use: Printing, education, presentations, and map-based projects
Related Maps
- Appling County Georgia Land Cover Map
- Atkinson County Georgia Land Cover Map
- Bacon County Georgia Land Cover Map
Green Map creates custom-edited map images using open geographic data sources such as geoBoundaries, Natural Earth, OpenStreetMap, and government open data. These maps are edited visual materials, not raw data files, and are provided for education, documents, presentations, and graphic reference.