Forests provide more than timber. They also generate water-related ecosystem services associated with watershed protection, and the World Bank assigns a monetary natural-capital value to those services. In the 2020 country comparison, Australia leads at $12,710 per person, followed by New Zealand at $7,530 and Norway at $6,341. The median across 148 observations is only $287, so the top of the distribution is far above the typical country value.
The indicator is World Bank NW.NCA.FSTW.PC.CD, formally named Renewable natural capital per capita, forest water ecosystem services (current US$). In the World Bank forest-wealth methodology, these water services are part of non-timber forest ecosystem services and are associated with watershed protection. The measure is therefore a monetary natural-capital estimate, not a physical volume of water, water-quality score, or household water-service indicator.
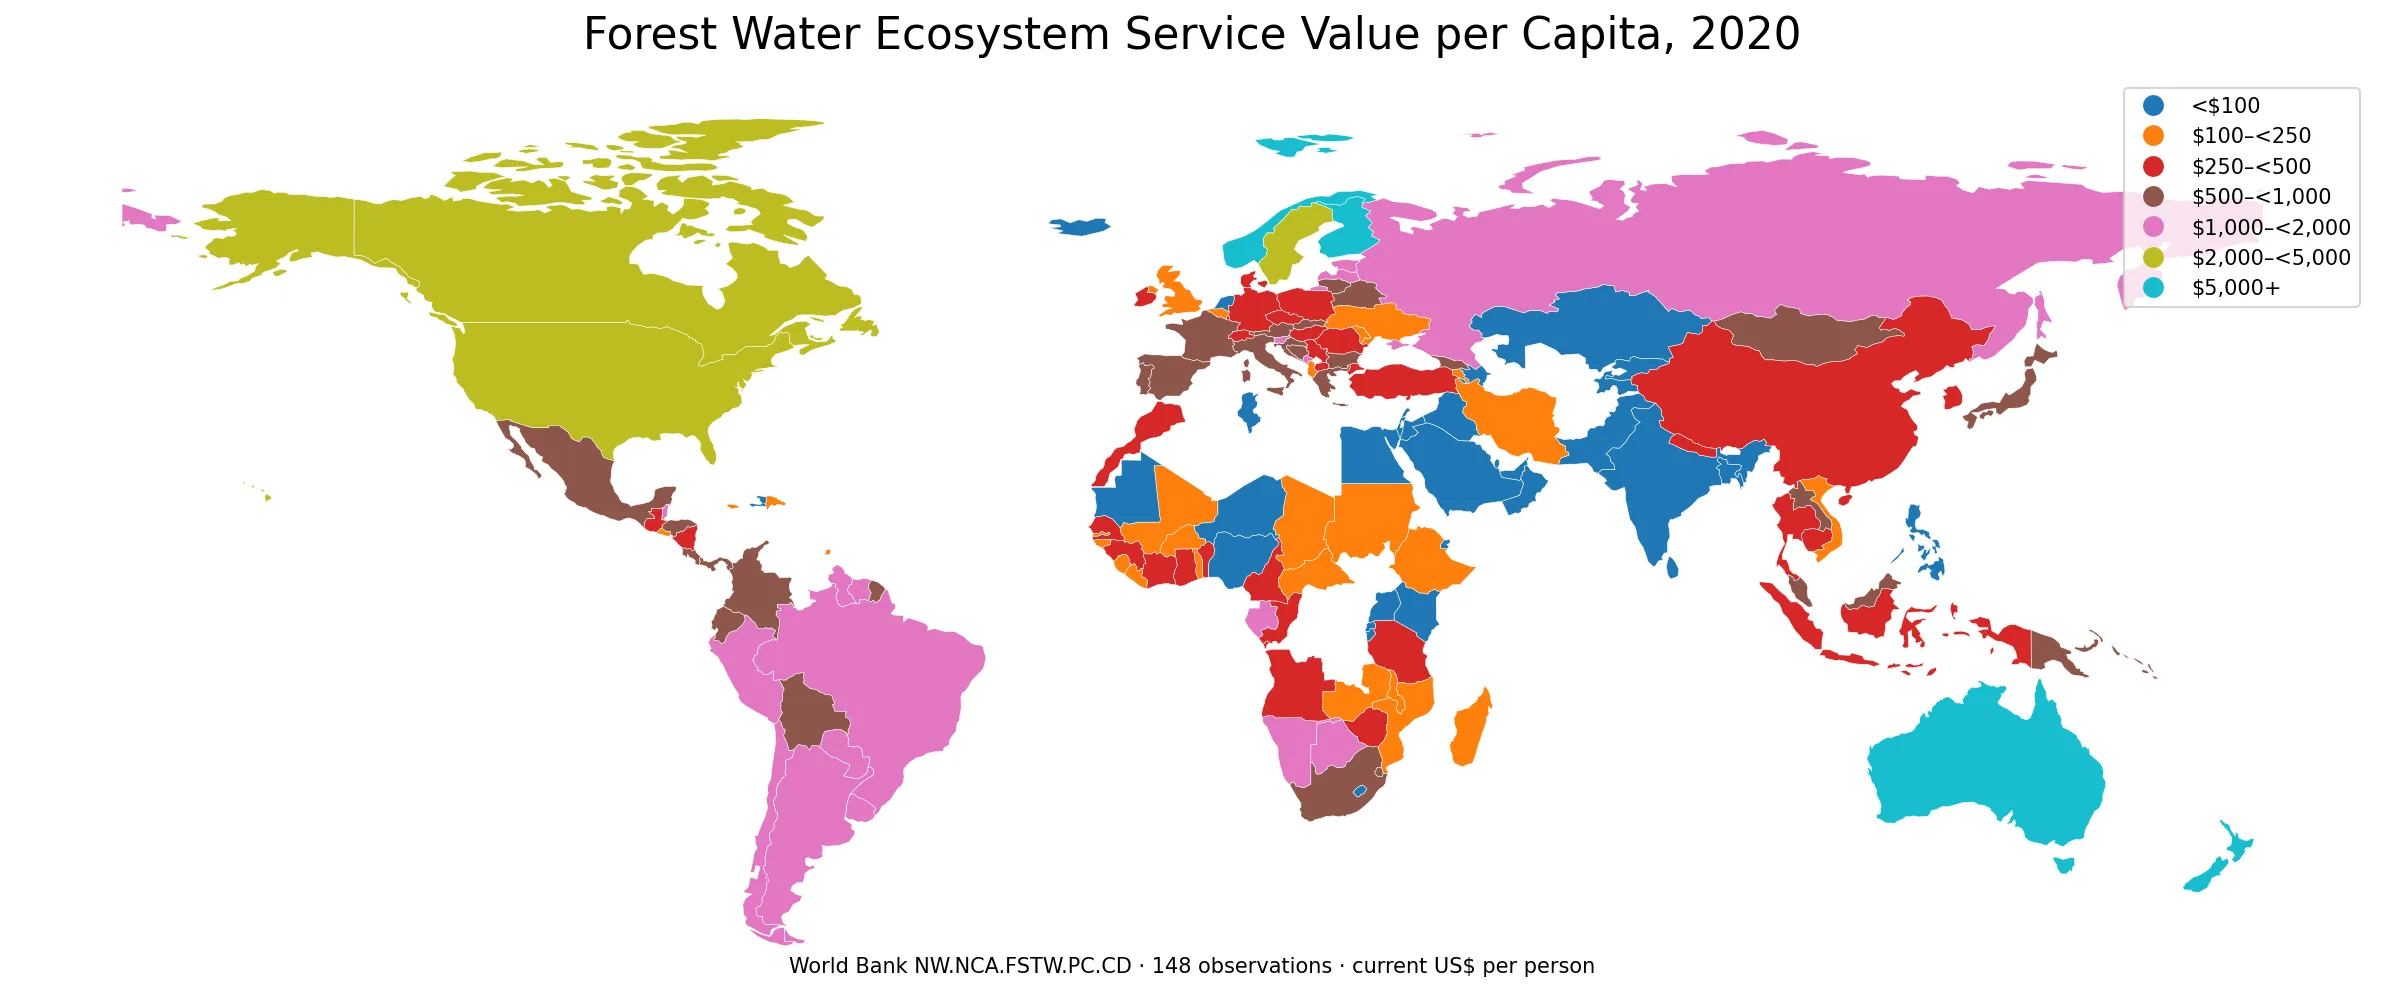
Table of Contents
All 148 observations use the same 2020 reference year
The supplied dataset is unusually clean for a global comparison: every numeric row is dated 2020. No older latest-available observations need to be mixed into the map. The unit is current US dollars per person, so the values reflect the monetary price level of 2020 rather than an inflation-adjusted constant-dollar series.
That distinction matters mainly for time-series interpretation. A one-year cross-country comparison such as this one keeps the price-year context consistent. A long-run comparison would need to distinguish changes in estimated ecosystem-service wealth from changes in general prices and currency values.
Australia, New Zealand and Northern Europe form the highest-value group
Australia and New Zealand occupy the top two positions, followed by Norway, Finland and Sweden. Canada is also above $4,000 per person, while the United States exceeds $2,000. Uruguay and Brazil are among the highest South American observations. The map therefore shows a strong high-value cluster across Oceania and parts of northern Europe and North America, while many other economies fall below $500 per person.
| Country or economy | 2020 value per person |
|---|---|
| Australia | $12,710 |
| New Zealand | $7,530 |
| Norway | $6,341 |
| Finland | $5,613 |
| Sweden | $4,495 |
| Canada | $4,446 |
| United States | $2,221 |
| Uruguay | $1,910 |
| Russian Federation | $1,719 |
| Brazil | $1,697 |
This is not a ranking of forest area or water availability. The indicator capitalizes an estimated ecosystem-service value and then divides the national value by population. Forest characteristics, service valuation and population size can all affect the final per-capita number.
The median is about $287, and 96 observations are below $500
Of the 148 observations, 38 are below $100 per person and 96 are below $500. At the high end, 24 reach at least $1,000, only 7 reach $2,000, and 4 reach $5,000 or more. The unweighted mean is $700, much higher than the $287 median because a small number of very large values pull the average upward.
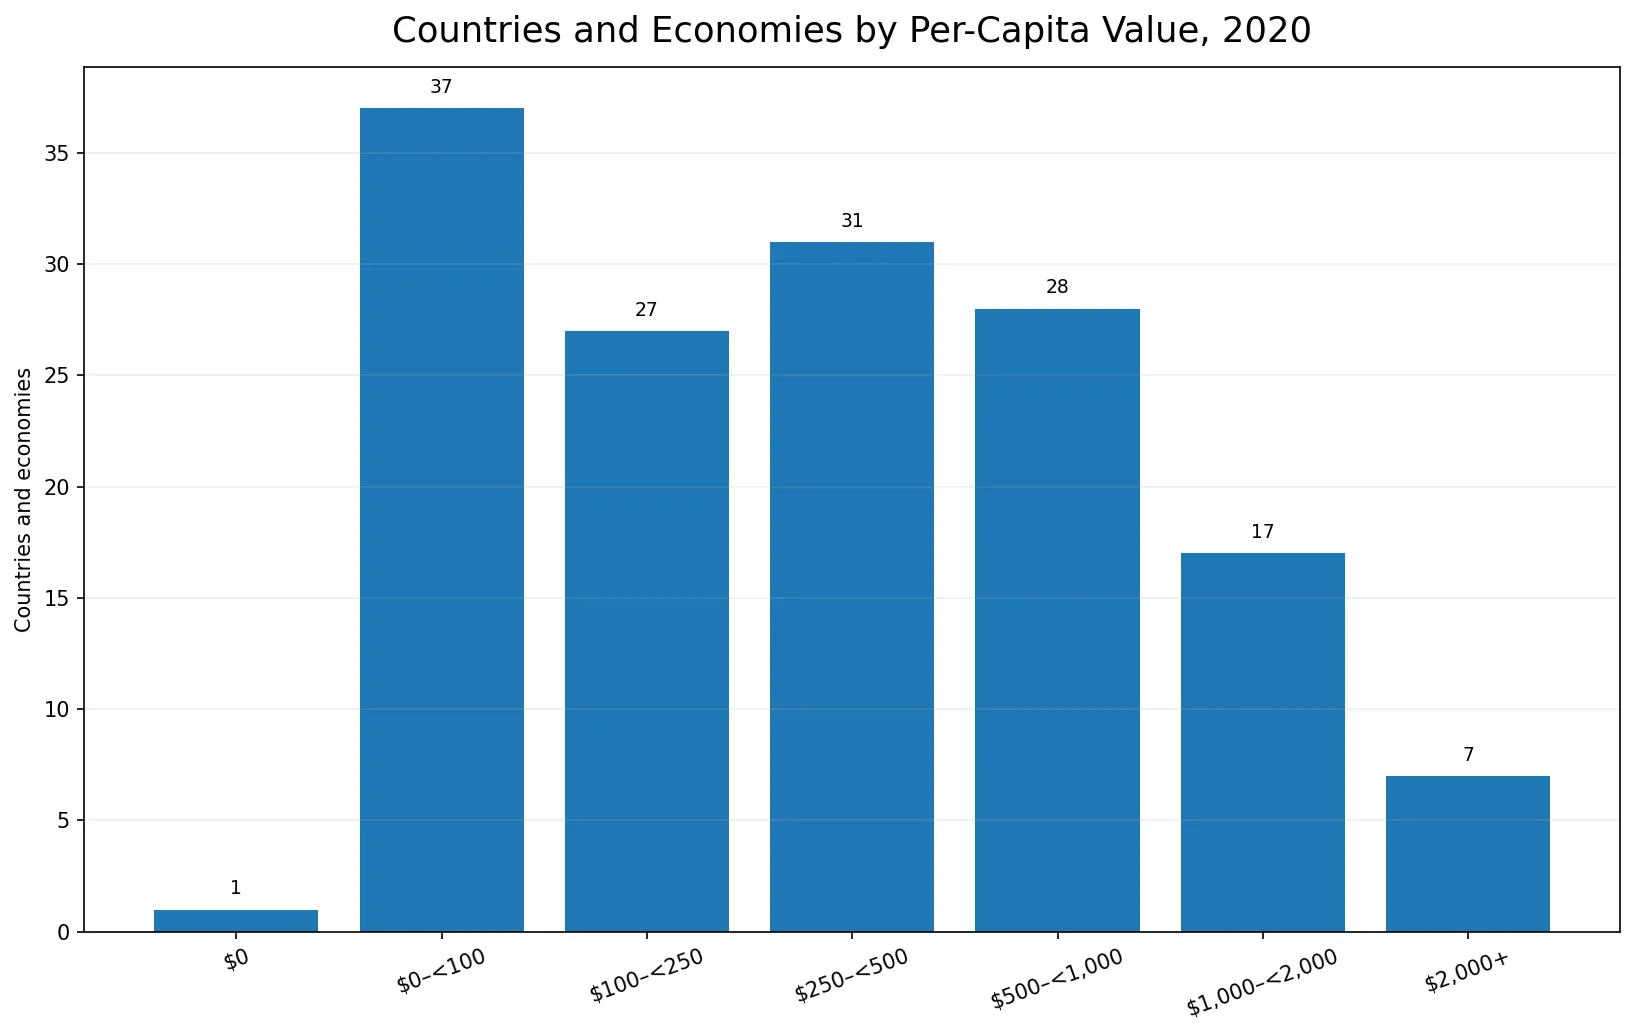
| Per-capita range | Countries/economies | Share of 148 |
|---|---|---|
| $0 | 1 | 0.7% |
| $0–<100 | 37 | 25.0% |
| $100–<250 | 27 | 18.2% |
| $250–<500 | 31 | 20.9% |
| $500–<1,000 | 28 | 18.9% |
| $1,000–<2,000 | 17 | 11.5% |
| $2,000+ | 7 | 4.7% |
Selected large economies occupy very different points on the scale
The United States is about $2,221 per person, the Russian Federation $1,719, and Brazil $1,697. France is about $675, Japan $591, Korea $308, China $287, Germany $272, Indonesia $283, and India about $62. These values illustrate how differently the World Bank’s forest-water-service wealth estimate is distributed on a per-person basis.
| Country | 2020 value per person |
|---|---|
| Australia | $12,710 |
| New Zealand | $7,530 |
| Norway | $6,341 |
| Finland | $5,613 |
| Sweden | $4,495 |
| Canada | $4,446 |
| United States | $2,221 |
| Russian Federation | $1,719 |
| Brazil | $1,697 |
| France | $675 |
| South Africa | $614 |
| Japan | $591 |
| Korea, Rep. | $308 |
| China | $287 |
| Indonesia | $283 |
| Germany | $272 |
| India | $62 |
The table should not be read as a comparison of drinking-water supply, utility performance or annual water consumption. It measures a specific forest ecosystem-service asset within the World Bank natural-capital accounting framework.
What do ‘forest water ecosystem services’ mean here?
The World Bank’s natural capital overview describes natural capital as stocks of natural assets such as forests, water, soils, minerals and biodiversity that support economic activity and human well-being. Forests provide multiple services beyond wood, including regulation and protection functions. The Changing Wealth of Nations accounts value several non-timber forest services separately.
In the technical forest-wealth methodology, the water-service category corresponds to watershed-protection services. That is why the indicator should not be interpreted as the market value of all national water resources. It captures a narrower ecosystem-service concept associated with forests.
A high value is not automatically a measure of better forest management
A high per-capita value means the estimated monetary asset value of this forest water service is large relative to population. It does not by itself show that water quality is better, flood risk is lower, forest governance is stronger, or deforestation is absent. Those questions require separate physical and policy indicators.
A low value also does not mean that forests or water services are unimportant. National forest extent, ecological conditions, valuation inputs and population all affect the estimate. The map is most useful as a standardized economic comparison of one forest ecosystem-service asset rather than as a general environmental score.
Data source and mapping method
The statistical source is World Bank indicator NW.NCA.FSTW.PC.CD. All 148 values used in the rankings, summary statistics and charts are dated 2020. Regional and income-group aggregates are excluded.
ISO-3 economy codes are joined to a simplified world boundary layer for the map. Very small islands and separately reported territories can appear in the statistics without a distinct visible polygon at world scale. Because the value range is highly skewed, the map uses stepped monetary bands rather than one linear color range.
Frequently Asked Questions
What are forest water ecosystem services in this indicator?
In the World Bank forest natural-capital framework, the water-service category is a non-timber forest ecosystem service associated with watershed protection. It is not a measure of total national water resources or utility performance.
Which economy has the highest 2020 value?
Australia is highest among the 148 observations at about $12,710 per person, followed by New Zealand at about $7,530 and Norway at about $6,341.
Why is the indicator expressed per capita?
The per-capita form relates the estimated national asset value to population, making economies of different population sizes easier to compare. It still reflects the underlying ecosystem-service valuation as well as population.
Does a high value mean better forest management?
No. The indicator values one forest ecosystem-service asset. It does not directly measure forest governance, water quality, flood risk, deforestation or conservation performance.
Related Articles
These Green Map comparisons add context on forest extent and economically measured forest depletion.
- Global Forest Area Share Map – 2023 Country Comparison
- Global Net Forest Depletion Map – 2021 Country Comparison
- Global Net Forest Depletion Map – 2020 Share of GNI by Country
Green Map creates custom-edited map images using open geographic data sources such as geoBoundaries, Natural Earth, OpenStreetMap, and government open data.
These maps are edited visual materials, not raw data files, and are provided for education, documents, presentations, and graphic reference.