Spink County sits in east-central South Dakota within the broad James River lowland, a landscape that looks almost level at first glance but becomes much more varied when the water and elevation layers are compared. The James River forms a long low corridor through the middle of the county, the Doland River follows another lower strip farther east, and the ground rises most strongly along the eastern edge. Redfield provides the most useful settlement reference for tying those features together. This page explains what can be seen on the supplied county, city, water, and elevation maps, and the matching high-resolution JPG files are available together in a ZIP archive.
Redfield is also the county seat, so it works as more than a convenient point on the map. The county government is based there, and the supplied layers place the city close to the James River, Lake Redfield, and several transportation lines. Moving north from Redfield brings the northern settlement belt into view, while an eastward move leads through Frankfort toward Doland and a different drainage corridor. Keeping Redfield fixed while changing layers is more informative than reading each map as an isolated picture.
A U.S. Geological Survey report describes Spink County as an agricultural area of about 1,505 square miles in the flat to gently rolling James River lowland. The supplied elevation surface supports that broad description, yet it also reveals details that are easy to miss in a general overview: a deep-looking green ribbon along the James River, a second narrow low corridor along the Doland River, smaller western valleys around Snake Creek and Turtle Creek, and a much stronger rise at the eastern county boundary. Those contrasts provide the organizing thread for the sections below.
Table of Contents
Start with Redfield to place the roads and nearby towns
On the general county map, Redfield sits slightly west of the middle and gives the road network a practical center. South of town, route shields 22, 24, and 281 appear along the same broad north-south corridor. An east-west road leaving Redfield toward Frankfort carries a 15 shield, while 212 appears farther east. In the northern part of the county, 6 is marked near Conde and 20 appears on the next major east-west line below it; 37 runs through the southeastern interior. Rather than treating those numbers as a list to memorize, use them to divide the county into a few recognizable areas around Redfield, the northern towns, Frankfort, and the eastern boundary.
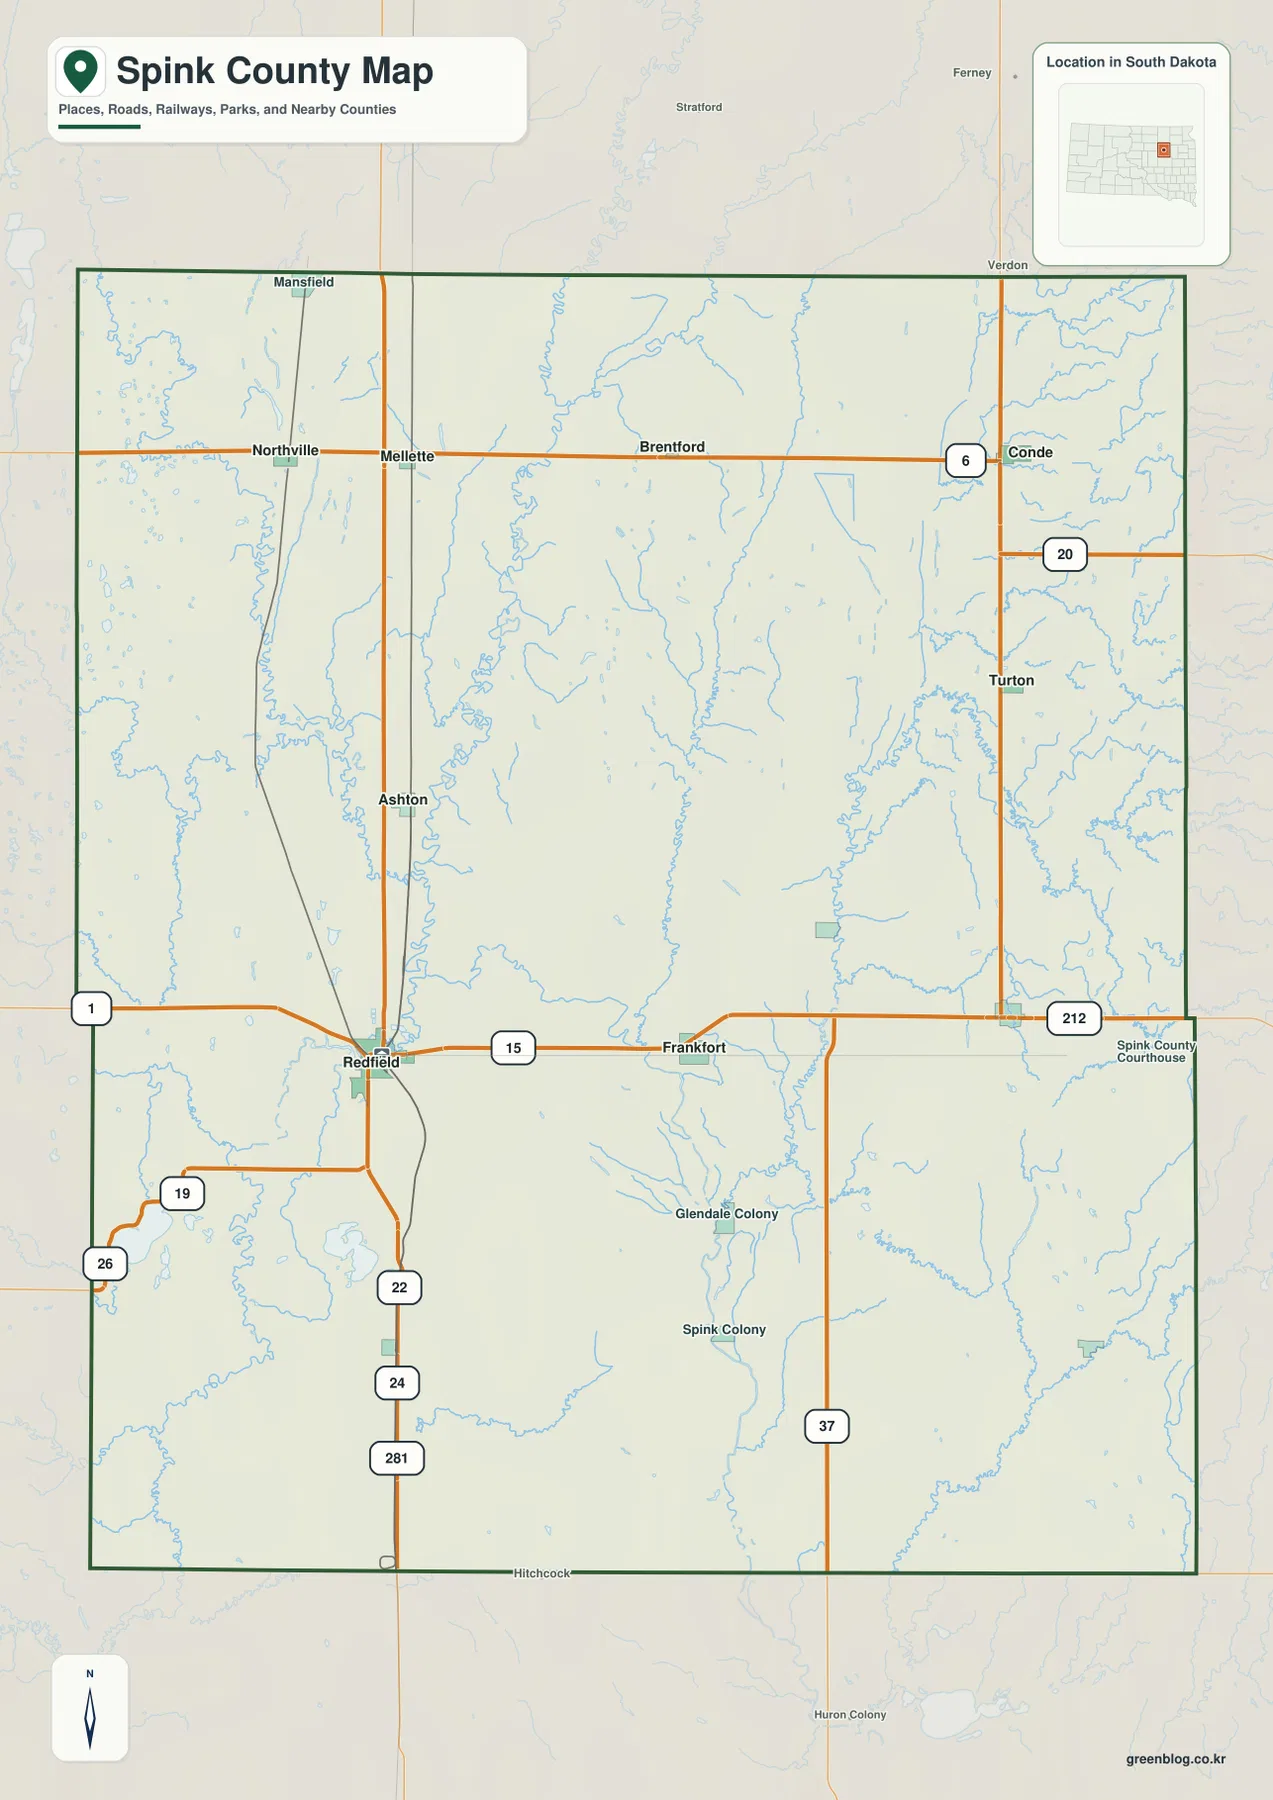
The contrast between the transportation grid and the drainage network is one of the map’s clearest visual features. Roads are mostly straight, but blue stream lines bend repeatedly across them. A black railway line passes through the Redfield area and angles north toward Ashton and the Northville side of the county. Along the northern tier, Northville, Mellette, Brentford, and Conde are spread from west to east, with Turton farther south in the eastern interior. Once these places are fixed in mind, the water map becomes much easier to follow because the winding valleys can be related back to familiar town and road positions.
The neighboring county labels on the city map add another layer of orientation: Brown County lies to the north, Clark and Day to the east, Edmunds to the southeast, Faulk and Hand to the south and southwest, and Beadle to the west. The maps are still static geographic references, not live transportation products. Road work, closures, travel times, and current driving conditions should be checked with a current transportation source rather than inferred from the printed road network.
Redfield dominates a scattered six-city pattern
Redfield is the first place to stand out on the city-distribution map. Its CITY INDEX figure is 1,989, while the other five highlighted communities fall within a much tighter range of 153 to 209. Doland, at the eastern side of the selected set, is marked 209, and Northville at the northwestern side is marked 153; Ashton, Mellette, and Tulare fall between those values. No date is printed beside the figures, so they should not be treated as a current population table. Their clearest use here is to show how strongly Redfield differs in scale from the smaller communities around it.
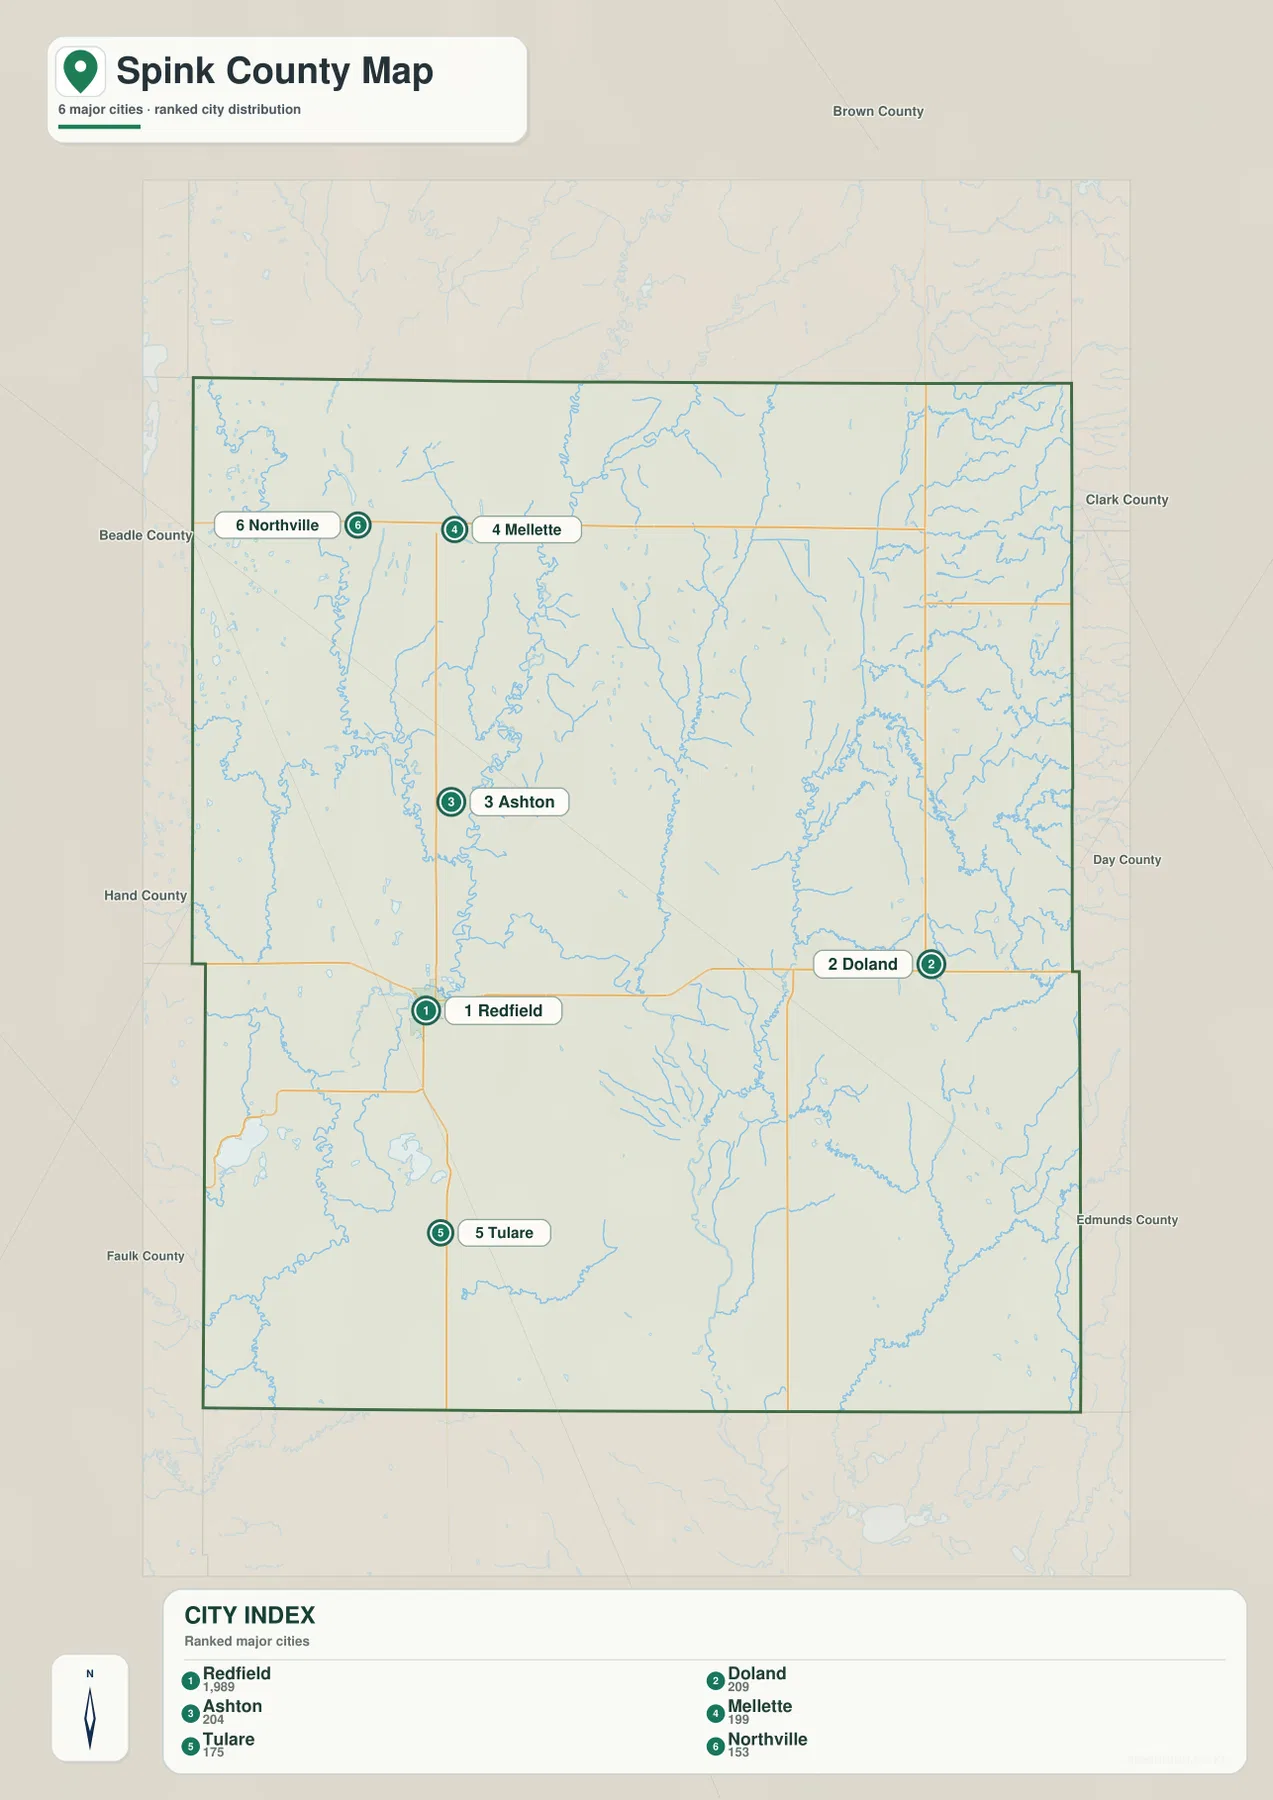
The settlements are spread across the county rather than gathered in one compact cluster. Redfield lies a little west of center, Ashton is north of it, and Mellette and Northville occupy the northern portion of the map. Doland sits well to the east of Redfield, while Tulare is the southernmost of the six highlighted places. The map has no distance connectors or mileage labels, so the gaps between markers represent relative position only. Actual road mileage or straight-line distance requires a dedicated routing or measurement source.
These six places become especially useful when they are carried into the physical maps. Redfield is close to the James River and Lake Redfield, making it a natural reference for the county’s broad central lowland. Doland shifts attention to the eastern drainage corridor. Northville and Mellette help orient the area between Snake Creek and the James River in the north, while Tulare is a good marker for the Turtle Creek and Mud Lake area in the southwest. This method keeps the city layer tied to visible geography instead of turning it into a detached list of names.
The James River is the main low corridor, but not the only one
The terrain-and-water map gives the James River the strongest continuous line in the county. It enters from the north, bends repeatedly through the central interior, and passes close to Lake Redfield. Mud Creek and Hull Creek are labeled near the upper part of the James River corridor. Farther west, Snake Creek, South Fork Snake Creek, and Dove Creek occupy a separate set of valleys. A USGS water-resources report for Spink County likewise identifies the James River and its tributaries as central to the county’s water system and specifically notes Snake Creek and Turtle Creek as important tributary flows.
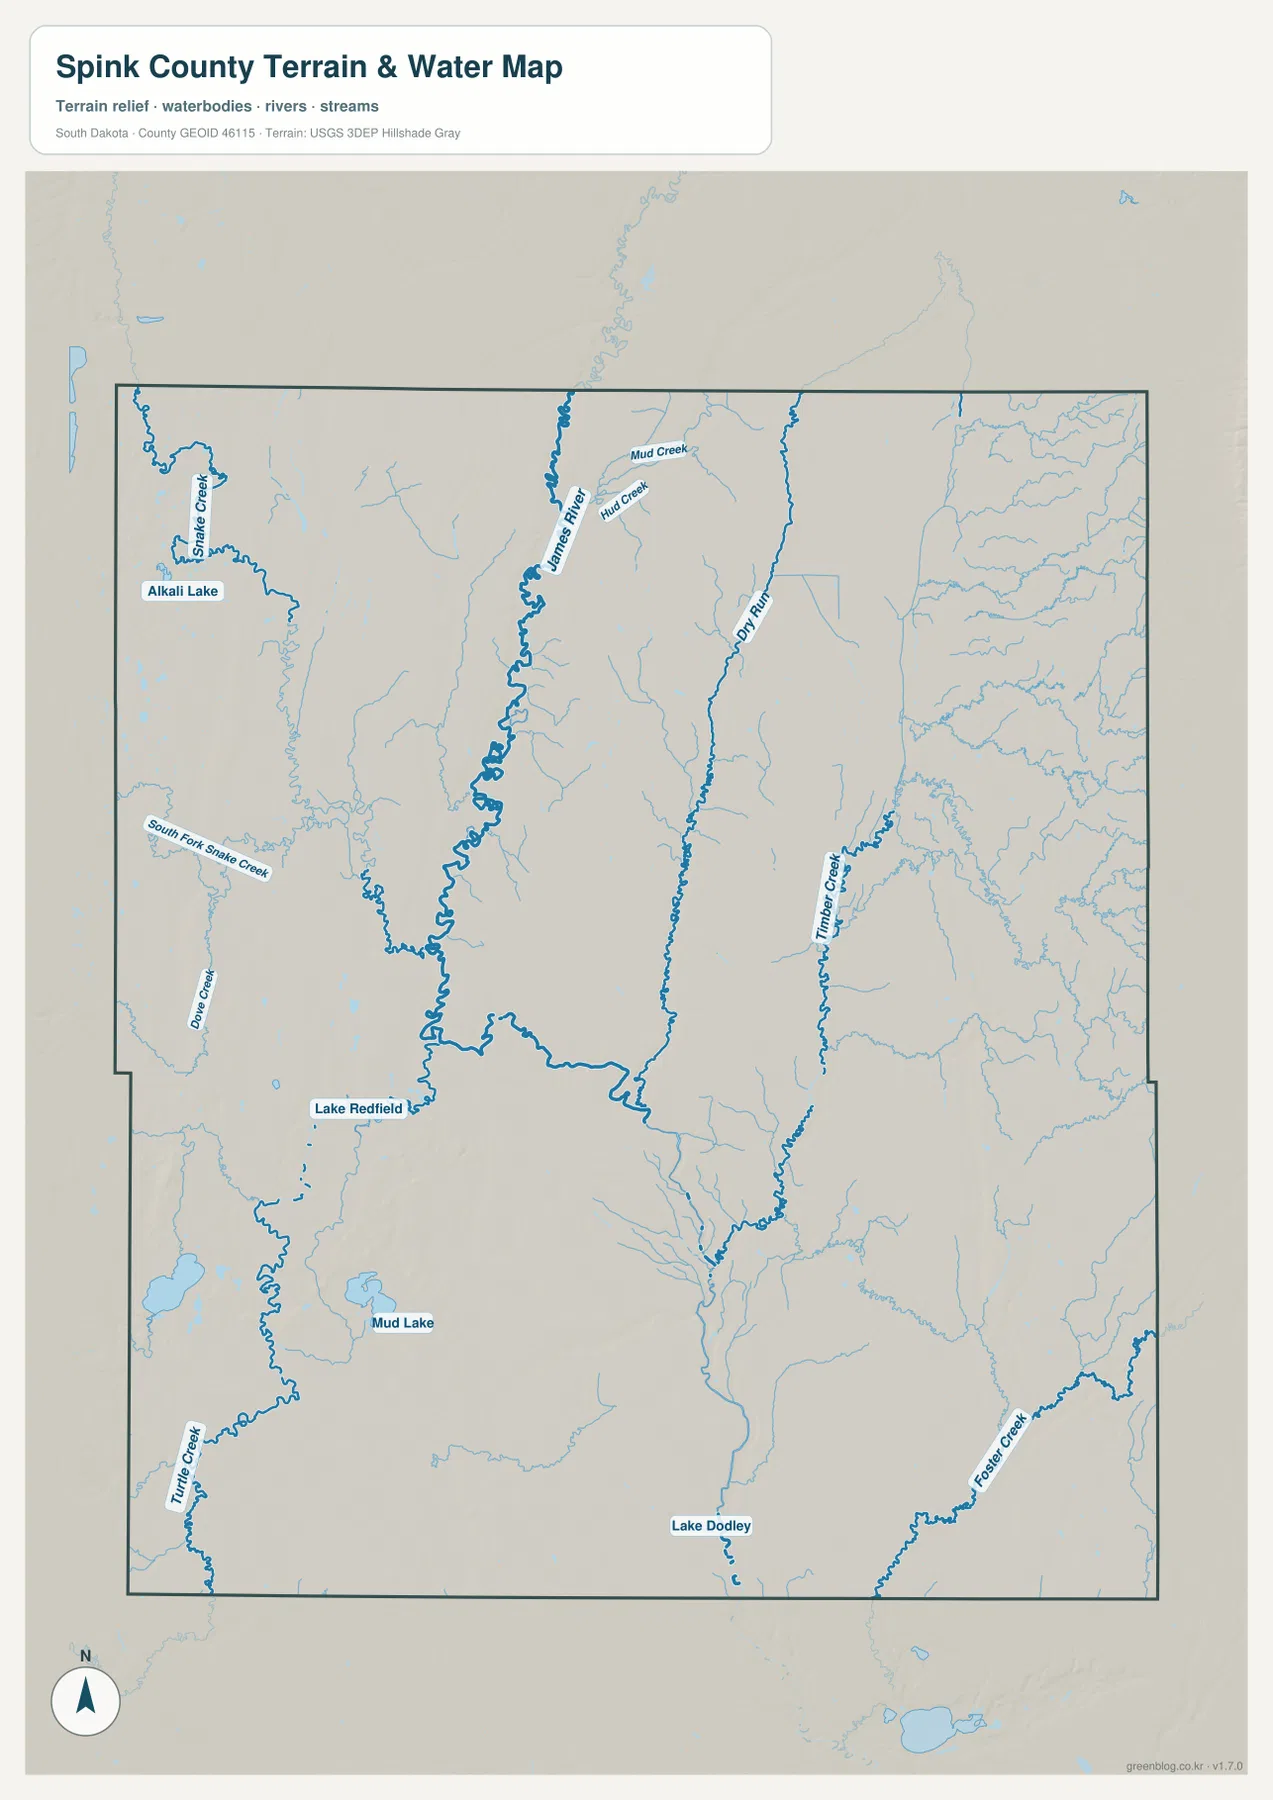
East of the James River, the Doland River forms another long north-south route through lower ground. Timber Creek lies still farther east, while Foster Creek reaches the southeastern boundary. In the southwest, Turtle Creek runs near Mud Lake, and Lake Dodley appears near the southern center of the county. Alkali Lake provides a clear northwestern landmark beside the Snake Creek drainage. Taken together, these names show that Spink County is not organized around a single river channel; several roughly parallel drainage paths cut across the broad lowland and are separated by modest rises.
This map is intended to show the location and shape of rivers, streams, lakes, and terrain. It does not report current flow, water depth, water quality, flood-zone status, navigability, or property boundaries. A blue line should therefore be read as a hydrographic feature, not as a legal or engineering line. Current hydrography can be checked against USGS National Hydrography, while flood or parcel questions require datasets designed for those specific purposes.
Elevation rises most sharply along the eastern edge
The elevation legend shows an Actual range of about 378 to 447 meters and a mean of about 401 meters. The darkest green area follows the James River as a long central low corridor, making the river valley recognizable even without town labels. The Doland River appears as another narrow green strip to the east. The strongest change occurs closer to the eastern boundary, where green gives way to yellow, tan, and brown. That color transition represents the most pronounced rise visible within the supplied county surface.
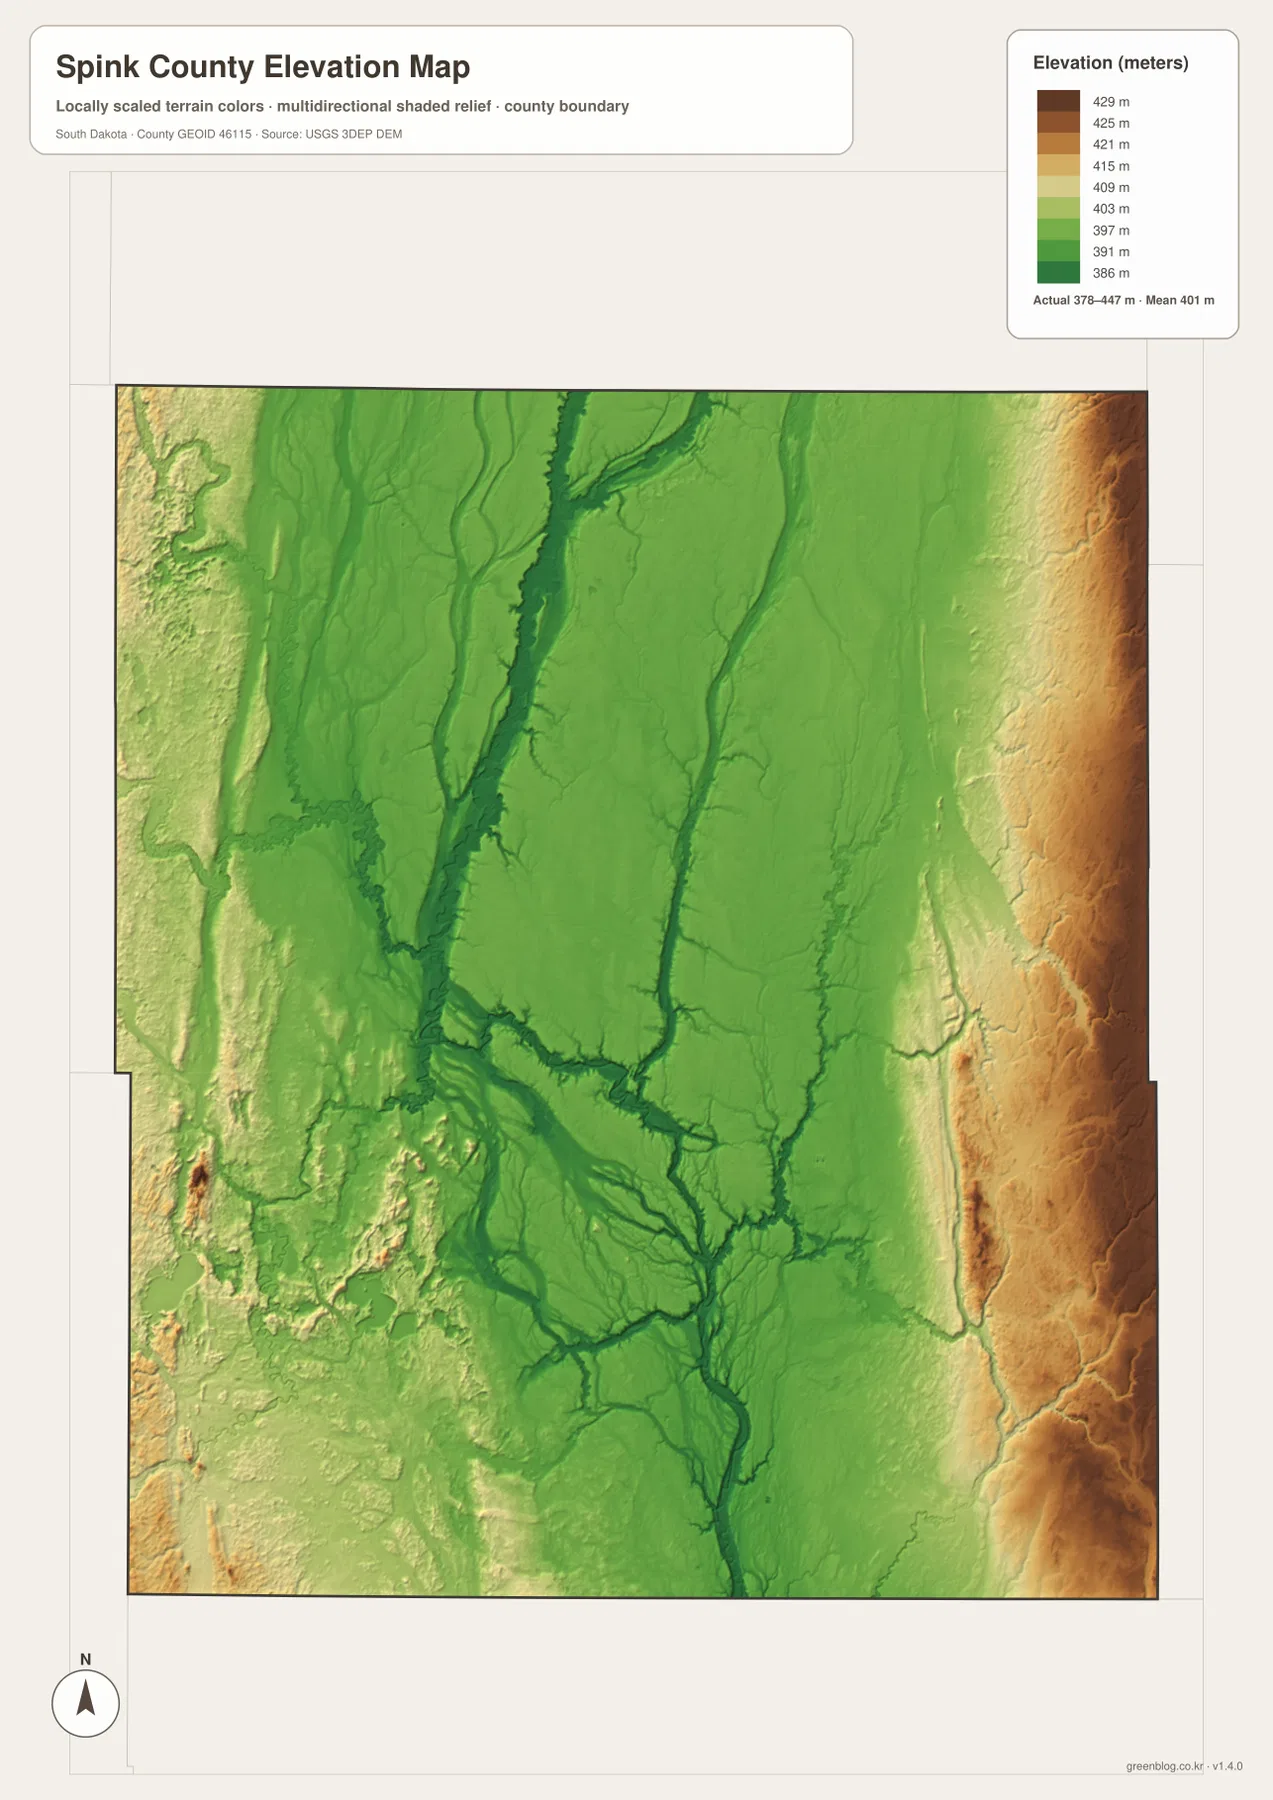
The western half is quieter in color but still contains useful relief. Narrow higher strips appear west of Northville and southwest of Redfield, while Snake Creek, South Fork Snake Creek, Turtle Creek, and smaller tributaries occupy lower channels between them. The James River lowland remains broader and more continuous through the center. Farther east, the low Doland River line sits close to rapidly rising ground, which makes the transition from central lowland to eastern upland especially easy to see.
The legend range is a county-wide description, not a site survey. A field corner, road crossing, building pad, or engineering location cannot be assigned an exact elevation by matching its map color to the legend. The layer is best used to compare broad terrain and valley positions. For exact values, official DEM products from the USGS 3D Elevation Program or an appropriate survey should be used instead.
Use the same place across layers to connect human and physical geography
A practical way to work through the maps is to keep one town fixed while changing layers. Start with Redfield on the general map, where the surrounding roads and railway are visible. Move to the city layer to see how Redfield compares with the five other highlighted communities, then locate the James River and Lake Redfield on the water map. On the elevation surface, the same area falls within the broad green central lowland. This sequence explains Redfield’s setting much more clearly than a long inventory of road numbers or creek names.
Then repeat the process with Doland. Its position east of Redfield leads into the Doland River corridor, and the elevation layer shows lower ground along that river with a sharper rise immediately farther east. In the north, Northville and Mellette can be paired with Snake Creek and the James River; in the south, Tulare can be paired with Turtle Creek and the Mud Lake area. For an A3 printout or classroom presentation, the general map works well for roads and place names, while the water and elevation maps provide cleaner physical-geography references without forcing all information onto one sheet.
Frequently Asked Questions
Why is Redfield a useful starting point on a Spink County map?
Redfield is the county seat and the supplied maps place it near roads, a railway, the James River, and Lake Redfield. Once Redfield is located, the northern towns, Frankfort and Doland to the east, and Tulare to the south can be placed more easily on the other layers.
Are the CITY INDEX figures, such as Redfield 1,989, current population counts?
The city map prints those figures beneath the selected place names, but it does not show a date for the values. They are useful for understanding the relative scale presented on this map, not for claiming a current population. Use an official population source when a specific census year or current estimate is required.
Can the 378–447 m elevation range be used as the exact elevation of a property?
No. The Actual range describes the county-wide elevation surface, and the colors are meant for broad terrain comparison. A precise elevation for a property, road point, or construction site should come from official DEM data or a survey rather than from the map color alone.
Map File Information
The ZIP archive contains the original high-resolution JPG versions of the Spink County general map, city-distribution map, terrain-and-water map, and elevation map used in this article. Each JPG is 2572 × 3638 pixels, making the files suitable for A3 printing, presentations, classroom materials, and closer inspection of labels.
- Included Files: 4 high-resolution maps
- File Type: JPG
Related Maps
Sources and references
- Spink County Government – official county government information and notices based in Redfield.
- USGS Water Resources of Spink County – an official report describing the James River lowland and the county’s major water resources.
- U.S. Census Bureau TIGER/Line Shapefiles – an official geographic source for county boundaries and base mapping data.
- USGS National Hydrography – an official source for rivers, streams, lakes, and hydrographic data.
- USGS 3D Elevation Program – an official source for elevation and DEM products.
Green Map creates custom-edited map images using open geographic data sources such as geoBoundaries, Natural Earth, OpenStreetMap, and government open data.
These maps are edited visual materials, not raw data files, and are provided for education, documents, presentations, and graphic reference.