You can download high-resolution JPG maps of Faulk County, South Dakota, from this page in one ZIP file. The county becomes much easier to orient once Faulkton is treated as the central reference point: Onaka lies to the northwest, Cresbard and Chelsea occupy the northeast, Orient sits near the southern edge, and Rockham is farther southeast. The maps also show a strong terrain change from higher western ground to lower eastern valleys, where the two main Snake Creek forks become some of the most prominent named waterways.
That combination of settlement, water, and relief is more useful than a simple inventory of map types. A road view explains how Faulkton relates to U.S. 212 and the numbered routes crossing the county. A simplified community view makes the wide spacing between six mapped places obvious. The water map shifts attention toward Lake Faulkton, Latham Lake, North Fork Snake Creek, South Fork Snake Creek, and several smaller creeks and lakes. The elevation surface then explains why many of the strongest eastern channels occupy greener, lower ground.
The community index used here does not draw connector lines or mileage labels, so it should not be treated as a distance chart. Its value is directional: it shows where the principal labeled communities sit within the county and how far apart they appear at county scale. The discussion below follows that same reader-first approach, using Faulkton and a few easy-to-find water features as anchors rather than repeating the same sentence pattern for every map.
Table of Contents
Faulkton anchors the road network and the county’s main place names
Faulkton sits close to the center of the county reference map, making it the most practical place to begin. Route 11 runs north and south through the community, while U.S. 212 crosses the southern part of the county. Additional numbered roads, including 45, 13, 15, and 17, are labeled across the southern half. In the northeast, route 20 runs through the broad Cresbard–Chelsea area, and the western half carries several other numbered roads such as 3, 7, 12, and 47. The result is not a single highway corridor but a dispersed rural road pattern connecting communities across a large rectangular county.
The place labels reinforce that pattern. Onaka is in the northwest, while Thunderbird Colony and Blumengard Colony appear across the northern half. Cresbard and Chelsea give the northeast two clear reference points, Evergreen Colony is east of Faulkton, and Orient lies close to the southern boundary. Once those names are located, it is much easier to switch to the simplified community map or the water map without losing track of direction.
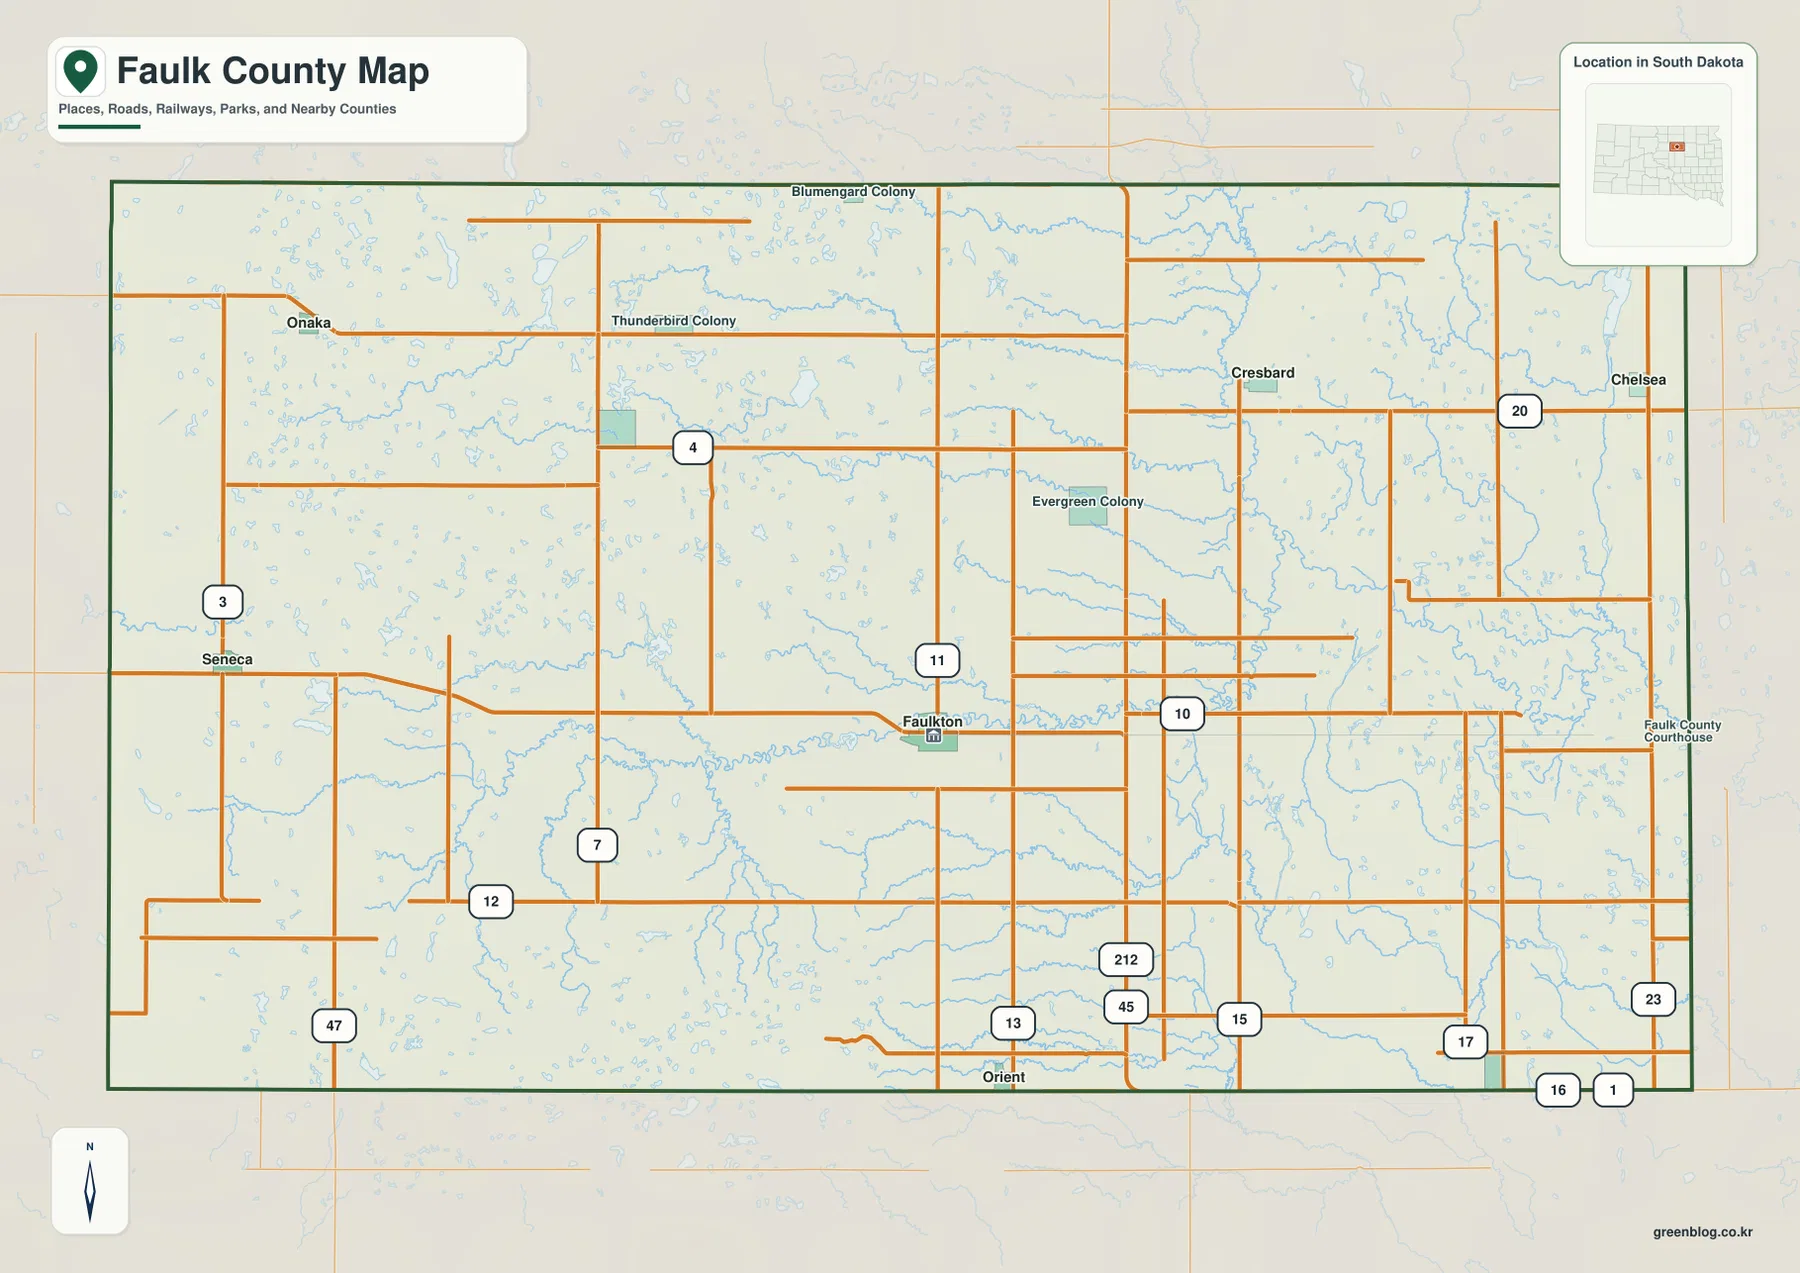
This map is best used for county-wide orientation rather than turn-by-turn navigation. It helps answer questions such as whether Cresbard is northeast or southeast of Faulkton, where U.S. 212 crosses the county, and which side contains the greatest concentration of named streams. For current road conditions, closures, or precise routing, the South Dakota Department of Transportation remains the better source. Here, the emphasis is on seeing the road and place-name framework that the other maps simplify.
The six-community view emphasizes direction, not mileage
The community-distribution map removes most of the road detail and highlights six places: Faulkton, Cresbard, Orient, Chelsea, Rockham, and Onaka. Faulkton is near the middle. Onaka sits well to the northwest, Cresbard and Chelsea form the northeastern pair, Orient is on the south-central side, and Rockham lies farther southeast. The spacing is the main story. The communities do not form one continuous urban strip; instead, small places are separated across the county by broad rural areas.
Because this version contains no connector lines and no mile figures, the numbered markers should be read as an index rather than a distance scale. They make it easy to compare direction and relative position, but they do not say how long a drive will take. Labels around the frame add useful regional context: Edmunds County is to the north, Spink and Brown counties are shown on the east, while Hand, Hyde, and Potter counties appear along the western and southwestern sides. Those outside labels help place Faulk County within the surrounding part of South Dakota without cluttering the six-community view.
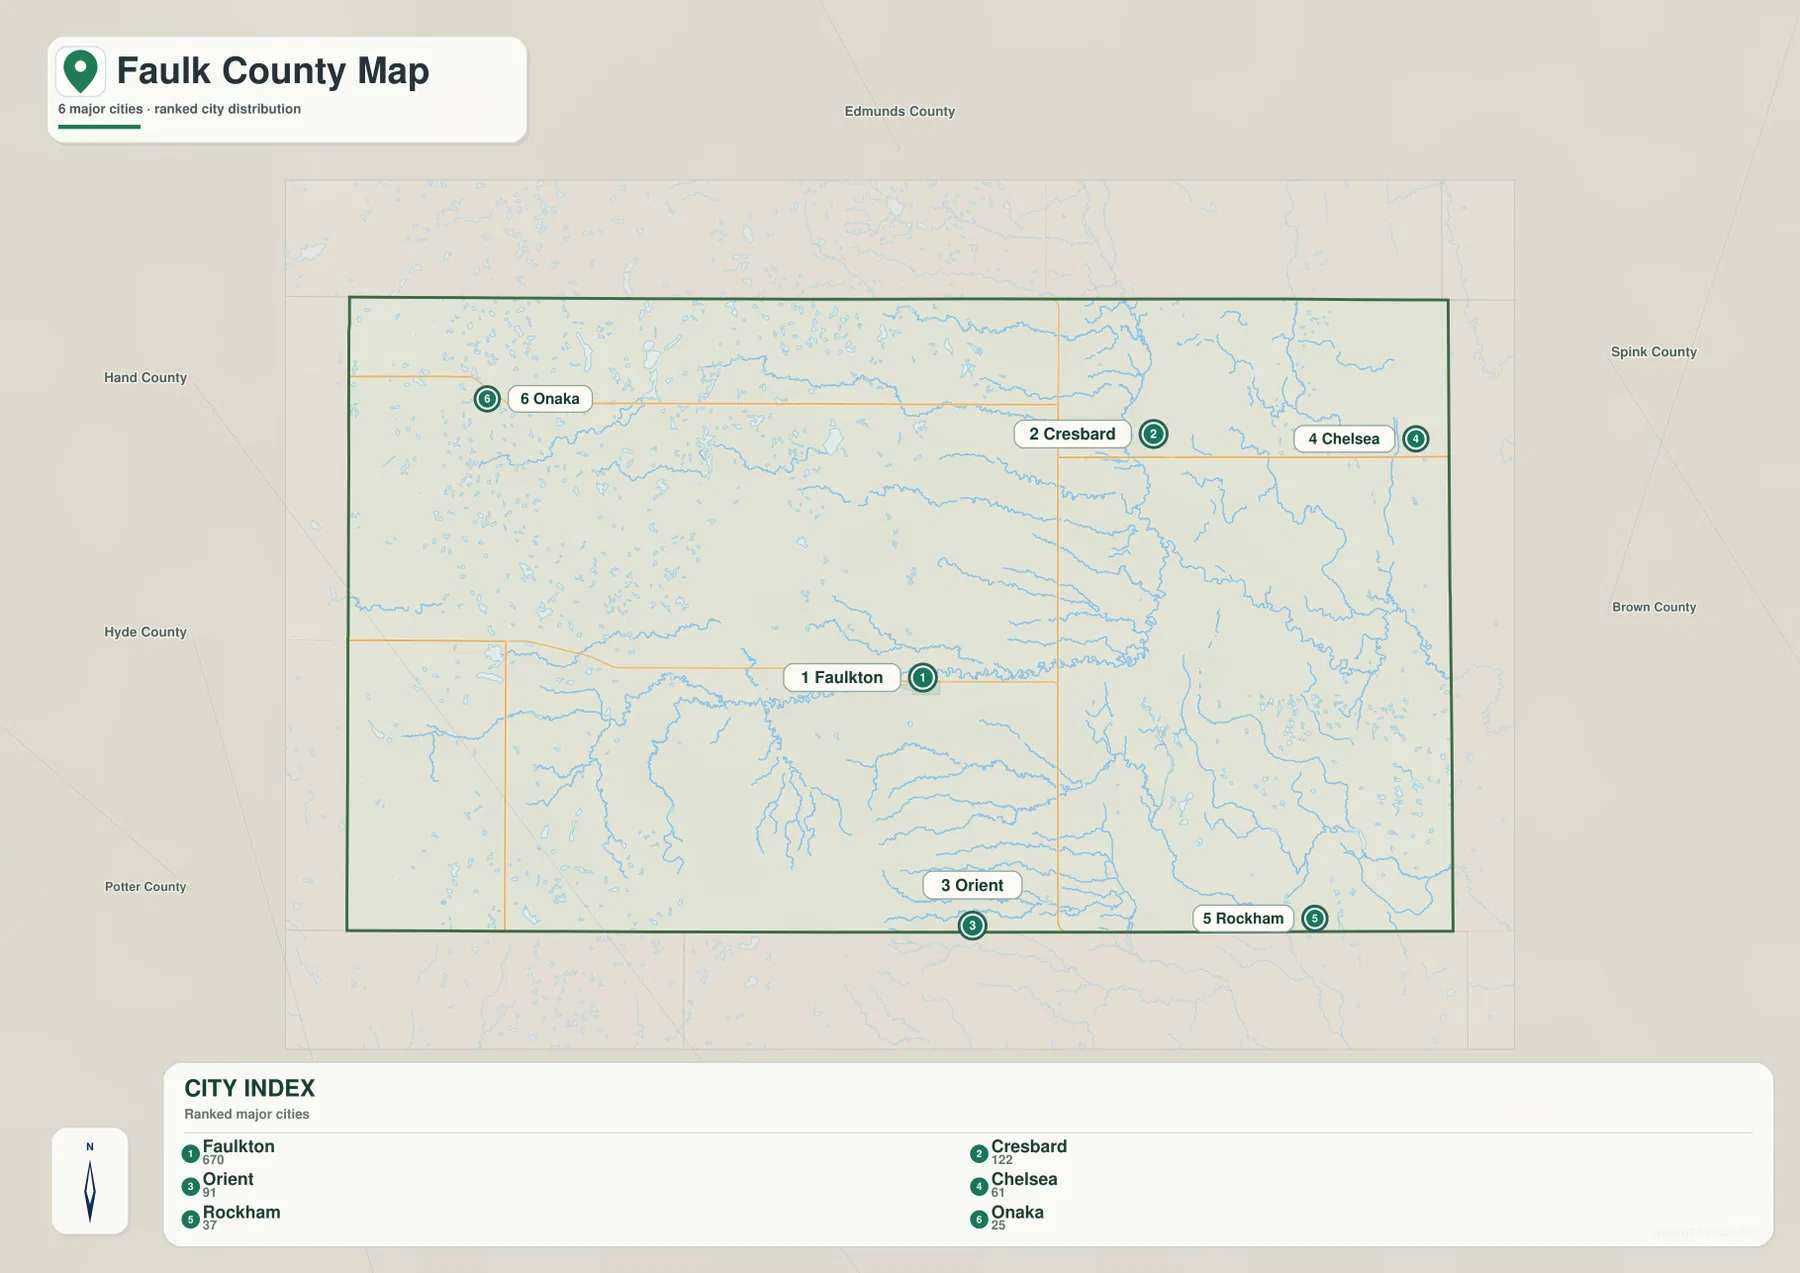
This stripped-down view can be more useful than the road map when the task is simply to explain where people live. A presentation about northern and southern communities, for example, does not require every numbered road or creek. If a route between those places matters, the reference map can then supply the road context. Using the two maps together prevents the common mistake of treating a clean city index as if it were a routing or travel-distance graphic.
Lake Faulkton leads into the stronger Snake Creek drainage in the east
The terrain-and-water map changes the visual emphasis from roads to drainage. Latham Lake is labeled in the west, and Lake Faulkton provides an easy central landmark along the main east-west watercourse. Farther east, North Fork Snake Creek descends from the north while South Fork Snake Creek approaches from the south-central part of the county and bends northeast. The two forks draw close together in the eastern half, where the channel network becomes more prominent than it is across much of the west.
There is still plenty to notice away from the Snake Creek forks. Clark Lake appears in the northwest and Hamak Lake near the northern side. Vogeler Lake lies south of the center, while Bryant Creek and Gooder Creek cross the southern half. Gerkin Lake and Zell Lake are labeled farther southeast, with Dove Creek nearby. On the eastern side, Perry Creek and Preachers Run add more named drainage. The distribution is therefore mixed: small lakes are scattered across several parts of the county, but the most continuous named creek corridors are concentrated toward the east.
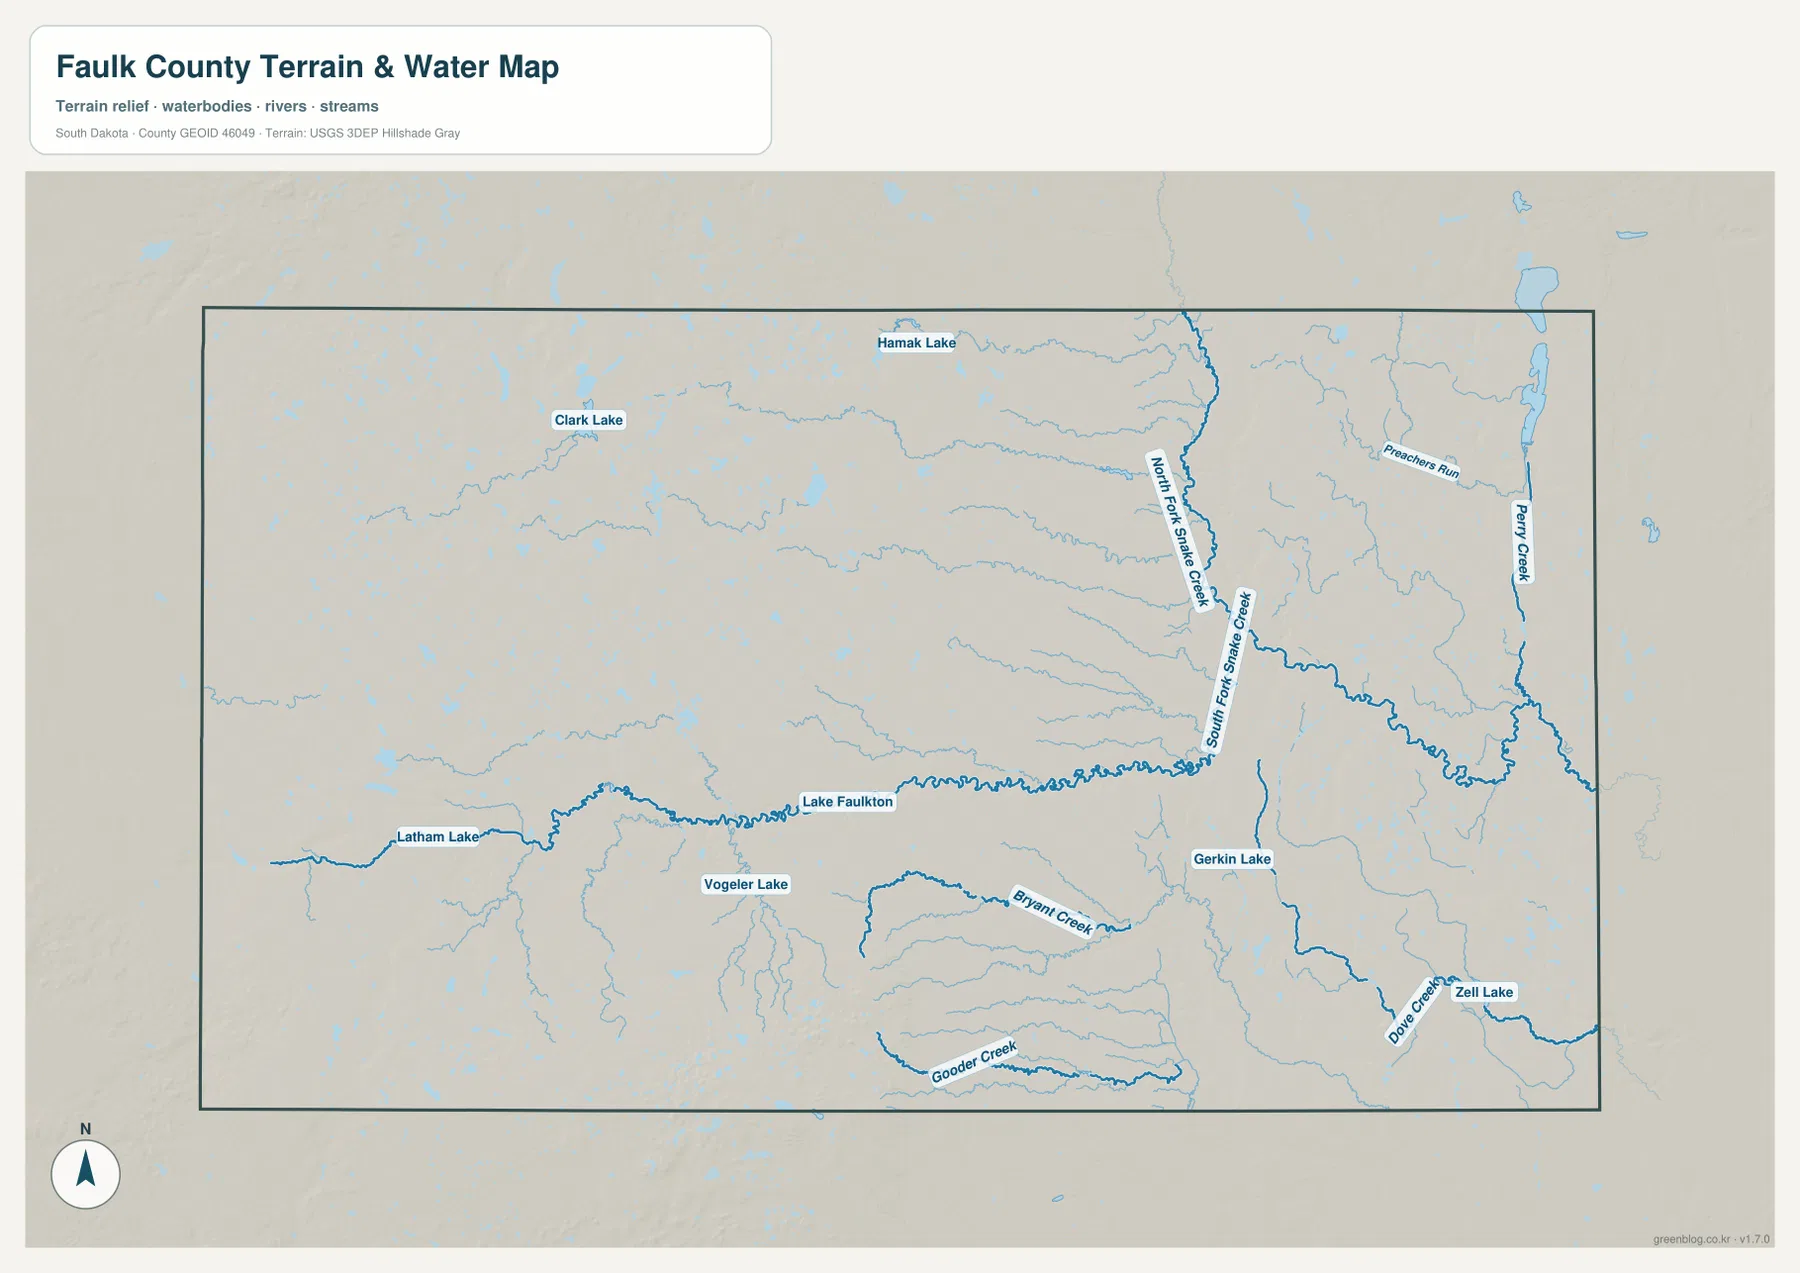
The shaded background helps connect those water lines to the surrounding land, but this is not a flood-hazard or legal-water-boundary map. It is intended for county-scale geographic reference. Anyone needing current hydrography, regulatory limits, or detailed flood information should use the appropriate official dataset. For general reading, the most useful comparison is simply to locate Lake Faulkton first and then follow the named drainage east toward the Snake Creek forks.
A 402–617 m elevation range separates western high ground from eastern valleys
The elevation map makes the west-to-east contrast unmistakable. Brown and tan colors cover much of western Faulk County, then fade through yellow and light green near the center before the eastern half becomes predominantly green. The legend gives an actual elevation range of roughly 402 to 617 meters and a mean near 496 meters. That creates a spread of about 215 meters between the lowest and highest mapped elevations, a substantial difference for a county that may look comparatively flat on a simple road map.
The change is broad rather than perfectly uniform. A pronounced higher area is visible in the southwest, and the east contains many smaller valleys and ridges rather than one smooth plane. The lowest-looking green channels line up especially well with the eastern drainage seen on the water map. Following North Fork Snake Creek and South Fork Snake Creek across both images shows why those streams stand out: they occupy lower corridors cut into the eastern side of the county.
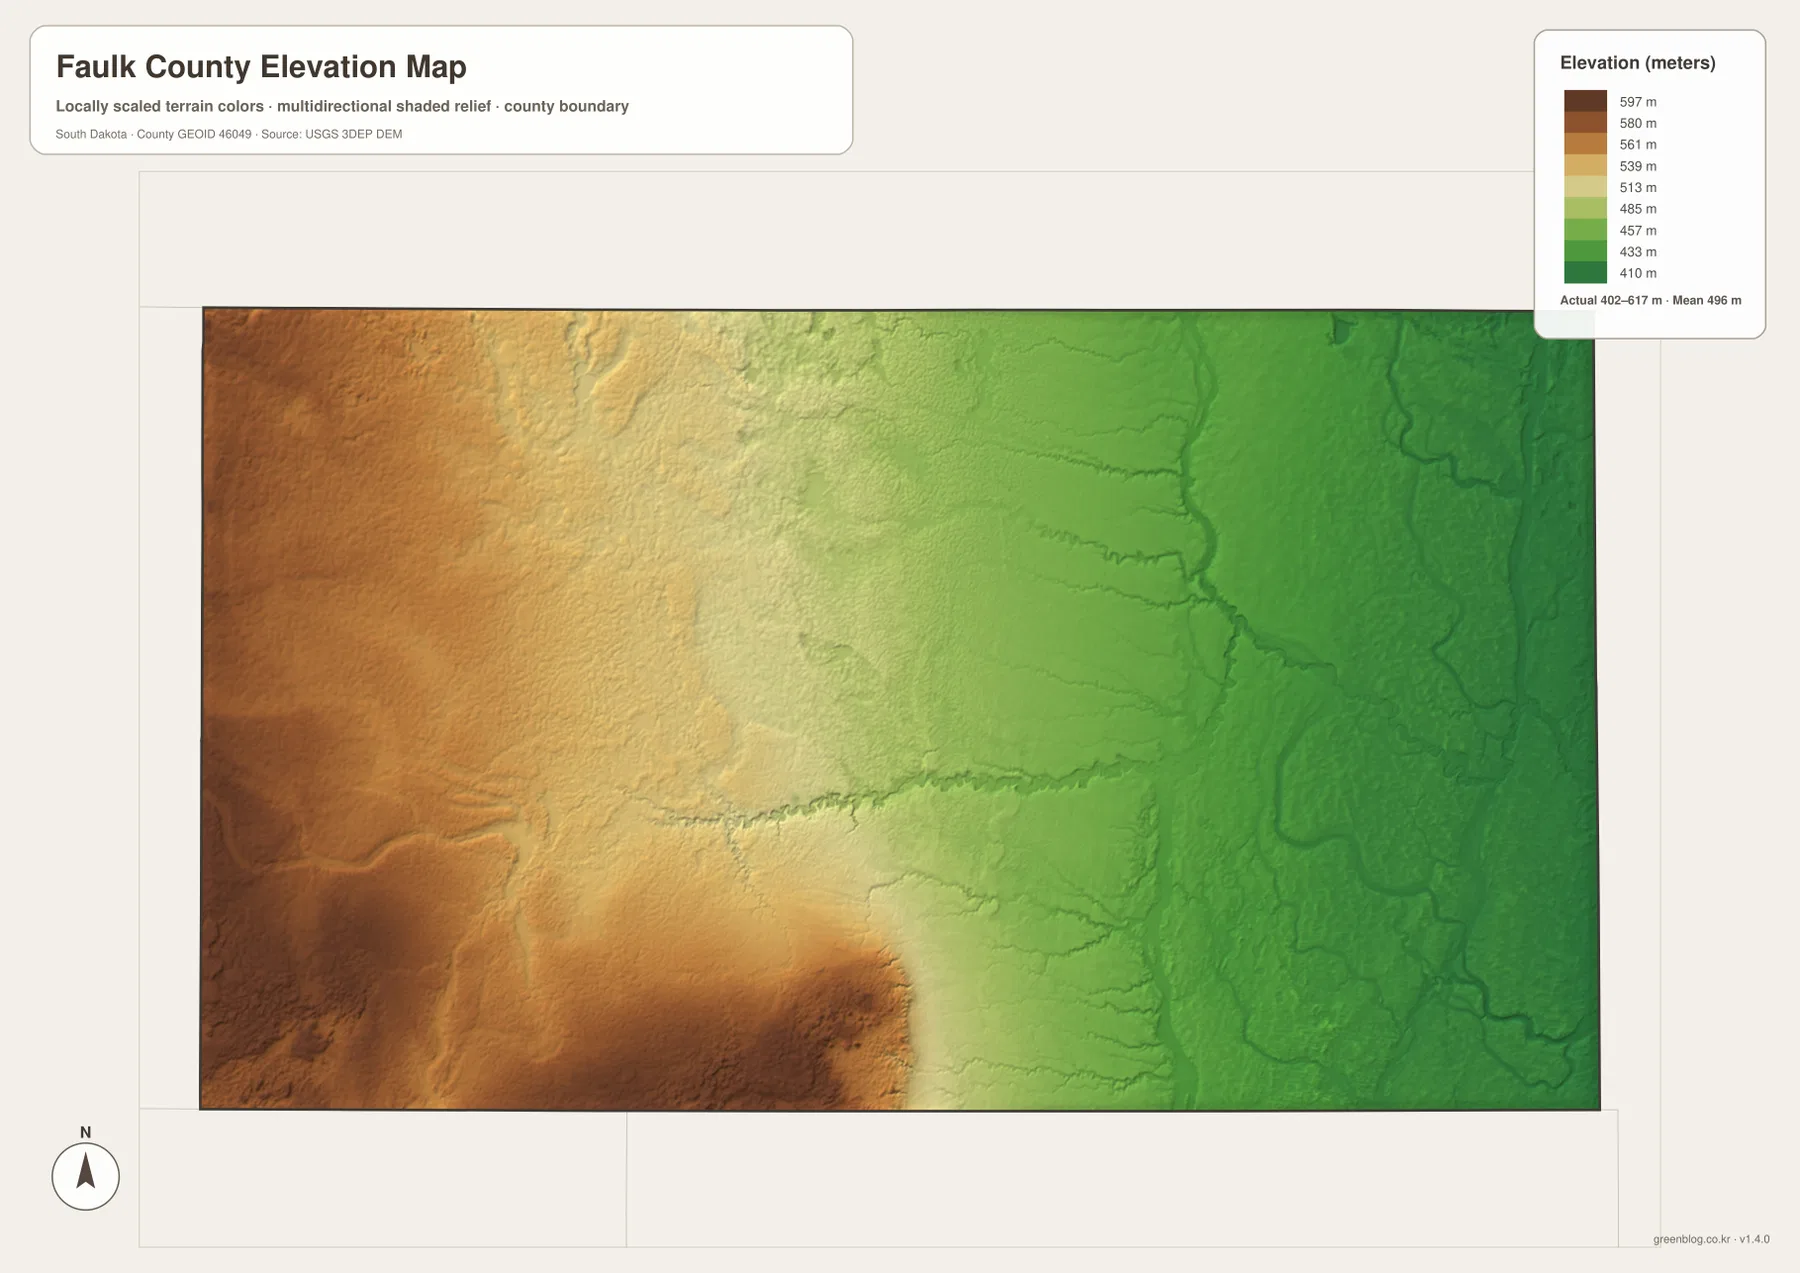
The color surface is meant for regional comparison, not survey-grade measurement. A parcel, road project, or construction site may require much more precise elevation data than a county overview can provide. For that purpose, the USGS 3D Elevation Program is the appropriate starting point. On this page, the map works best when the goal is to explain why western Faulk County looks higher and drier in relief while the eastern creek network follows lower terrain.
Keeping the same landmarks in view makes the four files work as one set
A practical way to compare the maps is to keep Faulkton and Lake Faulkton in mind while changing views. On the road map, Faulkton establishes the center and the nearby numbered routes. On the community map, the same location shows how far the northern and southern places are spread from that center. Moving to the water view brings Lake Faulkton and the eastern Snake Creek system into focus. The elevation map then explains the broader west-high/east-low setting without requiring a completely new set of reference points.
Different tasks naturally favor different files. The reference map is the strongest choice for roads, named places, and the county outline. The community view is cleaner when only the relative position of the six labeled places matters. The terrain-and-water map is better for named lakes and creeks, while the elevation map is the clearest summary of relief. They cover the same county, so the most useful file is the one that matches the question rather than the one with the most labels.
The WebP images in the article are sized for convenient browser viewing. The download below contains the matching high-resolution JPG originals at 3638 × 2572 pixels. The ZIP includes the county reference map, community-distribution map, terrain-and-water map, and elevation map, making it suitable for larger displays, A3 printing, classroom use, presentations, or personal geographic reference.
Frequently Asked Questions
Does the community map show distances between Faulkton and the other places?
No. This version of the community-distribution map has numbered place markers but no connector lines and no mileage labels. It is useful for comparing direction and relative location: Onaka is northwest of Faulkton, Cresbard and Chelsea are northeast, Orient is to the south, and Rockham is southeast. Driving distance and travel time should be checked with a current road-routing source.
Where are the two main Snake Creek forks easiest to see?
North Fork Snake Creek and South Fork Snake Creek are most prominent in eastern Faulk County. The north fork comes down from the northern part of the county, while the south fork approaches from the south-central area and bends northeast. They draw close together in the east, where Perry Creek, Preachers Run, and other drainage lines also make the water network more noticeable.
How large is the elevation difference shown across Faulk County?
The map legend lists an actual range of about 402 to 617 meters, with a mean near 496 meters. That is roughly a 215-meter difference from the lowest to the highest mapped elevations. Higher brown and tan ground dominates the west, while lower green terrain becomes widespread in the east, especially along the creek valleys.
Map File Information
The ZIP file contains high-resolution JPG originals of the Faulk County reference map, community-distribution map, terrain-and-water map, and elevation map.
- Included Files: 4 JPG maps
- Printable Size: 3638 × 2572 px each
Related Maps
Sources and references
- U.S. Census Bureau QuickFacts – Faulk County, South Dakota
- U.S. Census Bureau TIGER/Line Shapefiles
- South Dakota Department of Transportation – Maps
- USGS National Hydrography
- USGS 3D Elevation Program
Green Map creates custom-edited map images using open geographic data sources such as geoBoundaries, Natural Earth, OpenStreetMap, and government open data.
These maps are edited visual materials, not raw data files, and are provided for education, documents, presentations, and graphic reference.