Statistics Canada’s archived 2007–2008 Human Activity and the Environment: Annual Statistics, Section 1, is most useful today as a historical map-and-data guide to how Canada’s climate was organized and discussed at the time. The key spatial reference is Map 1.1, Canadian climate regions, which divides the country into 11 climate regions. That map becomes much more informative when it is read beside Table 1.7 on regional temperature departures and Table 1.6 on 1971–2000 temperature and precipitation normals at selected weather stations.
The first thing to notice is the archive notice. Statistics Canada states that the page is preserved for reference, research or recordkeeping, has not been altered or updated since it was archived, and is not a current web product. It should therefore not be treated as a source for today’s greenhouse-gas totals, present-day climate hazards, current adaptation programs or the latest temperature trend. Its value is historical: it preserves the geographic framework, data periods and analytical context used in the 2007–2008 edition.
What you can actually get from the official page
The section is part of a larger Statistics Canada publication with separate navigation for the overview, sections, tables, charts, maps, methodology and PDF version. Within Section 1, the material moves from climate concepts to greenhouse-gas emissions, climate-change impacts, and adaptation and mitigation. This structure matters because the map is not presented as a stand-alone risk layer. It is one reference within a chapter that uses charts, station normals, regional trend tables and explanatory text together.
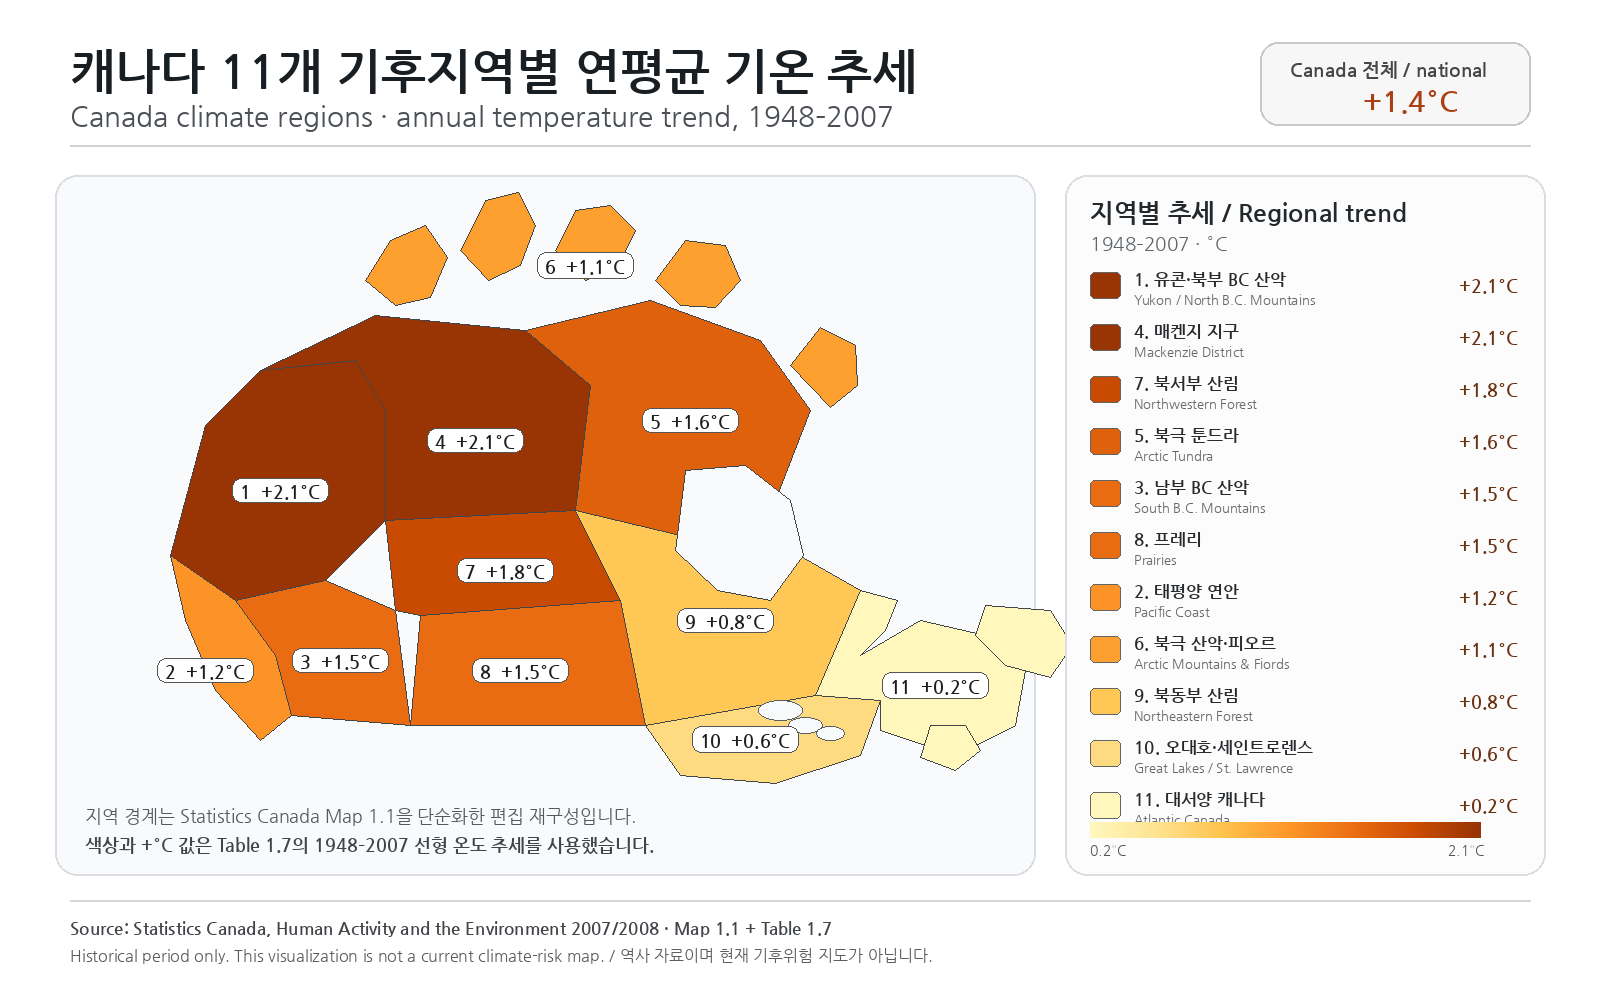
For a map-focused reader, Map 1.1 is the logical entry point. The report groups places with similar climate into 11 regions: Atlantic Canada; Great Lakes and Lower St. Lawrence; Northeastern Forest; Northwestern Forest; Prairies; South British Columbia Mountains; Pacific Coast; North British Columbia Mountains and Yukon Territory; Mackenzie District; Arctic Tundra; and Arctic Mountains and Fiords. Table 1.7 uses those same climate-region names, allowing the map and the numerical trend table to be matched directly.
These regions are not simply provinces and territories with different labels. A province can span more than one climate setting, and a climate region can cut across administrative boundaries. That is why the map should be consulted before reading the trend table. If you assume that every row is a provincial statistic, you can attach the wrong geography to the number.
A practical map-first reading sequence
Start with the region, not the number. Locate the area of interest on Map 1.1 and record the climate-region name. The map’s main job is to establish the spatial unit used in the surrounding discussion. It is especially helpful in a country where coastal, continental, mountain, northern and Arctic climates differ sharply.
Then move to Table 1.7. The table covers annual regional temperature departures, trends and extremes for 1948–2007. It reports a trend, a 90% confidence interval where applicable, the coldest and warmest years on record, and the 2007 rank and departure. For Canada as a whole, the reported trend is 1.4°C, with a 90% confidence interval of 0.7°C to 1.7°C. Some regional entries are marked as not statistically significant, an important caution against ranking rows by the trend number alone.
Use Table 1.6 to understand baseline climate. That table presents average daily temperatures and precipitation for selected stations over 1971–2000. Locations include St. John’s, Montréal, Toronto, Winnipeg, Calgary, Vancouver, Whitehorse, Inuvik and Resolute, among others. A regional trend tells you about change over time; a station normal tells you what the climate at a particular station was like during the stated reference period. Those are complementary questions, not interchangeable measures.
Check Chart 1.10 for the national signal. Statistics Canada describes an increasing trend of 1.4°C in annual national temperature departures over 1948–2007 relative to the 1951–1980 temperature average. The chart gives the national context, while Map 1.1 and Table 1.7 show why a single national value should not be assumed to represent every part of the country.
What the regional values say—and what they do not say
The historical table shows substantial regional variation. North British Columbia Mountains and Yukon Territory and the Mackenzie District each have a reported trend of 2.1°C. Northwestern Forest is 1.8°C, Arctic Tundra 1.6°C, Prairies 1.5°C, South British Columbia Mountains 1.5°C and Pacific Coast 1.2°C. Atlantic Canada, Great Lakes and Lower St. Lawrence, and Northeastern Forest have smaller values and are marked as not statistically significant in the table.
Those values should be described with their period attached: 1948–2007. They are not a current ranking of Canadian warming, and they should not be projected forward without newer data. A careful use of the report is to say that the 2007–2008 Statistics Canada publication documented stronger warming trends in several northern and western climate regions during its observation period, while also showing that the statistical evidence differed by region.
| Official item | Geography / period | Best use |
|---|---|---|
| Map 1.1 · Canadian climate regions | 11 Canadian climate regions | Identify the spatial unit used by the regional discussion |
| Chart 1.10 · Annual national temperature departures | 1948–2007; departures from 1951–1980 mean | See the national long-term signal |
| Table 1.6 · Average temperature and precipitation | Selected stations; 1971–2000 | Understand local baseline climate and seasonality |
| Table 1.7 · Regional temperature departures | 11 climate regions; 1948–2007 | Compare regional trends, extremes and 2007 departures |
Weather events are not the same thing as a climate trend
The chapter makes a distinction that is still essential when reading any climate map. Weather describes atmospheric conditions at a particular time and place. Climate describes the long-term characteristics of weather, and the report explains that climate normals are produced from observations averaged over at least 30 consecutive years.
That means a single storm, a very cold month or one unusually hot summer is not by itself evidence of a climate trend. The report explicitly notes that weather extremes are a normal feature of climate variability. The climate-region map and multi-decade tables are useful precisely because they shift attention from individual events to longer-term regional patterns.
Where snow, ice and glacier information fits
After the regional climate discussion, the section turns to extreme events, snow and ice, and glaciers. It notes that Canadian glaciers are found in the western cordillera and mountains of the eastern Arctic and gives a historical estimate of just over 200,000 square kilometres of glacier area from the data available at the time. The report also cautions that the national glacier inventory was incomplete and that total ice volume was poorly known.
That caveat is important for map users. A mapped or tabulated estimate does not eliminate gaps in observation. Historical glacier area, sea-ice discussion and flood-related impacts in this chapter should not be treated as a replacement for a current cryosphere dataset or a present-day hazard map. The section documents what was known and assembled for the 2007–2008 statistical publication.
Keep emissions and climate geography as separate analytical layers
A large part of Section 1 addresses greenhouse-gas emissions, including 1990–2005 estimates, emission categories, industry and consumption perspectives, and international and provincial comparisons. These tables answer questions about emissions, not about the temperature trend of a climate region.
It would therefore be a mistake to place Map 1.1 beside an emissions table and infer that the climate region with the larger temperature trend was necessarily the region with the larger emissions. The report does not establish that relationship. A safer workflow is to use Map 1.1 and Table 1.7 for the historical regional climate pattern, then read the emissions material separately for the historical structure of Canadian GHG emissions.
Adaptation and mitigation are also time-stamped
The final part of the chapter distinguishes adaptation from mitigation. Adaptation is presented as reducing vulnerability to climate impacts, while mitigation concerns reducing greenhouse-gas emissions. The report includes examples of adaptation strategies, public programs, energy-efficiency measures, industry activity and emerging renewable-energy efforts.
These examples are valuable for historical context but should not be assumed to describe current Canadian programs. A policy, funding program or target mentioned in a 2007–2008 report may have ended, changed names or been replaced. If your question is about a current incentive, regulation or adaptation program, the archived report is a starting point for history, not the final authority.
When this archived guide is genuinely useful
The page is a strong source when you need to understand the historical Canadian climate-region framework used by Statistics Canada, verify the original context of a 1948–2007 temperature-trend figure, or trace a citation from an older paper or map back to the publication that presented it. It is also useful for teaching how a national climate signal can differ from regional signals and why administrative boundaries are not always the best units for climate analysis.
It is a poor choice for a current hazard decision. Do not use it to determine present flood exposure, wildfire risk, sea-level exposure, current glacier extent, current emissions or the status of a modern policy. Those questions require current official datasets and current maps.
How to use the Statistics Canada page step by step
Step 1: Open Statistics Canada’s Section 1: Climate change in Canada. Read the archive notice before using any value so the historical status is clear from the start.
Step 2: Open Map 1.1, Canadian climate regions, and identify the climate region for the area you are studying. Treat the region name as the key that connects the map to Table 1.7.
Step 3: In Table 1.7, read the 1948–2007 trend together with its confidence interval and statistical-significance note. Also check the warmest/coldest year and the 2007 departure if those fields matter to your historical comparison.
Step 4: Use Table 1.6 for selected-station normals from 1971–2000. Do not merge a station value and a climate-region value as if they had the same geographic coverage.
Step 5: If you continue into the glacier, emissions or adaptation material, keep the source date visible in your notes. The publication is internally coherent as a historical report, but it is not updated for present-day conditions.
Frequently asked questions
Is Map 1.1 a current map of Canada’s climate?
No. It is the climate-region map used in the 2007–2008 Statistics Canada environment publication. It remains useful for understanding the geography behind the historical tables, but it is not a live or current climate-status map.
Does the 1.4°C national trend mean every region warmed by 1.4°C?
No. The 1.4°C figure is the national trend reported for 1948–2007. Table 1.7 shows different values by climate region, and some regional trends are marked as not statistically significant. The national chart and the regional table answer different levels of the same historical question.
Can I use this report as the only source for current climate-change information?
No. Statistics Canada labels the page as archived and not updated. Use it for historical context and source verification. Current climate conditions, hazards, emissions and programs should be checked against current official products.
Official source
This guide uses one anchor document only: Statistics Canada, Human Activity and the Environment: Annual Statistics 2007 and 2008 — Section 1: Climate change in Canada. When citing the material, keep the archive status, table or map number, and reference period with the claim. That makes it clear that the figures describe the historical dataset used in this publication rather than present-day Canada.
Related Maps
Green Map creates custom-edited map images using open geographic data sources such as geoBoundaries, Natural Earth, OpenStreetMap, and government open data.
These maps are edited visual materials, not raw data files, and are provided for education, documents, presentations, and graphic reference.