Union County in southern Illinois is unusual for the near balance between forest and agriculture. The supplied 2025 map classifies 44.50% of the county as forest and 40.64% as agriculture, with a broad wooded interior contrasting with open land along the Mississippi side and in parts of the east and south. This page uses four views to explain that pattern: general land cover, forest and farmland, impervious surface, and mapped class differences from 1985 to 2025.
The four original JPG maps are also available together in one downloadable ZIP. They are useful when you need to compare wooded hills with farm areas, separate the Anna–Jonesboro developed cluster from the surrounding countryside, examine wetland and water patterns near the western bottomlands, or locate places where the mapped class differs between the two comparison years. Land cover describes what physically covers the ground in the satellite-based dataset; it is not a parcel map, ownership record, zoning map, or statement about what land may legally be developed.
Table of Contents
Forest is the largest class, but it does not cover Union County evenly
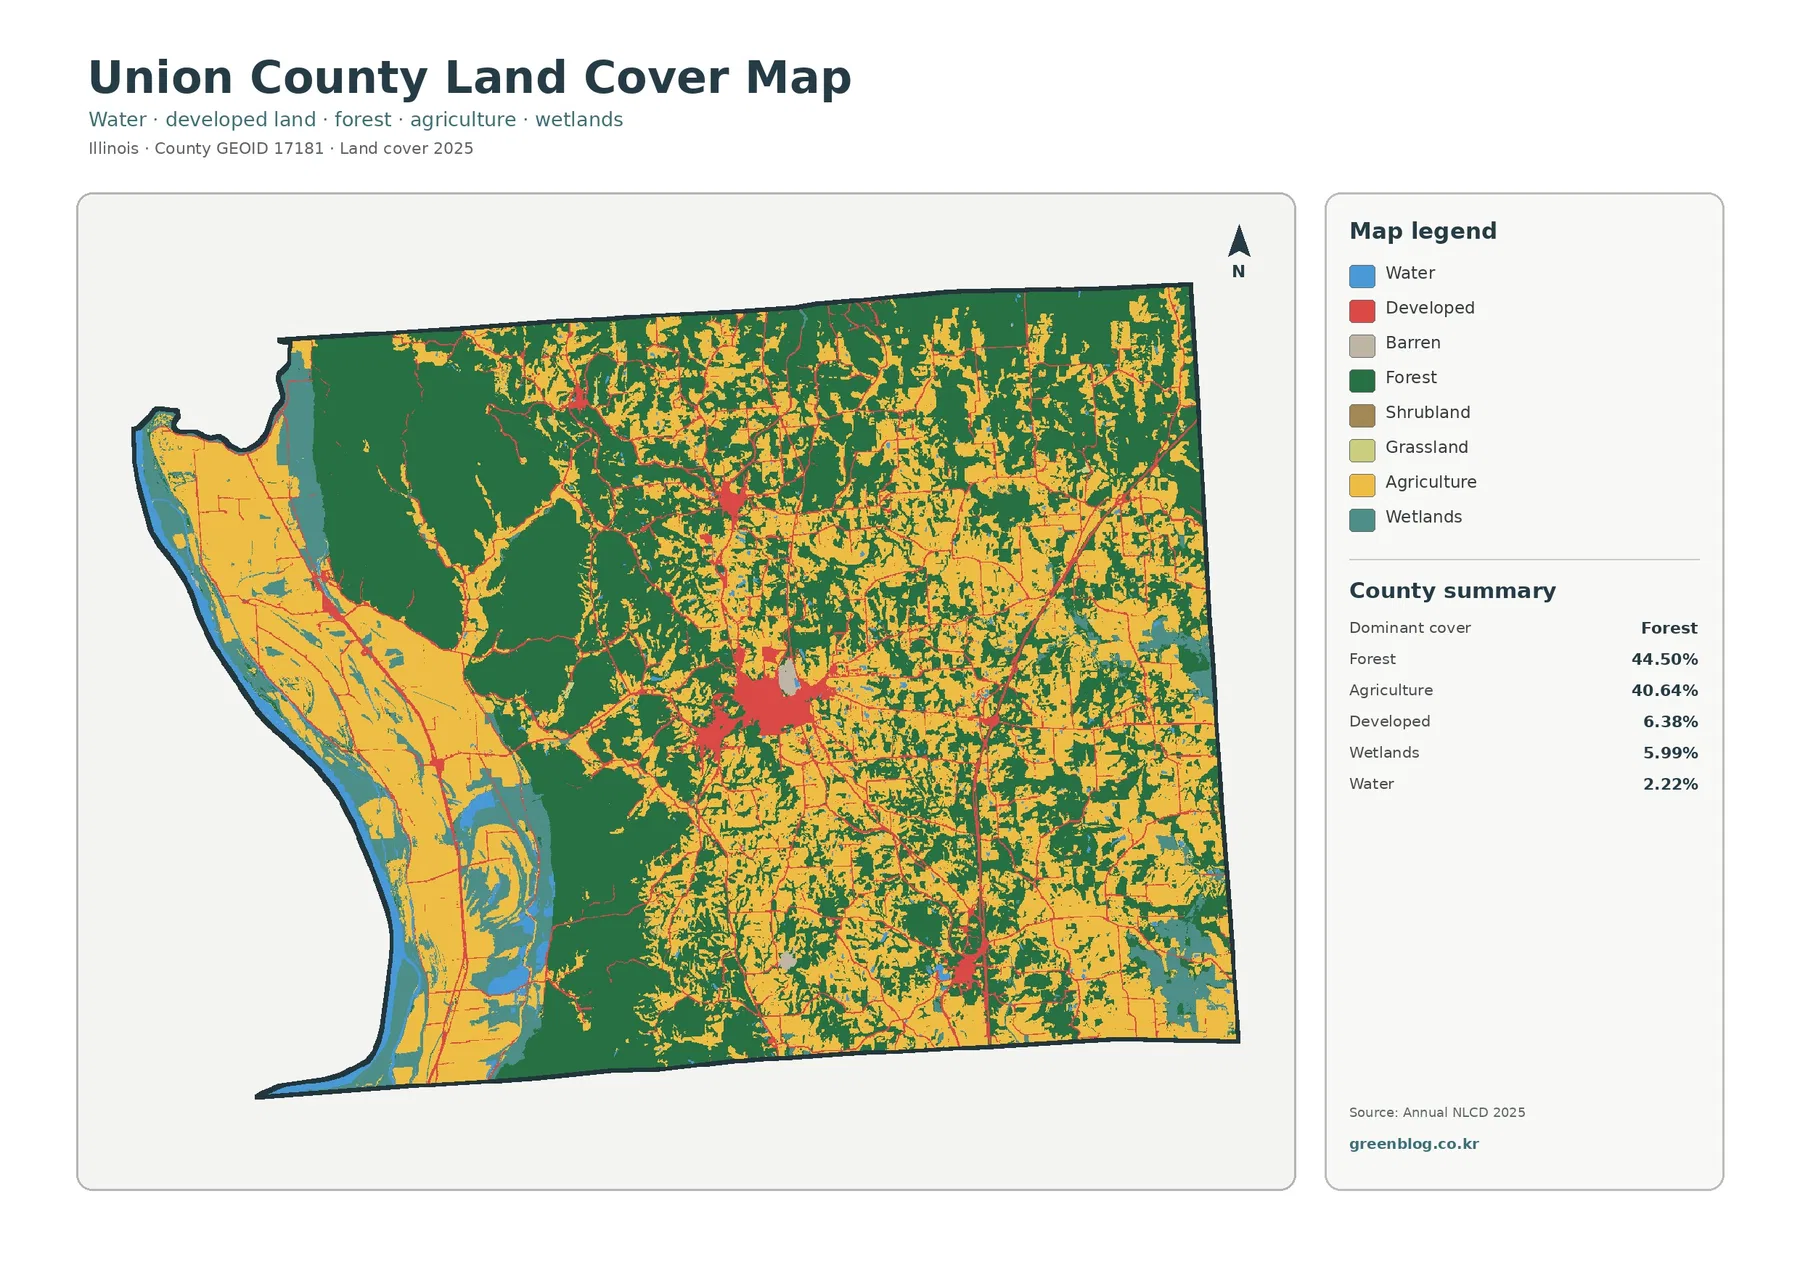
The county summary gives forest a 44.50% share, slightly ahead of agriculture at 40.64%. Together those two classes account for more than 85% of the mapped area, yet the general map makes clear that they occupy different parts of the landscape. Large dark-green forest blocks dominate much of the western interior, north, and southwest. Yellow agricultural cover is especially broad near the Mississippi side and across more open parts of the eastern and southern county. Developed land is 6.38%, wetlands 5.99%, and water 2.22%, while grassland and shrubland make up only very small fractions.
The Mississippi bottomlands create the strongest contrast along the west side
The western edge of the county looks very different from the wooded interior. Long agricultural areas follow the river side, with water and wetland colors appearing beside and within that lowland landscape. The Illinois Department of Natural Resources describes the Union County State Fish & Wildlife Area as 6,202 acres in the Lower Mississippi River bottomlands and notes numerous shallow sloughs and other water areas. The supplied county map covers a much larger area than that wildlife site, but the official description is useful local context for understanding why wetlands and water are important parts of Union County’s western landscape.
The forest-and-farmland view reveals a patchwork rather than a clean east-west split
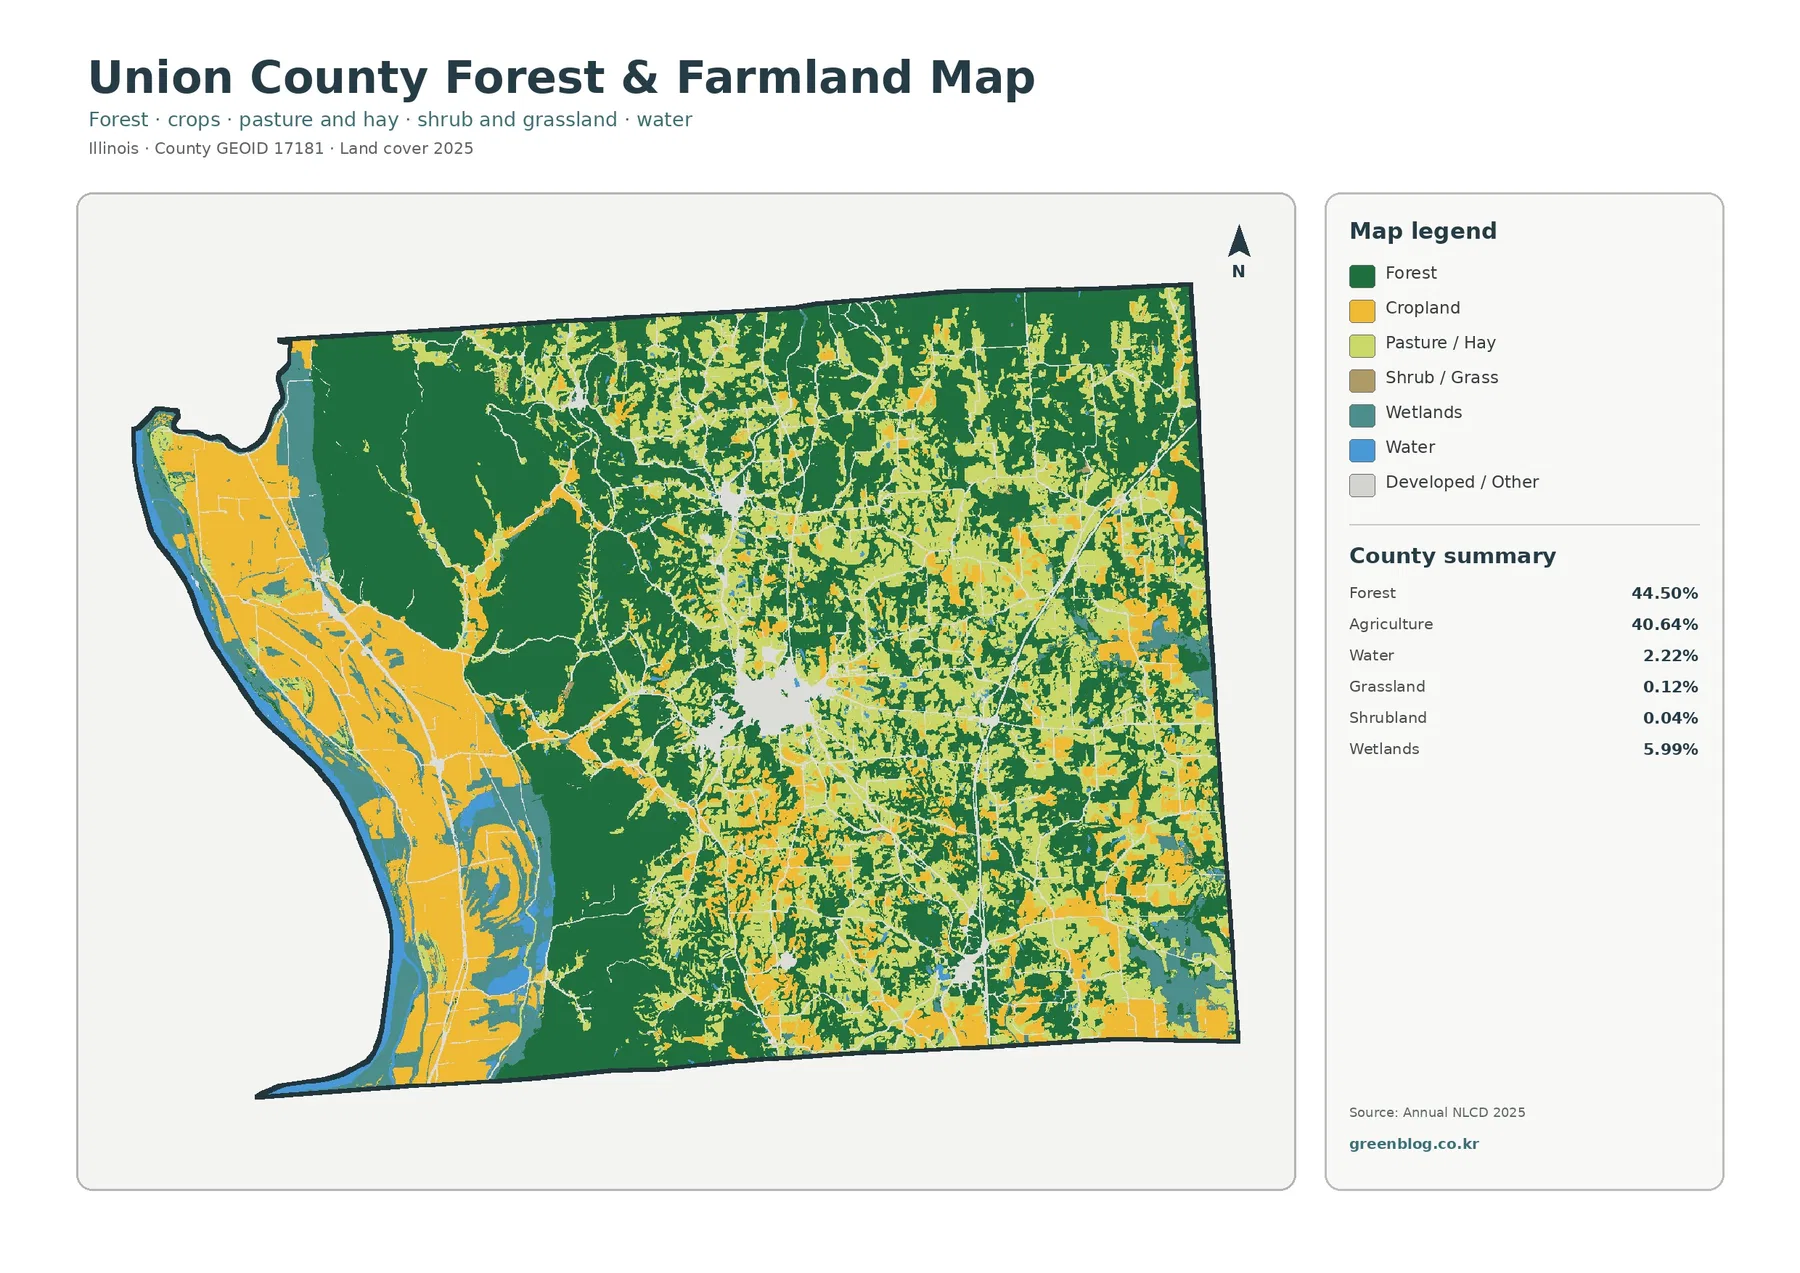
Removing most of the developed-land detail brings the 44.50% forest and 40.64% agriculture shares into direct comparison. Dark green forms large connected areas in the western interior and northern county, while cropland occupies the Mississippi-side lowlands and many openings in the east and south. Between those large areas are narrow wooded branches and small farm clearings. The pattern is too complex to describe as one half forest and one half farmland; it is better understood as several large wooded blocks separated by valleys, openings, fields, roads, and settlements.
Anna and Jonesboro form the clearest developed cluster on the map
Developed cover is only 6.38% of Union County, but the central built-up area is easy to recognize. Illinois State Archives records Jonesboro as the county seat and lists Anna, Cobden, Dongola, and other municipalities in the county. The largest central developed patch aligns with the Anna–Jonesboro area, while smaller clusters appear farther north and south. Rural roads extend outward as thin lines, so the built pattern looks compact around town centers rather than evenly spread through the forest and farm landscape.
Mean impervious cover is only 1.24%, with hard surfaces concentrated in towns and roads
Union County’s mean impervious value is 1.24%, and only 0.42% of the county is mapped above 50% impervious. Those numbers fit the visual pattern: most of the county remains very pale, while stronger values are confined to the central town area, several smaller settlements, and road corridors. An impervious surface is a surface that water does not readily soak through, including many rooftops, paved streets, and parking lots. It is therefore a narrower measure than the developed-land class.
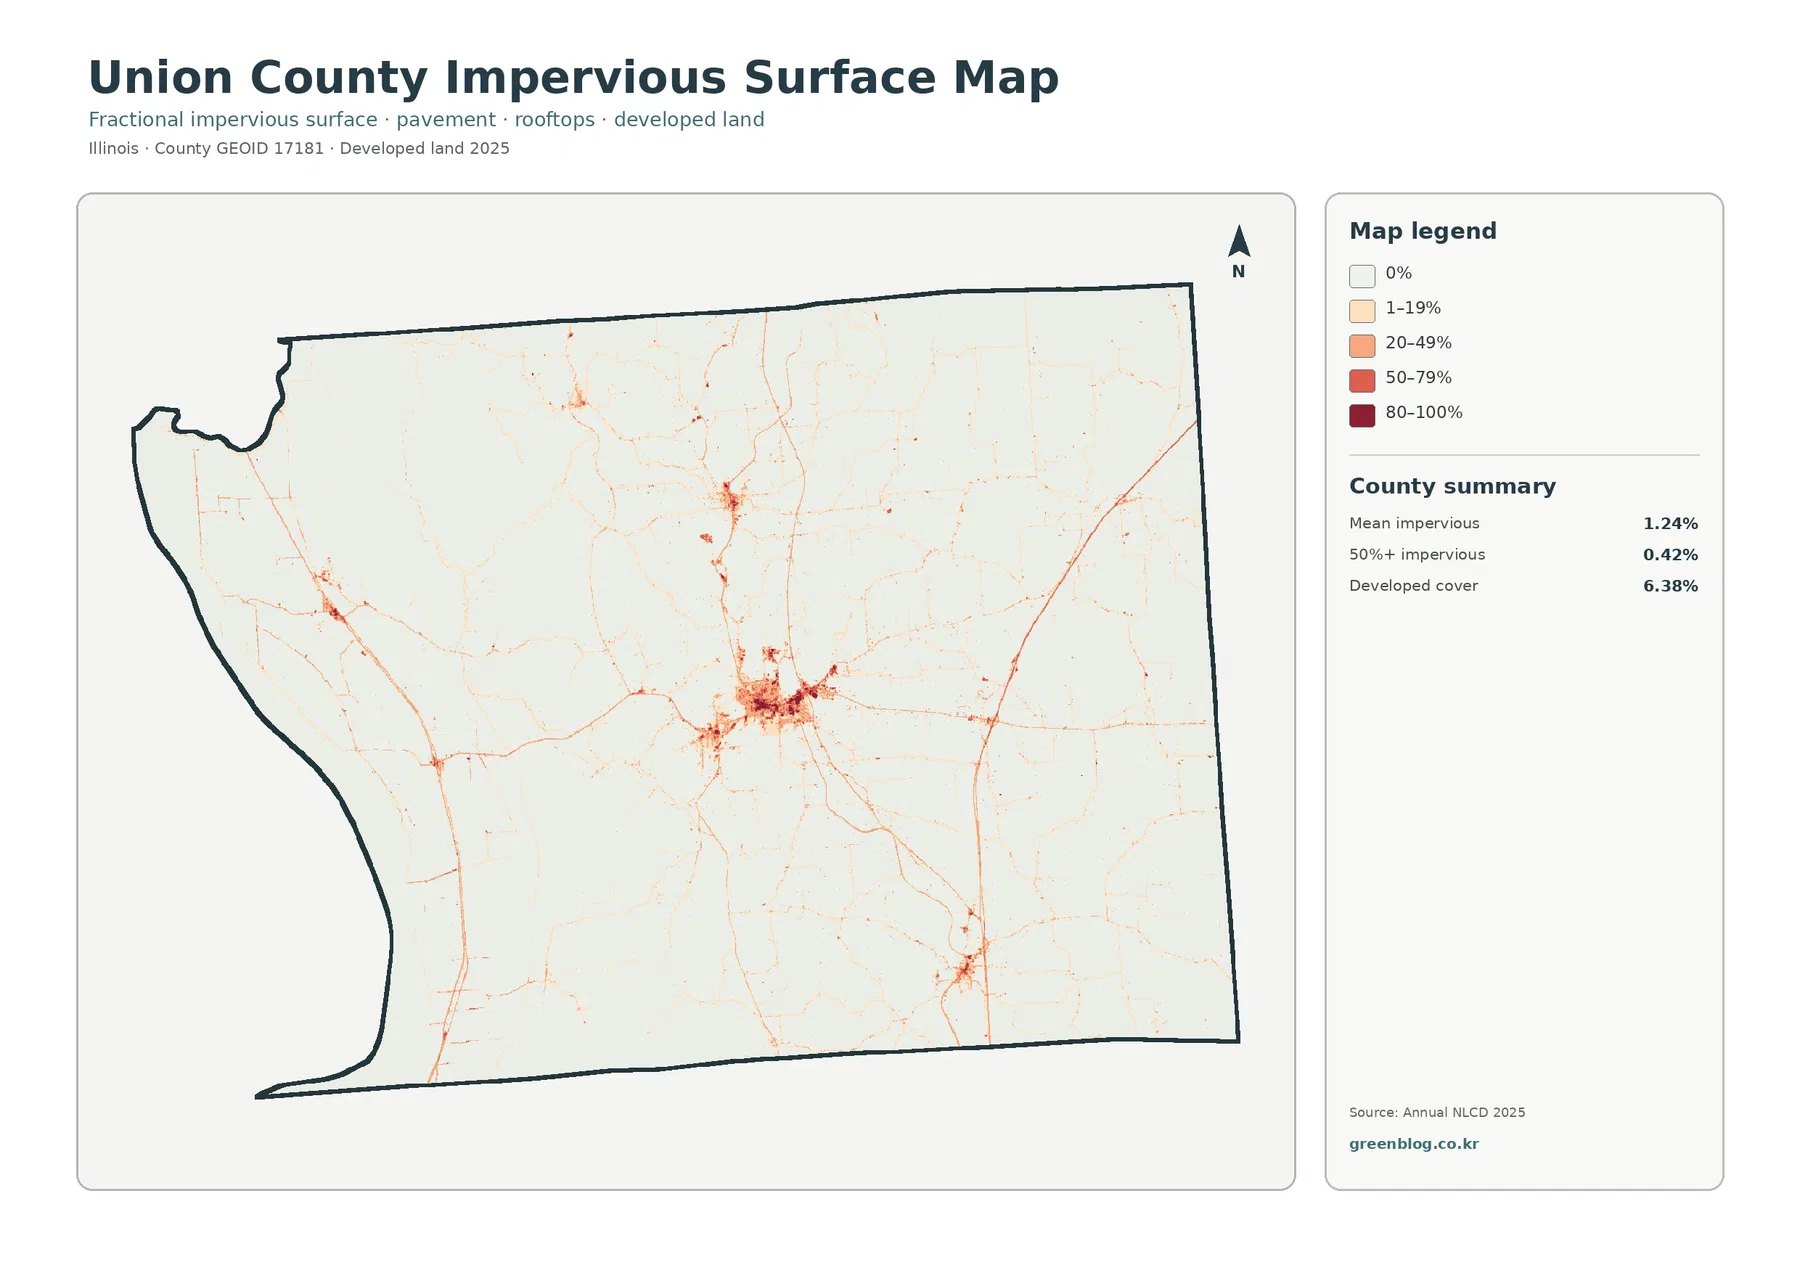
The central cluster is the clearest concentration, with lines of higher values extending out along transportation routes. Separate small spots appear to the north and south, but the broad forest and agricultural areas show little hard-surface cover. Comparing this image with the general land-cover map is useful because it prevents an easy mistake: a developed pixel does not mean every part of that area is paved. In low-density development, trees, yards, grass, and other permeable surfaces can still occupy a substantial share.
Most of the 1985–2025 difference is not labeled as development, forest loss, or farm loss
The change map reports a total class difference of 9.78% between 1985 and 2025. Within that summary, 0.98% is mapped as a change to developed, 0.92% as forest loss, and 1.38% as agricultural loss. The largest single category is “other class difference” at 6.18%. That breakdown is essential because the total 9.78% should not be quoted as a confirmed land-use conversion rate. Most of the colored area belongs to a broader difference category rather than one specific transition.
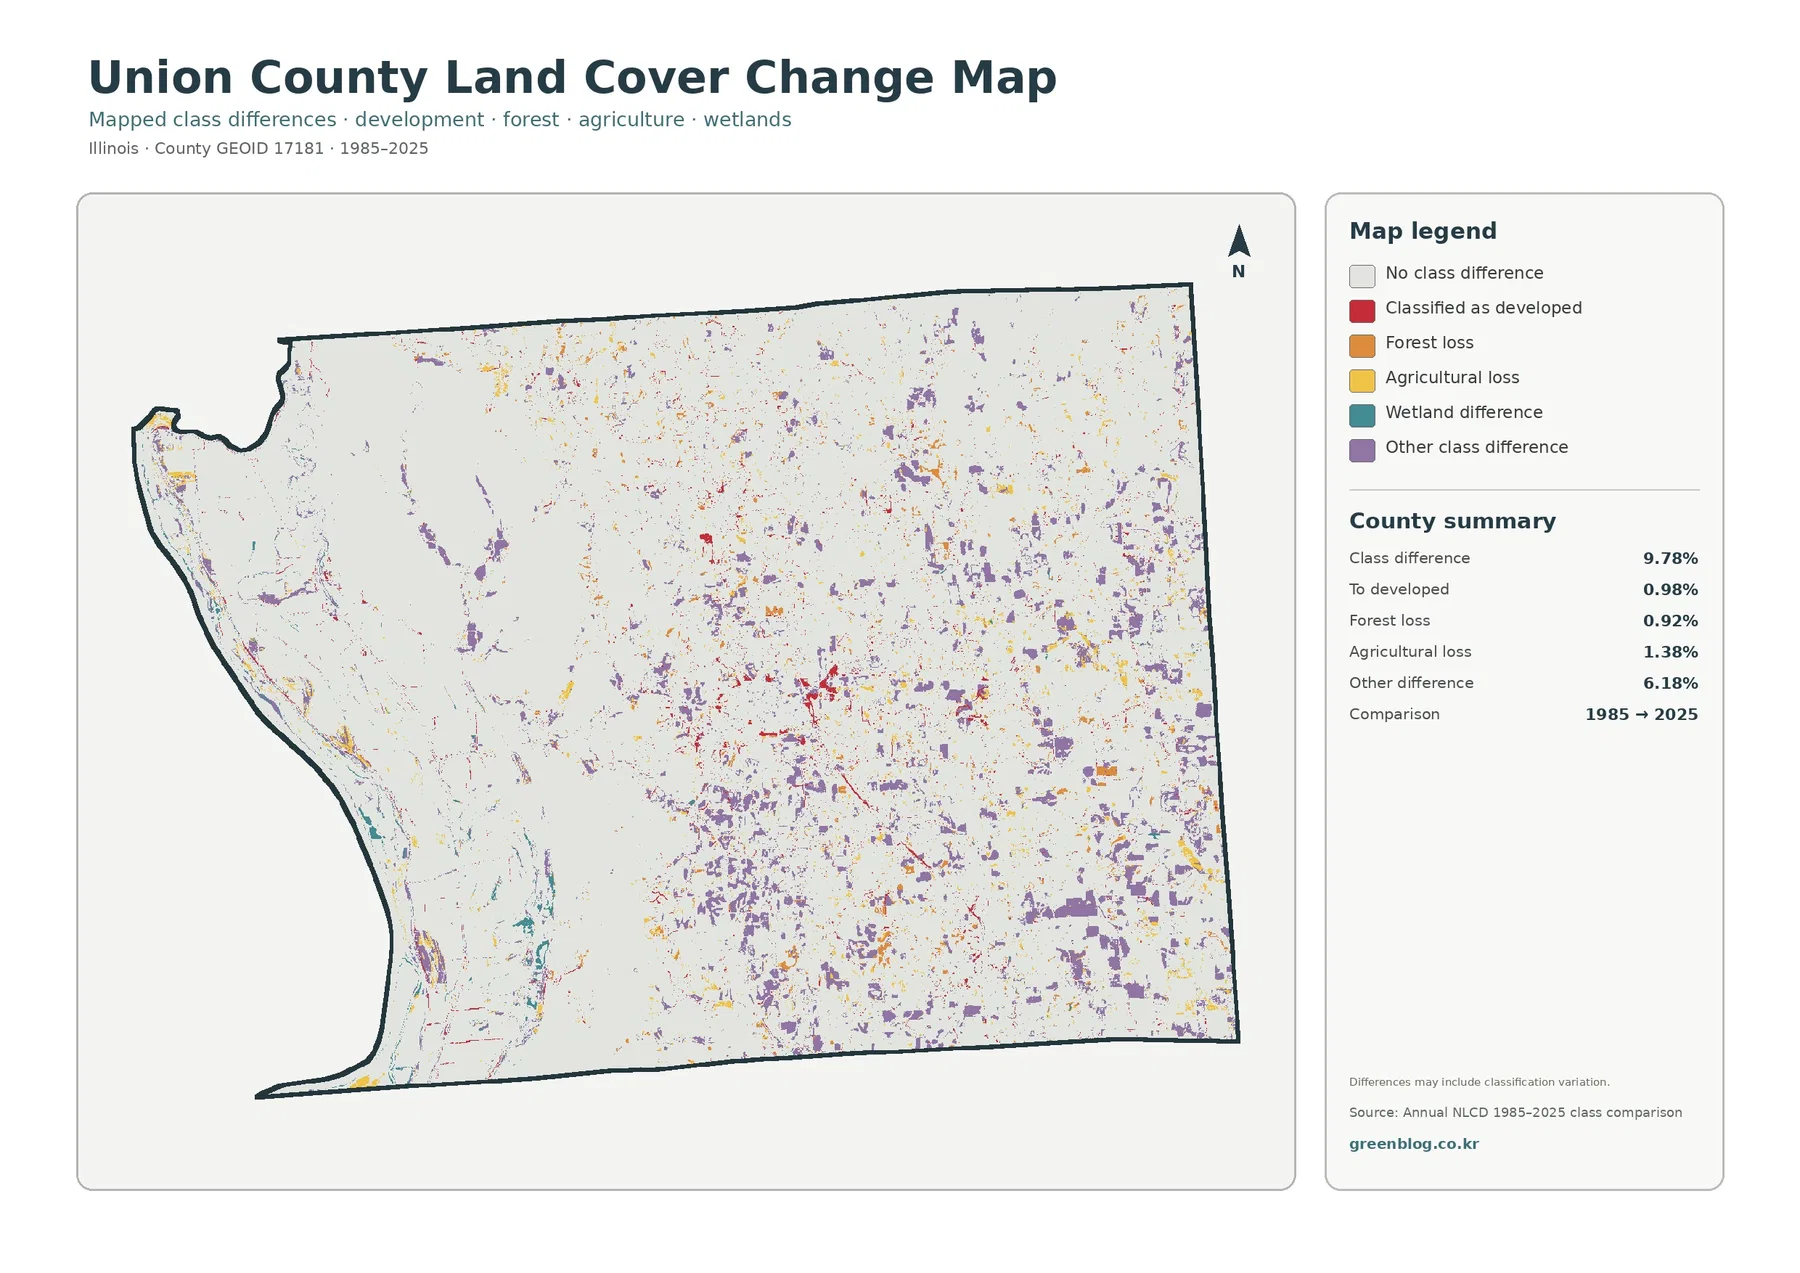
A colored cell on this map is a reason to investigate, not proof of a specific historical event. Satellite image conditions, classification methods, seasonal differences, and mixed pixels can all change how a cell is assigned between years. Edges between forest and farmland, narrow roads, wetlands, and water are especially prone to small classification differences. If a particular farm, forest tract, or development site matters, compare several Annual NLCD years with aerial imagery and local records before describing the change as confirmed.
A 30-meter raster is designed for county patterns, not parcel boundaries
Annual NLCD is raster data, which means the landscape is divided into regular cells and each cell receives a mapped value. At roughly a 30-meter land-cover scale, one cell may include a field edge, trees, a narrow road, a small building, or several surfaces at once. The classification assigns a representative category so the dataset can be compared consistently across a large area. That process necessarily simplifies some real-world edges, especially along narrow streams, wooded strips, small settlements, and field boundaries. It is appropriate for countywide comparison, not property lines, zoning, ownership, or buildability decisions.
Download the four Union County JPG maps in one ZIP
The downloadable set contains four JPG files using the same Union County boundary: the general land-cover map, the forest-and-farmland map, the impervious-surface and developed-land map, and the 1985–2025 land-cover change map. The WebP images on this page are convenient for quick viewing, while the original JPG files are better when you want to keep the maps for a document, printed reference, classroom handout, or side-by-side comparison.
Frequently Asked Questions
Does the 44.50% forest share mean that nearly half of Union County is public or protected forest?
No. The 44.50% value is the share classified as forest in the supplied 2025 land-cover map. The NLCD forest class does not identify ownership or management boundaries. Private woodland and public land can be classified the same way. Use the appropriate agency or parcel boundary map when the exact extent of a protected area, public tract, or private property is the question.
Why are agriculture, wetlands, and water so visible along the western side of Union County?
The supplied maps show those classes close together in the Mississippi-side lowlands. Illinois DNR also describes the Union County State Fish & Wildlife Area as part of the Lower Mississippi River bottomlands, with numerous shallow sloughs and water areas. That supports the local bottomland context, but the map alone does not identify the cause, ownership, or flood risk of every wetland or water body. Those questions require more specific hydrologic and management information.
Can the 9.78% class difference from 1985 to 2025 be reported as a confirmed land-use change rate?
Not by itself. The total includes 0.98% mapped to developed, 0.92% forest loss, 1.38% agricultural loss, and 6.18% other class difference. Because the “other” category is the largest component and classification methods can differ between years, the 9.78% figure is best treated as a mapped comparison. Confirm a specific change with additional NLCD years, aerial imagery, and local records before describing it as a verified land-use conversion.
Map File Information
Download four original JPG maps for Union County to compare forest, agriculture, wetlands, developed land, impervious surfaces, and mapped differences from 1985 to 2025.
- Included Files: Land cover map, forest and farmland map, impervious/developed land map, land cover change map
- File Type: Four JPG maps in one ZIP
- Intended Use: Forest-farm comparison, Mississippi bottomland context, developed and impervious patterns, and long-term class review
Related Maps
- Adams County Illinois Land Cover Map
- Alexander County Illinois Land Cover Map
- Bond County Illinois Land Cover Map
Sources and References
- MRLC Annual NLCD Data – Annual land-cover and impervious-surface datasets
- USGS Annual NLCD Land Cover Classification – Land-cover classes and interpretation guidance
- U.S. Census Bureau TIGER/Line Shapefiles – Standard county boundary and geographic reference data
- Illinois DNR Union County State Fish & Wildlife Area – Official local context for the Lower Mississippi River bottomlands, sloughs, and water areas
- Illinois State Archives – Union County – County-seat and municipality information for Union County
Green Map creates custom-edited map images using open geographic data sources such as geoBoundaries, Natural Earth, OpenStreetMap, and government open data. These maps are edited visual materials, not raw data files, and are provided for education, documents, presentations, and graphic reference.