This Bon Homme County Map page brings the county’s main communities, numbered roads, named creeks and lakes, and county-wide elevation into one place. Springfield sits near the southern water edge, Tyndall is farther north near the middle of the county, Avon lies to the west, Tabor to the east, and Scotland to the northeast. Lewis and Clark Lake forms the clearest natural landmark along the south, while the elevation view shows noticeably higher ground on the western side. The maps can be viewed here as WebP images, and the original high-resolution JPG versions are available together as a ZIP download for printing, zooming, or offline reference.
A good way to orient yourself is to keep Springfield, Tyndall, and Lewis and Clark Lake in mind as you move from one map to another. Springfield anchors the southern part of the road and city views, Tyndall provides a central administrative reference, and the lake makes the curving southern boundary easy to recognize even after road labels disappear. The western edge is more irregular than the straight northern and eastern boundaries, which also helps when matching the same area on the terrain and elevation maps. The sections below focus only on features visible in the supplied maps and do not treat these county-scale references as parcel, flood, navigation, or engineering products.
Table of Contents
Roads spread from Springfield and Tyndall toward Avon, Tabor, and Scotland
The general county map places Springfield close to the south-central edge and shows SD 37 and SD 314 in that part of the county. Tyndall appears farther north near the center, accompanied by a Bon Homme County Courthouse label that gives readers a useful administrative reference. From the Tyndall area, the mapped roads extend west toward Avon and east toward Tabor, while SD 25 runs north-south in the eastern half. The result is not a single town corridor but a set of communities spread around the center, with different state roads serving different parts of the county.
Avon sits near SD 50 on the western side. Scotland is much farther northeast near SD 46, and SD 52 runs east-west south of the Tabor area. Those road numbers are especially useful because the towns are separated by wide rural spaces, so a reader can use both a place name and a route number to stay oriented. The map also makes the county outline easy to remember: the north and east are relatively straight, the western edge is uneven, and the south curves around the broad water boundary. That outline becomes an important reference on the water and elevation maps, where the road network is no longer the main feature.
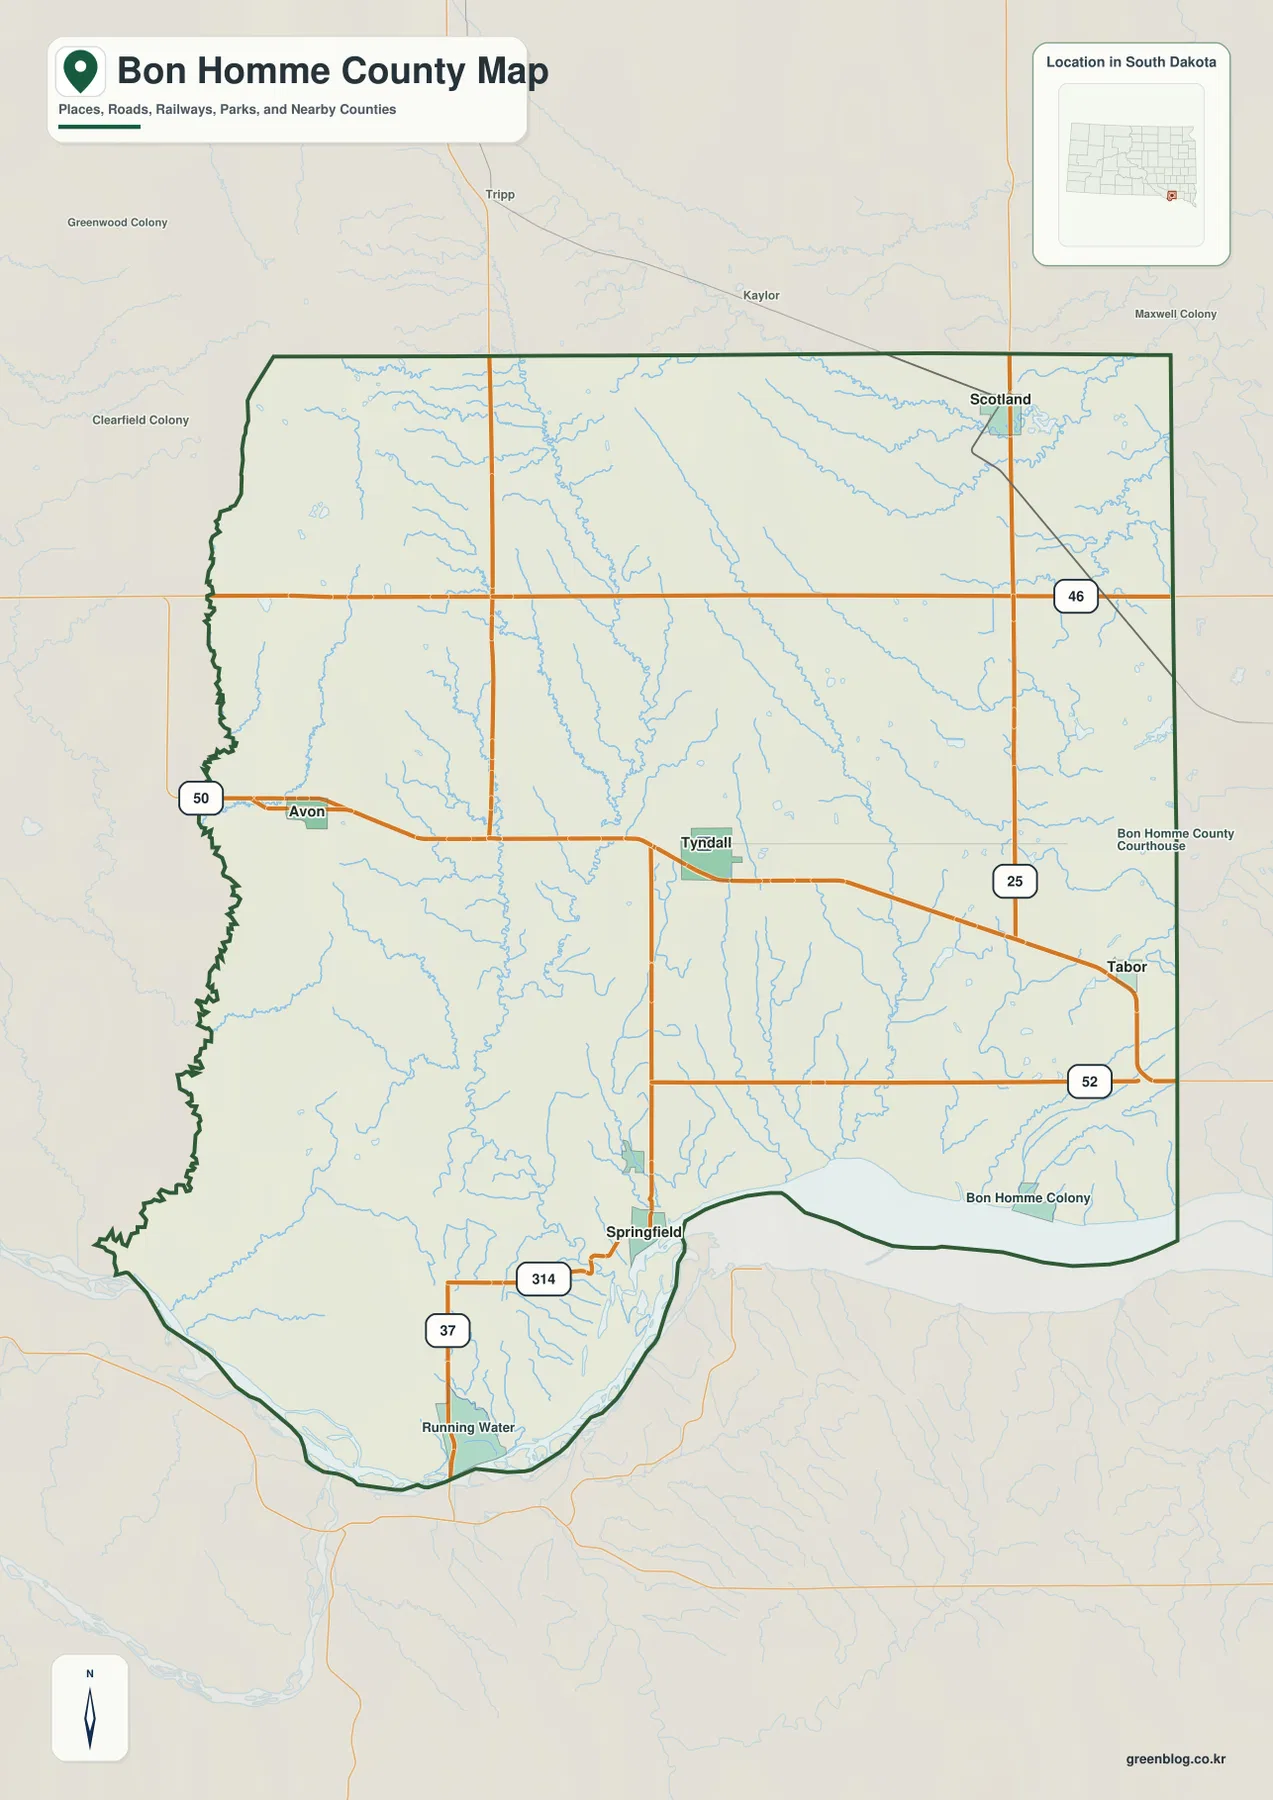
This is an orientation map rather than a turn-by-turn navigation product. It does not attempt to label every local road, address, or minor place, and it should not be used for current closures or driving conditions. Its strength is the county-scale layout: Springfield and Tyndall are easy to find first, then Avon, Tabor, and Scotland can be placed around them. Once that pattern is clear, the other maps make more sense because the reader already knows which side of the county is west, which part contains the southern water, and where the main settlement references sit.
Springfield’s straight-line distances group three towns nearby and place Scotland farther northeast
The city-connections map uses Springfield as a hub and draws direct-distance lines to Tyndall, Avon, Tabor, and Scotland. The printed index also shows Springfield 2,038, Tyndall 1,183, Scotland 851, Avon 704, and Tabor 369. Those figures are values printed on the supplied map, so they are treated here as map-index values rather than a fresh claim about current population. Anyone who needs present-day demographic counts should use an up-to-date Census source instead of relying on the map index.
The distance labels are clear about their purpose. Tyndall is shown 10 miles from Springfield, Avon 13 miles, Tabor 14 miles, and Scotland 22 miles. These are straight-line distances, not road mileage. Tyndall, Avon, and Tabor therefore fall into a fairly tight 10-to-14-mile band from the hub, while Scotland stands out as the more distant community to the northeast. An actual drive can be longer because roads bend, connect at intersections, and do not necessarily follow the shortest line between two places.
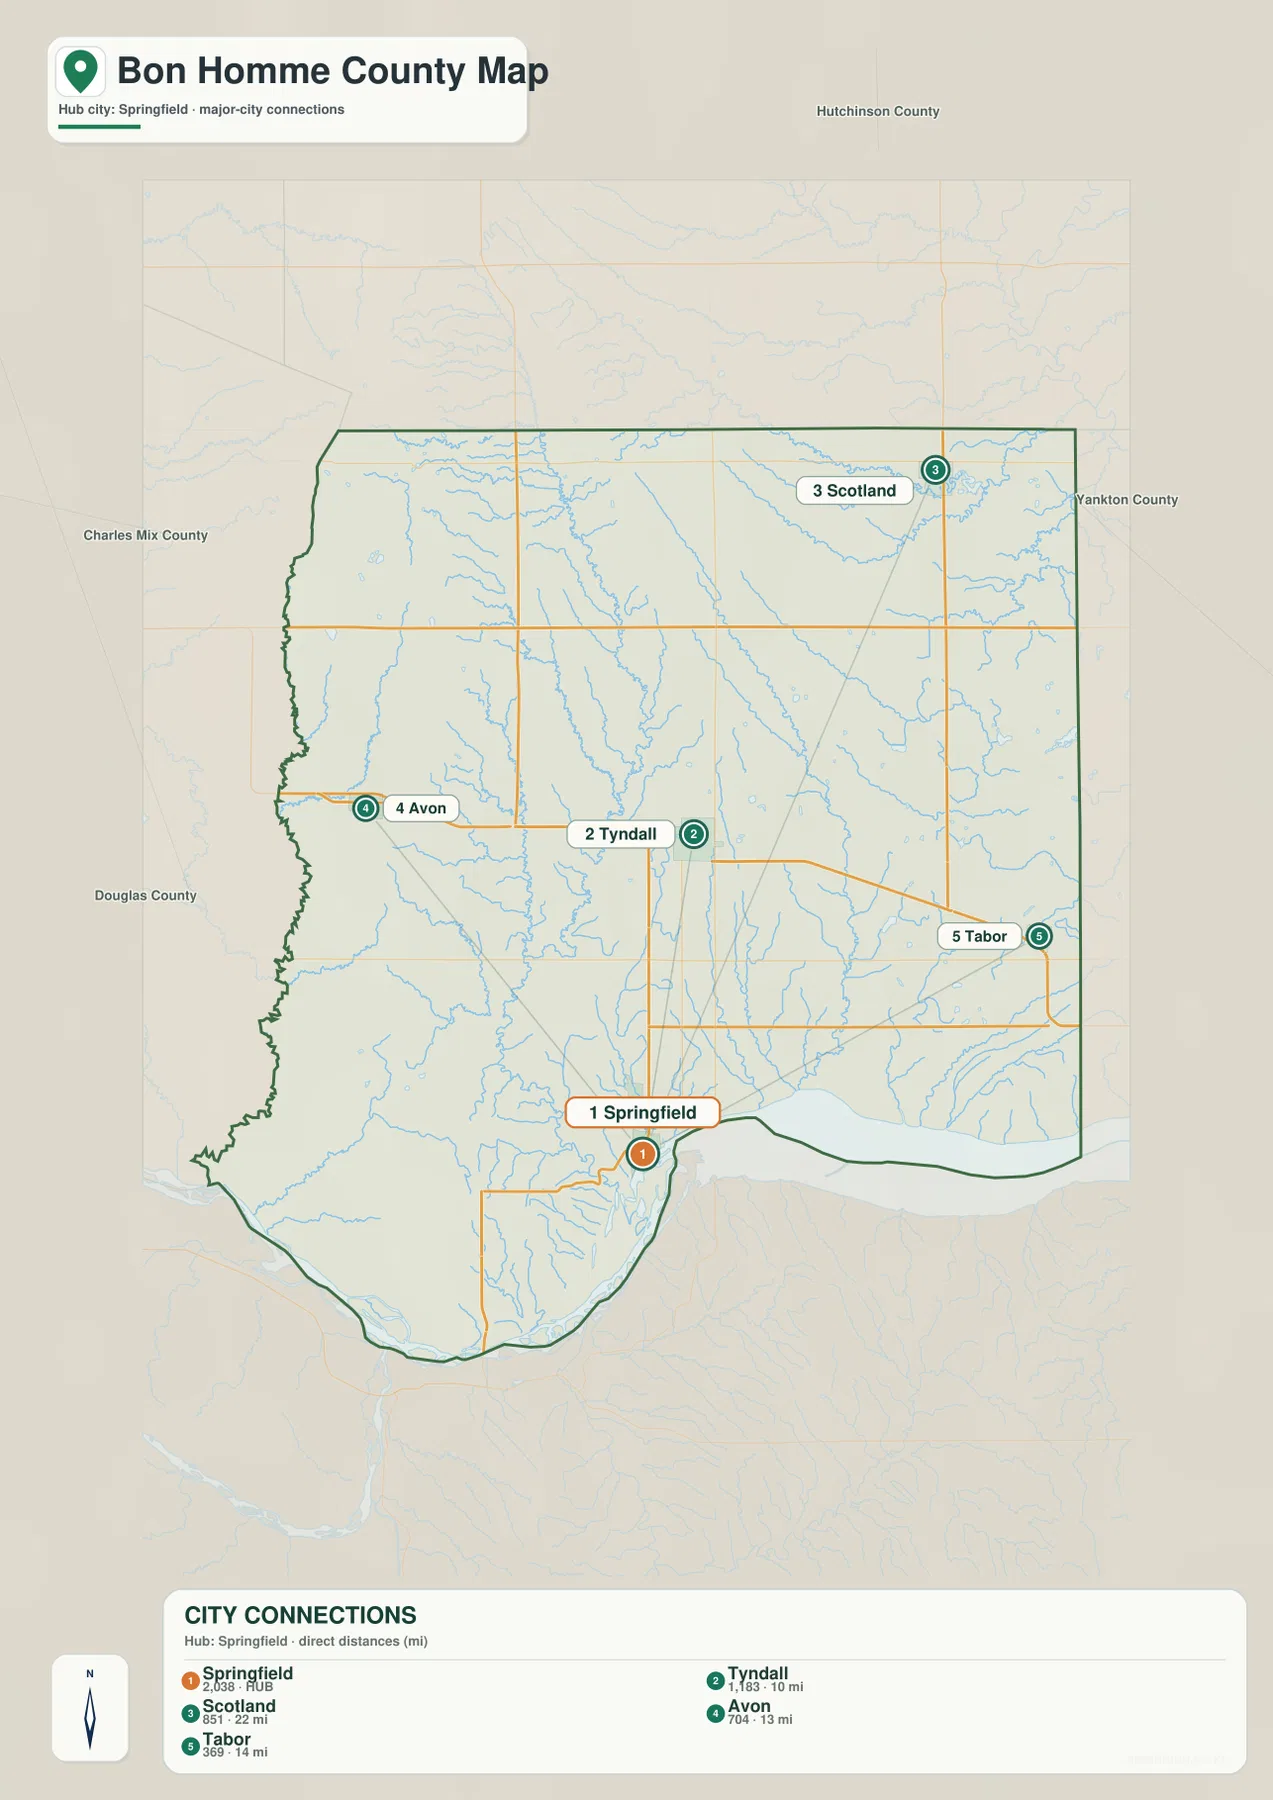
The directions are just as useful as the numbers. Springfield is in the south, Tyndall is north of it near the center, Avon is west, Tabor is east, and Scotland is well to the northeast. That arrangement explains why the city view works best as a spacing diagram rather than a travel map. A straight line from Springfield to Tabor or Avon is not the same thing as the route a driver would take. When the city map is compared with the general road map, the difference between relative distance and actual road routing becomes immediately visible.
Lewis and Clark Lake anchors a network of creeks and smaller lakes
Lewis and Clark Lake dominates the terrain-and-water map along the southern edge of Bon Homme County. The interior lakes are much smaller and scattered: Meiers Lake appears to the west, Lake Henry in the northeast, Clear Lake closer to the center-east, and Kloucek Lake, Kubal Lake, and Hruska Lake farther east and southeast. Because the southern lake is so much larger, it works as the easiest anchor for finding the smaller water features. From that edge, the map can be read northward into a county interior crossed by several named creeks.
Little Emanuel Creek runs through the western-central area, with Emanuel Creek farther east. Snatch Creek forms a long north-south feature in the central-eastern part of the county, while Beaver Creek and Dawson Creek stand out in the northeast. Silver Creek is labeled in the southern interior, and Coffee Creek appears toward the southwest. Smaller tributaries fill the spaces between these named channels. The map therefore shows more than a lake boundary; it gives a much clearer picture of the interior water network than the road map, especially where the drainage lines cut through areas with few settlement labels.
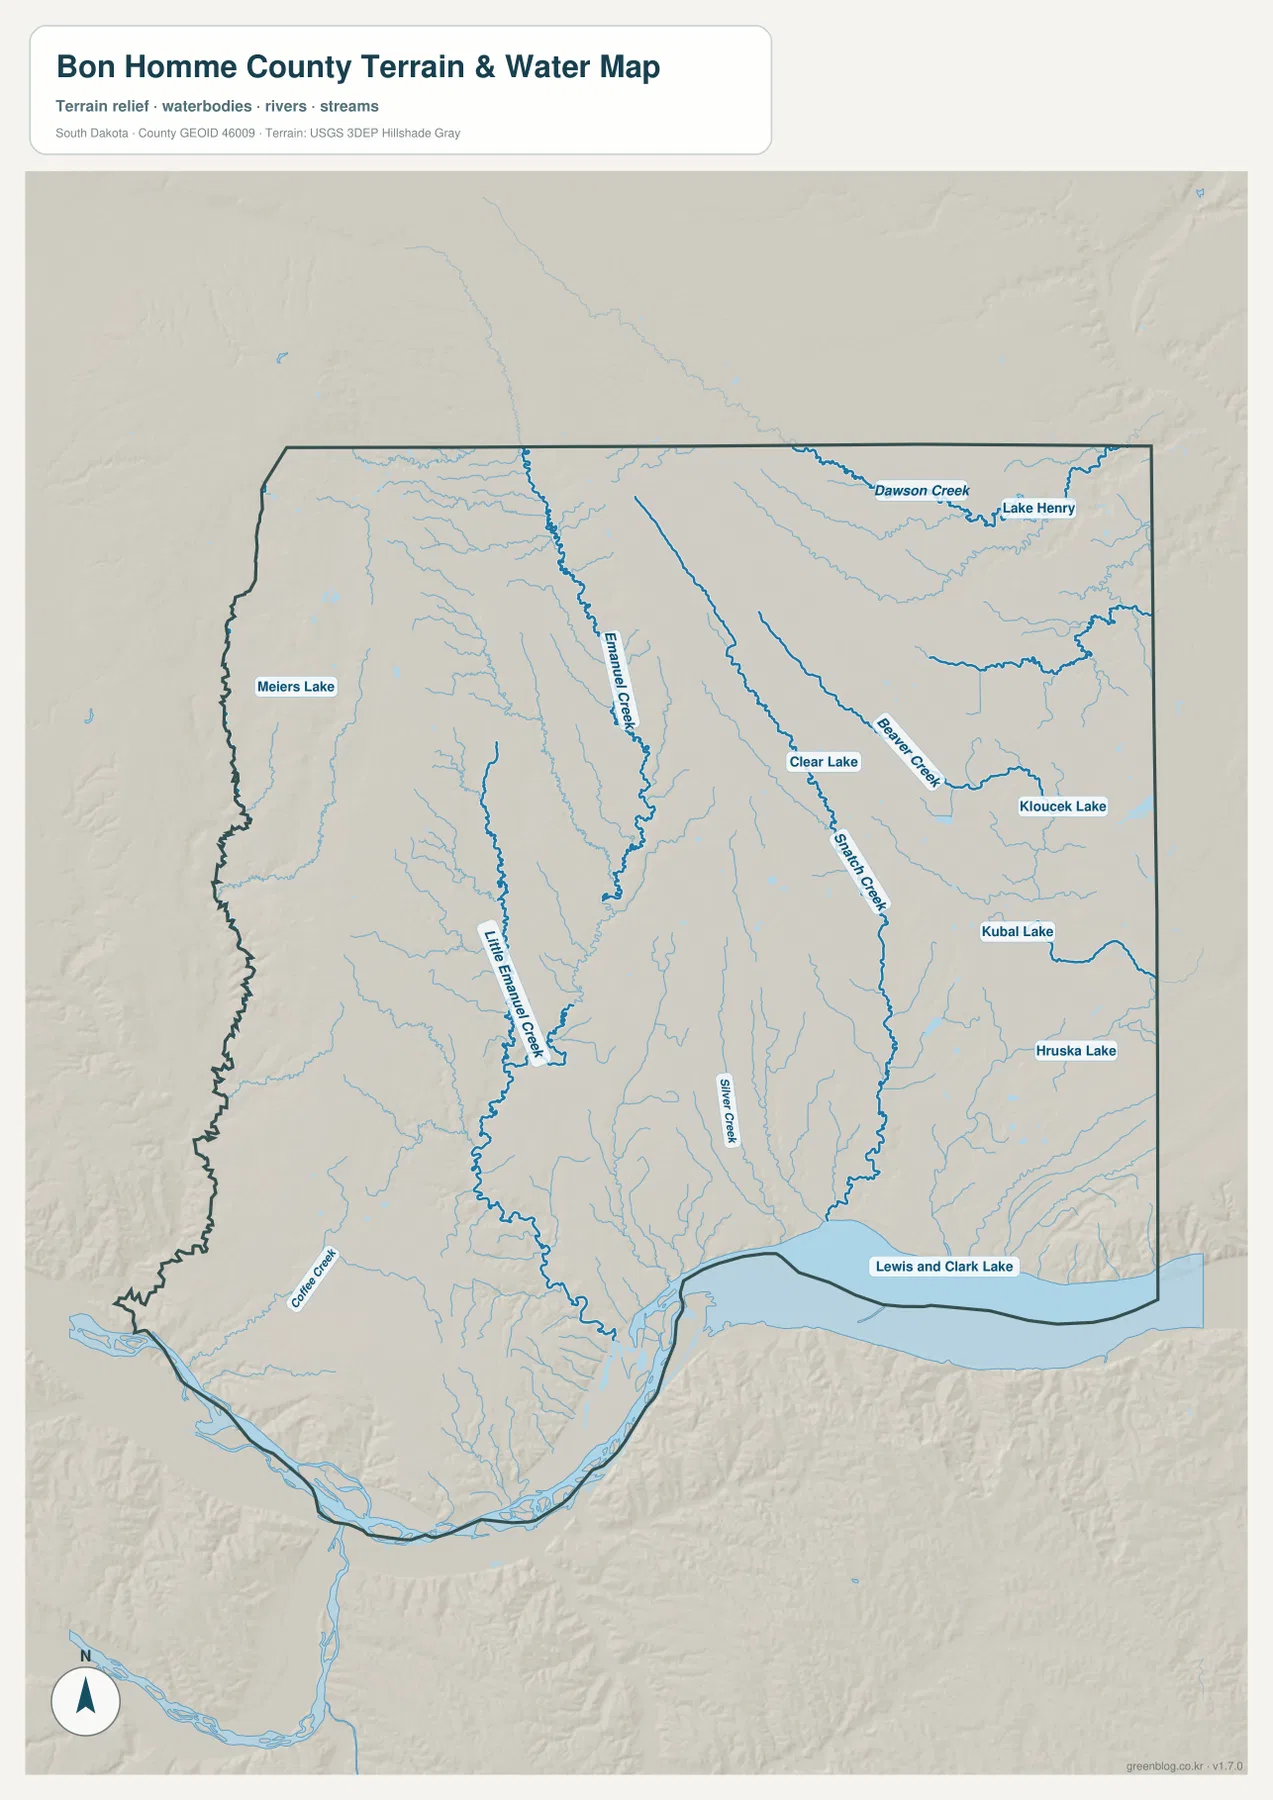
The terrain-and-water view is best used for location and geographic comparison. It does not identify flood zones, water depth, water quality, legal shoreline access, navigability, or current recreation conditions. A named creek on the map should not be interpreted as a statement about public access or boating suitability. For those questions, a current specialized source is necessary. For ordinary county orientation, however, this map makes it easy to see how the smaller creeks and lakes relate to the large southern water body and to the county boundary.
Elevation falls from western high ground toward the lower southern water edge
The elevation map is scaled to an actual Bon Homme County range of 366 to 580 meters, with a mean of about 435 meters. Brown and orange shades cover much of the west and northwest, indicating relatively higher terrain, while greens become more common through the center and east. The southern edge beside Lewis and Clark Lake is among the lowest terrain shown. There is no single spot marker identifying the county’s highest point, so the map is best read as a broad surface showing the contrast between a higher western side and lower central and southern areas.
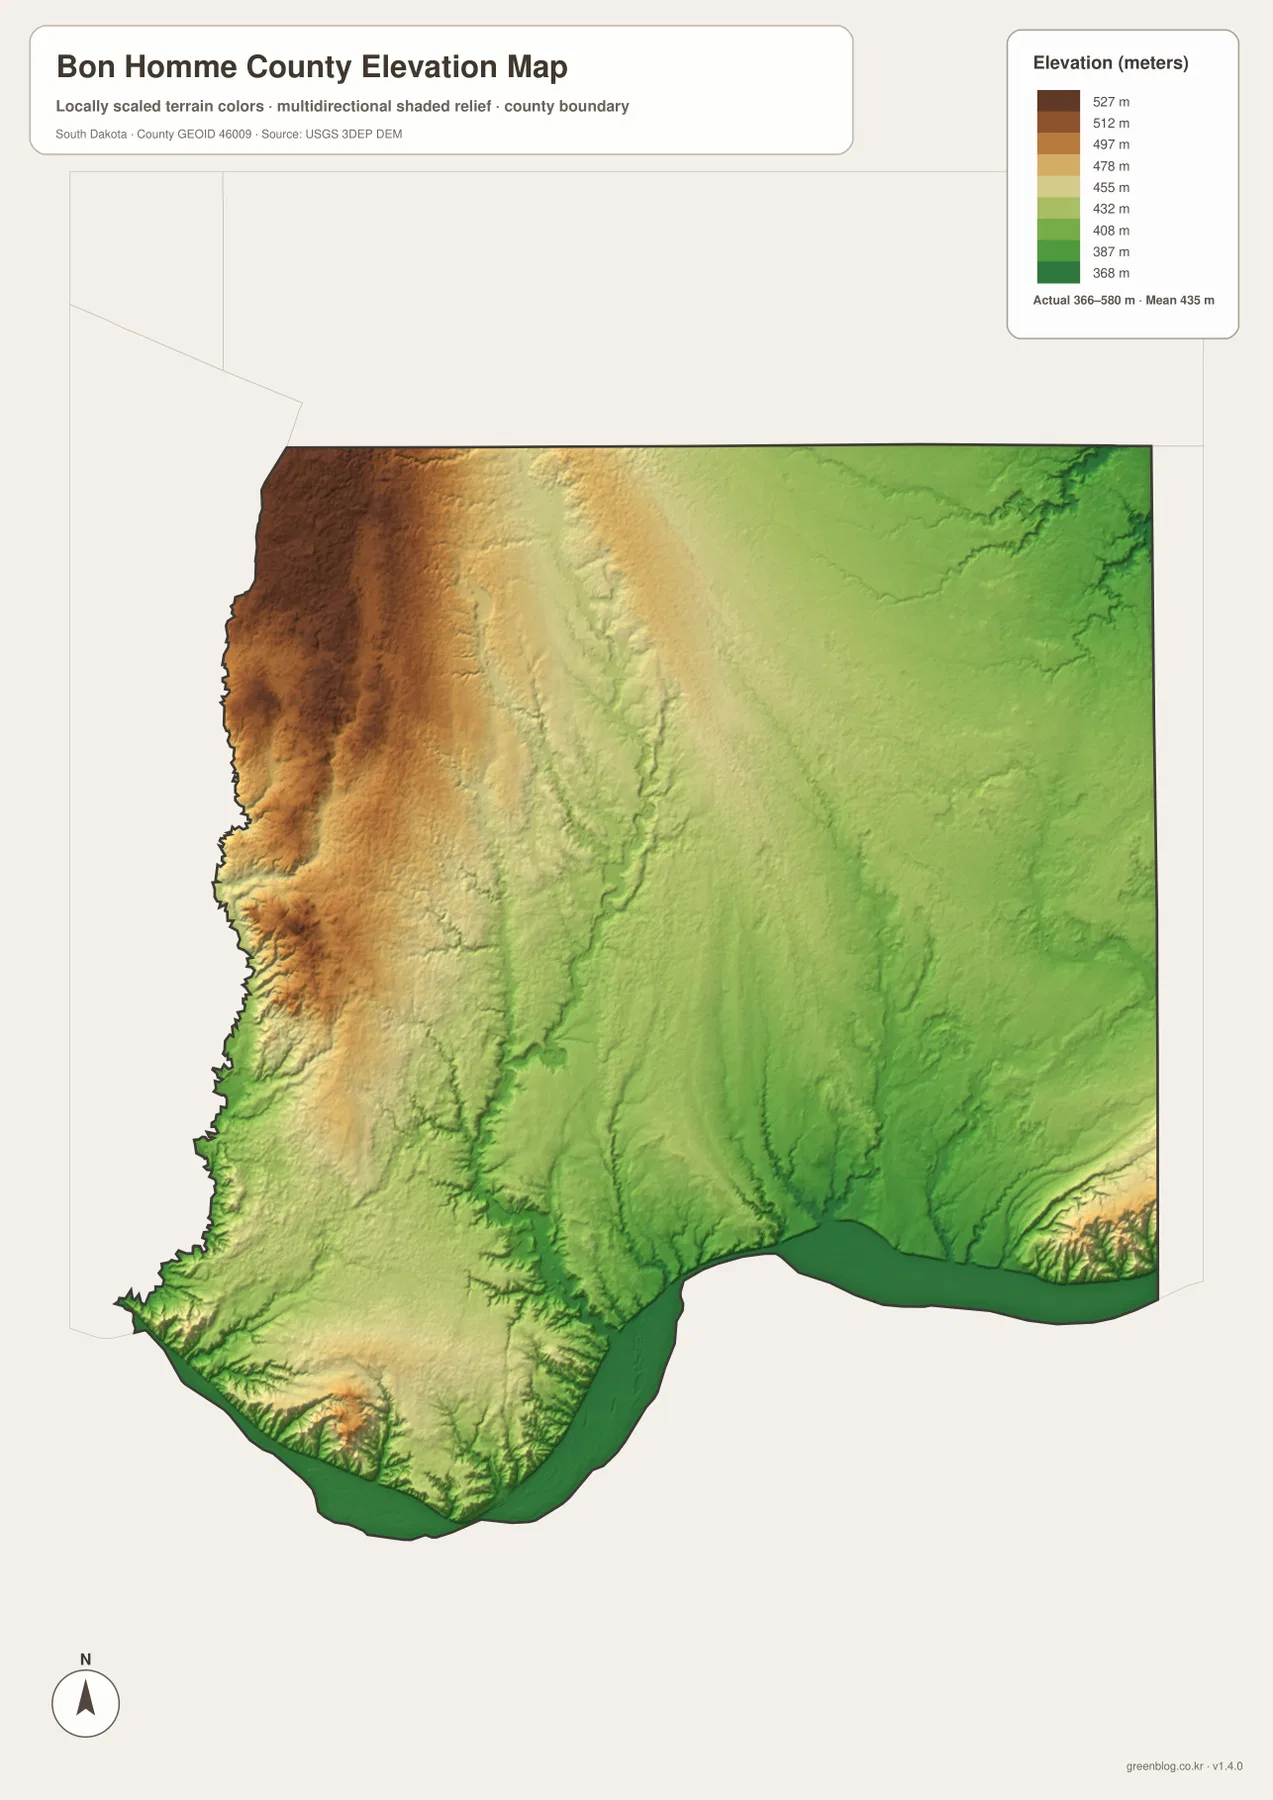
The water map helps explain some of the texture in the shaded relief. Valleys associated with Little Emanuel Creek, Emanuel Creek, Snatch Creek, and other channels cut through the county toward lower southern ground. Much of the east remains lower than the western side, although the southeast includes small patches that rise again. That detail matters because the county is not simply one smooth plane sloping in a single direction. The color scale is useful for county-wide comparison, while the shaded terrain adds enough local form to show where valleys and higher ground interrupt the broad pattern.
These elevation values are not survey-grade measurements. The map should not be used to determine a parcel elevation, design drainage, calculate a construction grade, or replace professional site measurements. Those tasks require the original elevation data or a survey. At county scale, the map is useful for a different reason: it makes the western high ground, lower interior, creek valleys, and low Lewis and Clark Lake edge easy to compare without pretending to provide precision that the map does not contain.
Match the four views by keeping Springfield, Tyndall, and the southern lake in sight
Springfield is the easiest cross-map reference because it is prominent on the general and city maps and lies close to the southern water. The general map ties it to SD 37 and SD 314. The city map turns it into the starting point for the four straight-line measurements. Moving to the terrain-and-water map, the southern shoreline and nearby channels dominate that same part of the county, while the elevation map shows low ground along the water. A reader can therefore move from roads to town spacing to water and relief without losing track of the same southern area.
Tyndall provides a useful central reference. The courthouse label appears beside it on the general map, and the city view places it 10 straight-line miles from Springfield. Around the same central part of the county, the water view emphasizes Emanuel Creek and Little Emanuel Creek rather than town names, while the elevation view shows the transition away from the higher west. In the east and northeast, Tabor and Scotland help locate the area where Snatch Creek, Beaver Creek, Dawson Creek, Lake Henry, and several smaller lakes become more important than settlement labels.
Choose the general county map first when you need town names, the county outline, and major state-road numbers. Use the city-connections map when the main question is how Springfield sits relative to Tyndall, Avon, Tabor, and Scotland. Keep the terrain-and-water map open for Lewis and Clark Lake, the named creeks, and the smaller interior lakes, and add the elevation map when you want to compare those water features with the higher western side and lower southern ground. The WebP images are convenient for browser viewing; the downloadable JPG files provide the larger originals for zooming and printing.
Frequently Asked Questions
Does the 10-mile Springfield-to-Tyndall label mean driving distance?
No. The city-connections map uses direct, or straight-line, distances from Springfield. It shows Tyndall at 10 miles, Avon at 13, Tabor at 14, and Scotland at 22. Actual driving mileage can be longer because roads do not always follow the shortest line between two towns. Use these labels to compare relative spacing, and use current road directions when planning a trip.
Why does the city map use Springfield as its hub when the courthouse label is at Tyndall?
The two maps are showing different kinds of information. The courthouse label on the general map is an administrative reference associated with Tyndall. Springfield is used as the hub on the city-connections map only because that map needs one starting point for its direct-distance measurements. The hub symbol is a comparison choice, not a statement that Springfield is the county seat.
Which maps work best for comparing Lewis and Clark Lake with the western high ground?
Start with the terrain-and-water map to locate Lewis and Clark Lake and the named creeks, then compare the same southern and western areas on the elevation map. The lake edge lies beside low green terrain, while much of the west appears in higher brown and orange shades. Using the two maps together shows the relationship between water location and broad relief without treating either map as a flood or survey product.
Why is Springfield the hub on the city map when the courthouse is shown at Tyndall?
The two labels serve different purposes. The courthouse label on the general map identifies an administrative reference at Tyndall, while the city-connections map simply uses Springfield as the starting point for comparing direct distances to four other communities. The hub symbol does not mean Springfield is the county seat; it is a measurement choice for that particular map.
Are the 10, 13, 14, and 22 mile labels driving distances?
No. The city map identifies them as direct, or straight-line, distances from Springfield: 10 miles to Tyndall, 13 to Avon, 14 to Tabor, and 22 to Scotland. Actual road mileage can be longer because roads curve and do not always follow the shortest line. Use current road directions for travel planning.
Which maps should I compare to understand Lewis and Clark Lake and the western high ground?
Use the terrain-and-water map for the lake and named creeks, then compare the same southern and western areas on the elevation map. Lewis and Clark Lake lies along low green terrain, while much of the west appears in higher brown and orange colors. Looking at those two maps together is the clearest way to connect the county’s water features with its broad elevation change.
Does the 10-mile Springfield-to-Tyndall label mean road distance?
No. The city-connections map states that its distances are direct, or straight-line, distances from Springfield. Tyndall is shown at 10 miles, Avon at 13, Tabor at 14, and Scotland at 22. Actual driving mileage can be longer because a road does not necessarily follow the straight line between two communities. Use current road directions for travel planning.
Which map shows Lewis and Clark Lake and the county creeks most clearly?
The terrain-and-water map is the clearest choice. It shows the long Lewis and Clark Lake edge together with Little Emanuel Creek, Emanuel Creek, Snatch Creek, Beaver Creek, Dawson Creek, Silver Creek, and several named interior lakes. The general map is useful as a companion when you also need Springfield, Tyndall, and road numbers. Neither map should be used as a flood map or a statement of shoreline access.
What does the 366–580 meter elevation range tell me?
It gives the county-wide range represented on the supplied elevation map. Western and northwestern areas are generally higher, much of the center and east is lower, and the Lewis and Clark Lake edge is among the lowest terrain shown. The mean is about 435 meters. These values help compare broad relief, but the map is generalized and is not suitable for parcel surveying or engineering design.
Map File Information
The ZIP includes the original high-resolution JPG versions of the Bon Homme County general map, city-connections map, terrain-and-water map, and elevation map.
- Included Files: Use only the versions confirmed in the article and supplied images
- File Type: Use the confirmed download contents
- Intended Use: Printing, education, presentations, and map-based projects
Related Maps
Sources and references
- South Dakota Unified Judicial System – Bon Homme County
- U.S. Census Bureau QuickFacts – Bon Homme County
- U.S. Census Bureau TIGER/Line Shapefiles
- USGS National Hydrography
- USGS 3D Elevation Program
Green Map creates custom-edited map images using open geographic data sources such as geoBoundaries, Natural Earth, OpenStreetMap, and government open data.
These maps are edited visual materials, not raw data files, and are provided for education, documents, presentations, and graphic reference.