Carroll County is overwhelmingly agricultural in the supplied 2025 classification, but the county is not a uniform sheet of cropland. Agriculture accounts for 78.47%, while forest covers 9.43% and developed land 9.37%. The broad farm grid is interrupted by wooded drainage lines, the Wabash River system, wetland pockets, and several built-up centers. Delphi forms the strongest developed concentration in the western half of the county, while another clear cluster appears around Flora farther east.
This page pairs those current-cover patterns with a forest-and-farmland view, an impervious-surface layer, and a 1985–2025 endpoint comparison. The WebP images are intended for quick reading on the page. A single ZIP at the end contains the four original 2480 × 1754-pixel JPG maps. They are useful for county profiles, classroom work, environmental context, and presentation graphics, but they should not be treated as parcel, zoning, survey, flood, or wetland-jurisdiction maps.
Table of Contents
The 2025 pattern is a farm grid crossed by wooded watercourses
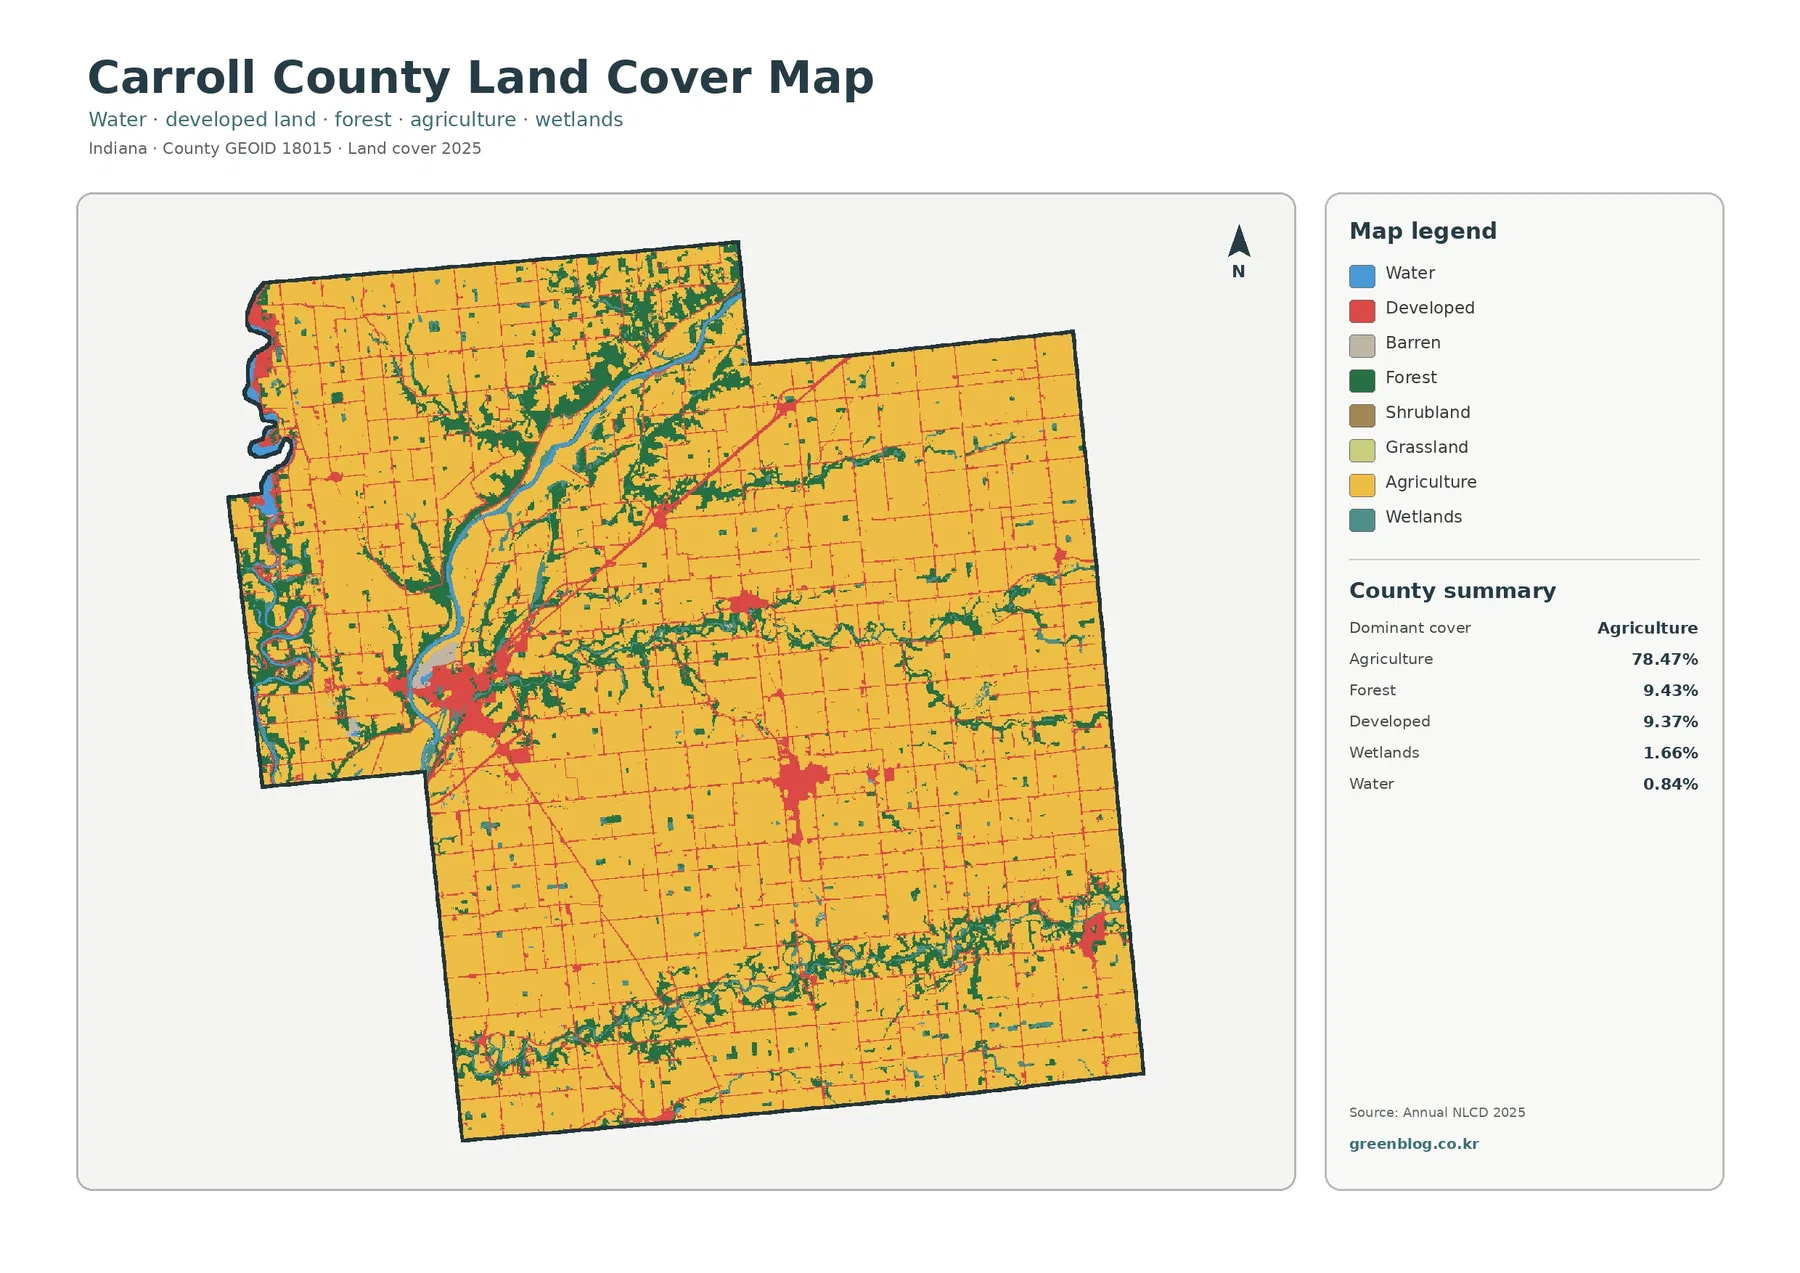
Yellow agricultural cells dominate the north, east, and south and form large rectangular blocks that reflect the county’s rural road-and-field pattern. The western and north-central parts look more varied because green forest, teal wetlands, and blue water occupy wider bands near the main river system. Thin red developed lines crisscross much of the agricultural interior, but the strongest red areas gather into separate settlement footprints rather than one continuous urban zone.
The county summary lists wetlands at 1.66% and open water at 0.84%. Those categories should remain separate. Open water represents exposed water surfaces, while wetland classes can include saturated soils and water-influenced vegetation. A place can therefore contain a noticeable wetland network even when the mapped open-water share is below one percent. The distinction matters in Carroll County because many of the teal cells appear beside narrow drainage features and wooded strips rather than as large blue lakes.
Land cover describes what the surface was classified as from imagery. It does not establish who owns the land, where a farm parcel begins, which crop was planted, or whether a property can be developed. A developed cell can include lawns, trees, soil, and other permeable material in addition to buildings and pavement. An agricultural cell can also contain small ditches, tree rows, farm lanes, and other features that are too small to become separate 30-meter classes.
Delphi and Flora stand out more clearly in the impervious layer
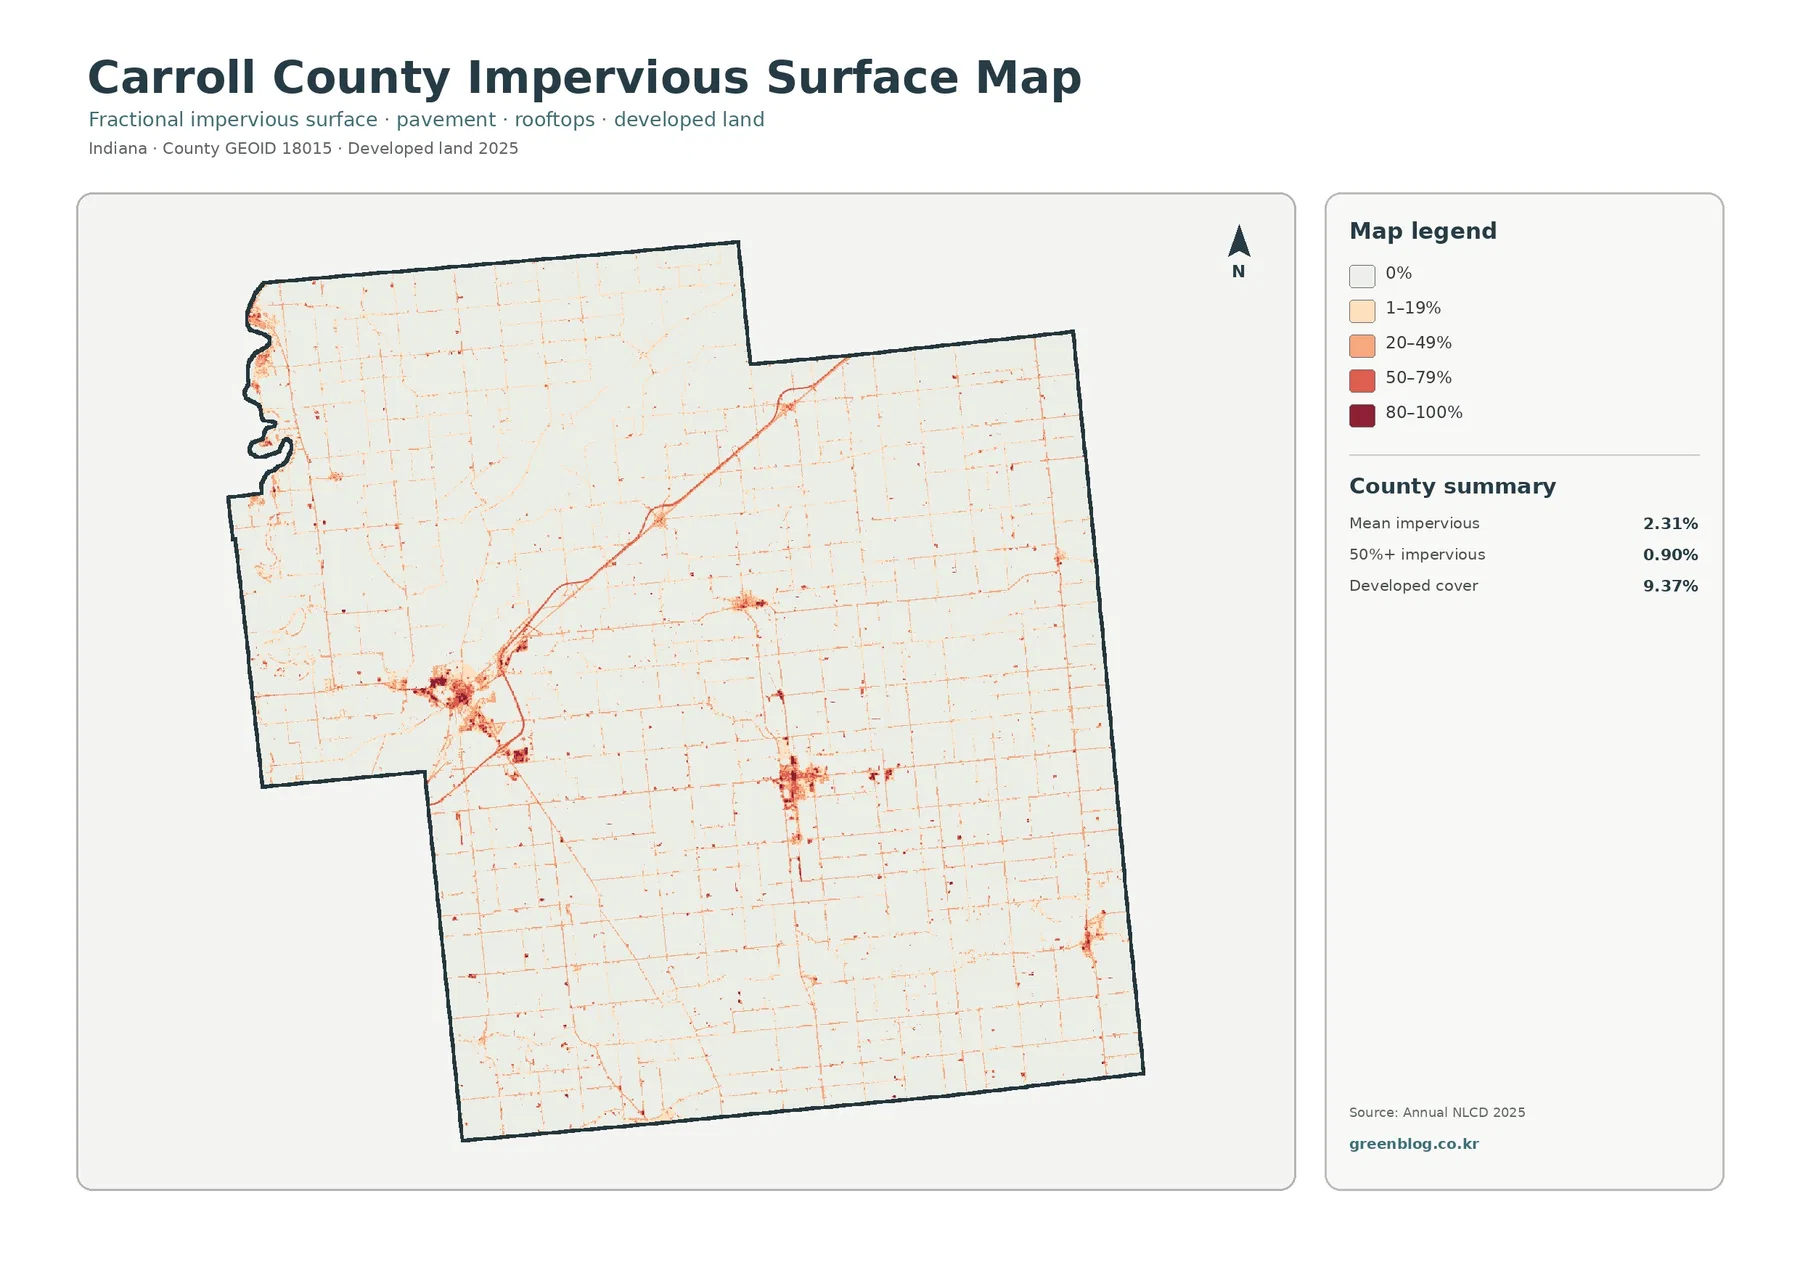
The countywide mean impervious share is 2.31%, and 0.90% of the county is mapped at 50% impervious or greater. Both values are much lower than the 9.37% developed-cover share because the two layers measure different things. Developed land is a land-cover class that may include grass, trees, and open soil around buildings and streets. The impervious layer isolates the fraction of each cell occupied by hard surfaces such as roofs and pavement.
The darkest tones form the largest cluster around Delphi. A second pronounced concentration appears around Flora, with smaller nodes elsewhere and fine lines extending along the road network. The image does not label highways or municipal boundaries, so those lines should not be assigned route numbers from appearance alone. The same caution applies to small dark patches: they may correspond to communities, facilities, road intersections, or other built surfaces, but a named identification requires a road or municipal map.
Impervious cover is useful when a presentation needs to distinguish a town center from surrounding farm country or when a watershed discussion needs a first look at where hard surfaces are concentrated. It is not a flood-risk map. Runoff depends on rainfall, soil, slope, drainage infrastructure, stream conditions, wetlands, and other factors. The county mean also hides the contrast between settlement cores and large rural areas where impervious percentages are close to zero.
Forest and wetland strips follow the river system through farm country
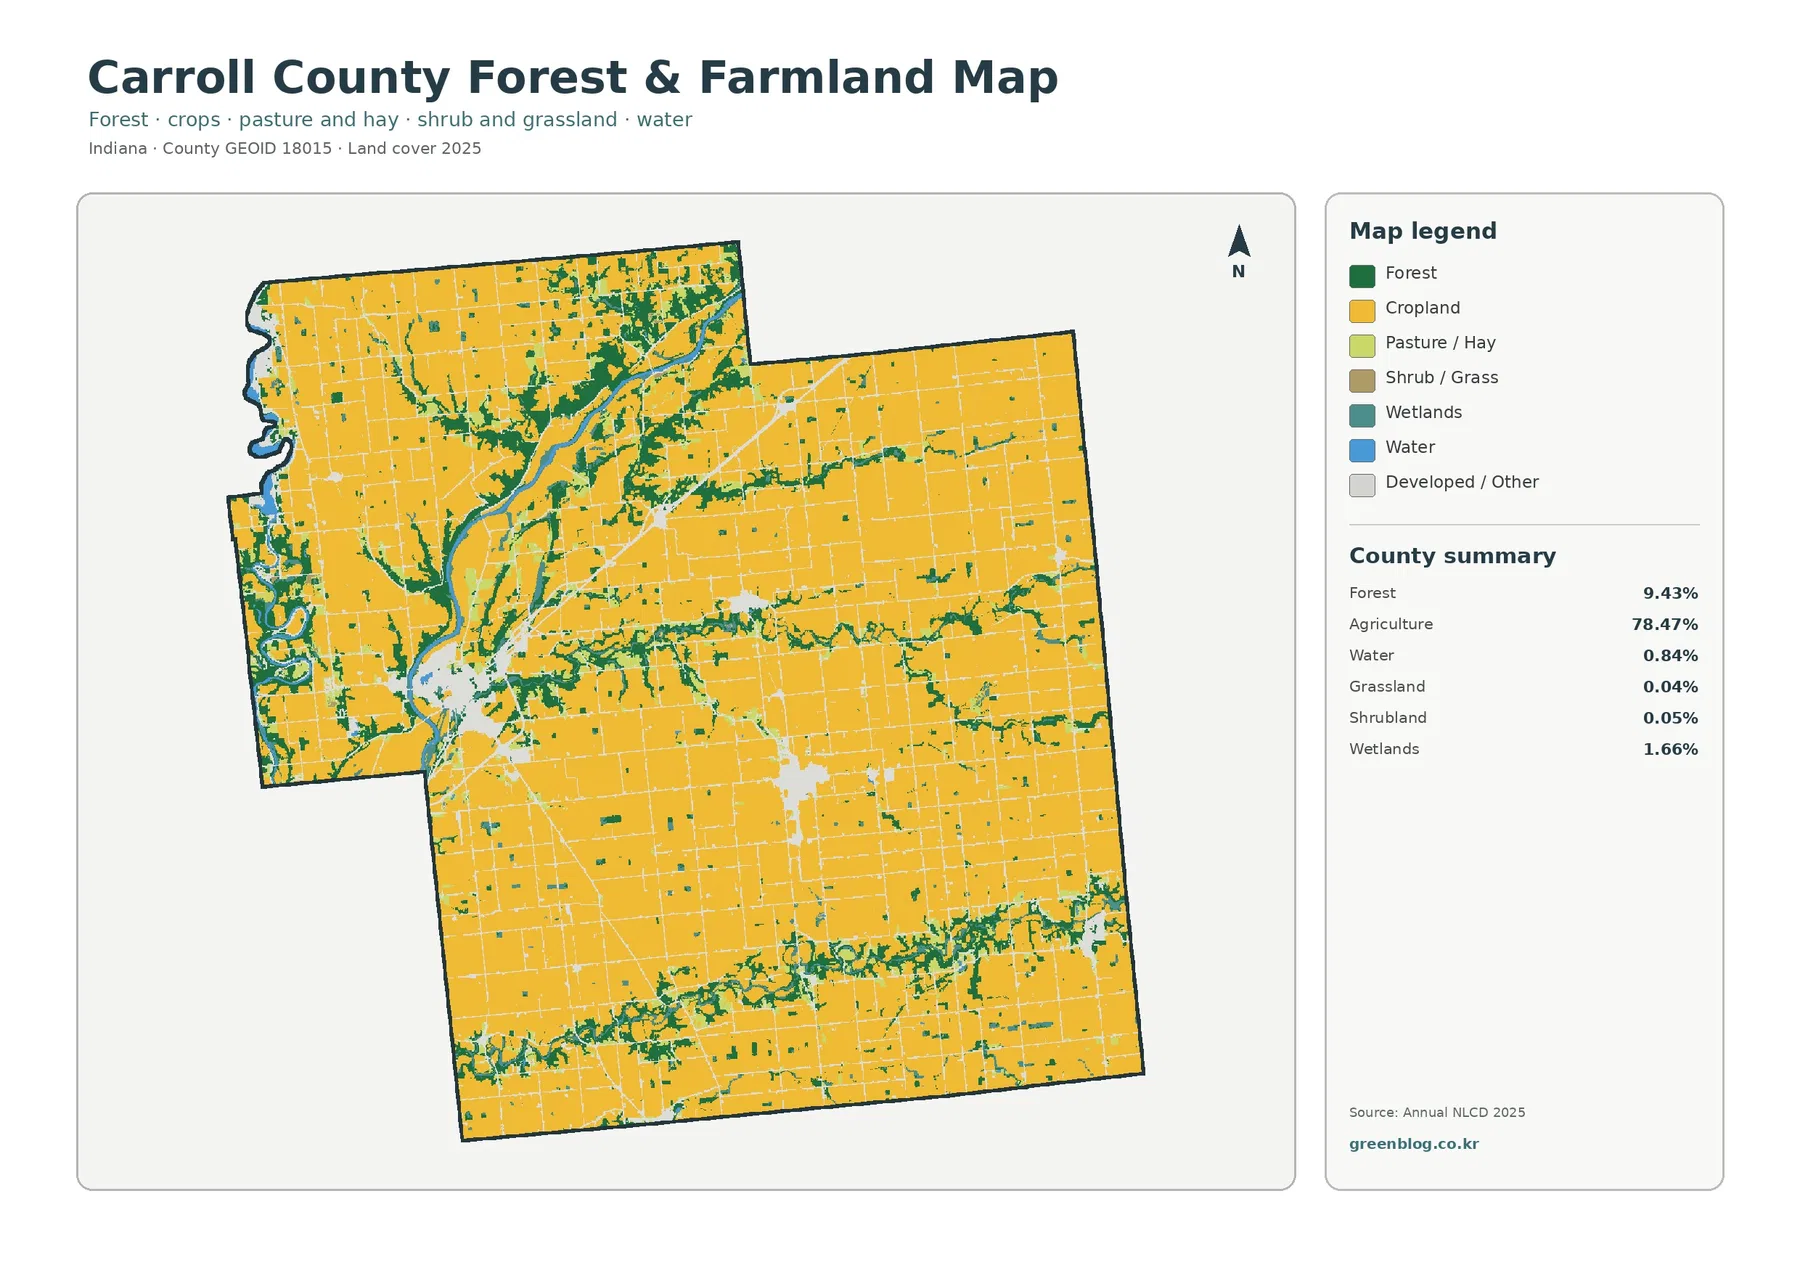
Removing the stronger developed colors makes the natural-cover network easier to follow. Cropland still occupies most of the map, but forest is concentrated along the Wabash River system and branching drainages rather than distributed evenly. The most substantial green areas lie in the western and north-central portions, while narrower wooded strips continue through the interior and along the southern part of the county.
Carroll County’s community information identifies Delphi as the county seat and notes that both the Wabash River and Deer Creek traverse the city. That local description helps explain why the western developed cluster sits beside a complex mix of water, woods, and wet ground. The land-cover preview itself does not label individual channels, so exact stream names should be confirmed against current hydrography before a particular green or blue feature is named in a report.
Grassland accounts for only 0.04% and shrubland for 0.05% in the supplied summary. Those small values are a useful reminder not to overstate minor colors simply because they are visible at map scale. Carroll County is better characterized by a three-part contrast: very broad agricultural cover, wooded and wet corridors associated with drainage, and compact developed centers. That structure is much more informative than a long legend-by-legend inventory.
For agricultural education, this focused view can show how large field blocks meet wooded riparian areas and wetlands. For habitat or watershed context, it can help locate broad places where natural cover remains connected through an agricultural landscape. Neither use turns the map into a regulatory product. Official wetland determinations, conservation plans, or farm management decisions require current higher-resolution information and the appropriate agency or landowner records.
Only 6.01% of cells differ between the 1985 and 2025 endpoints
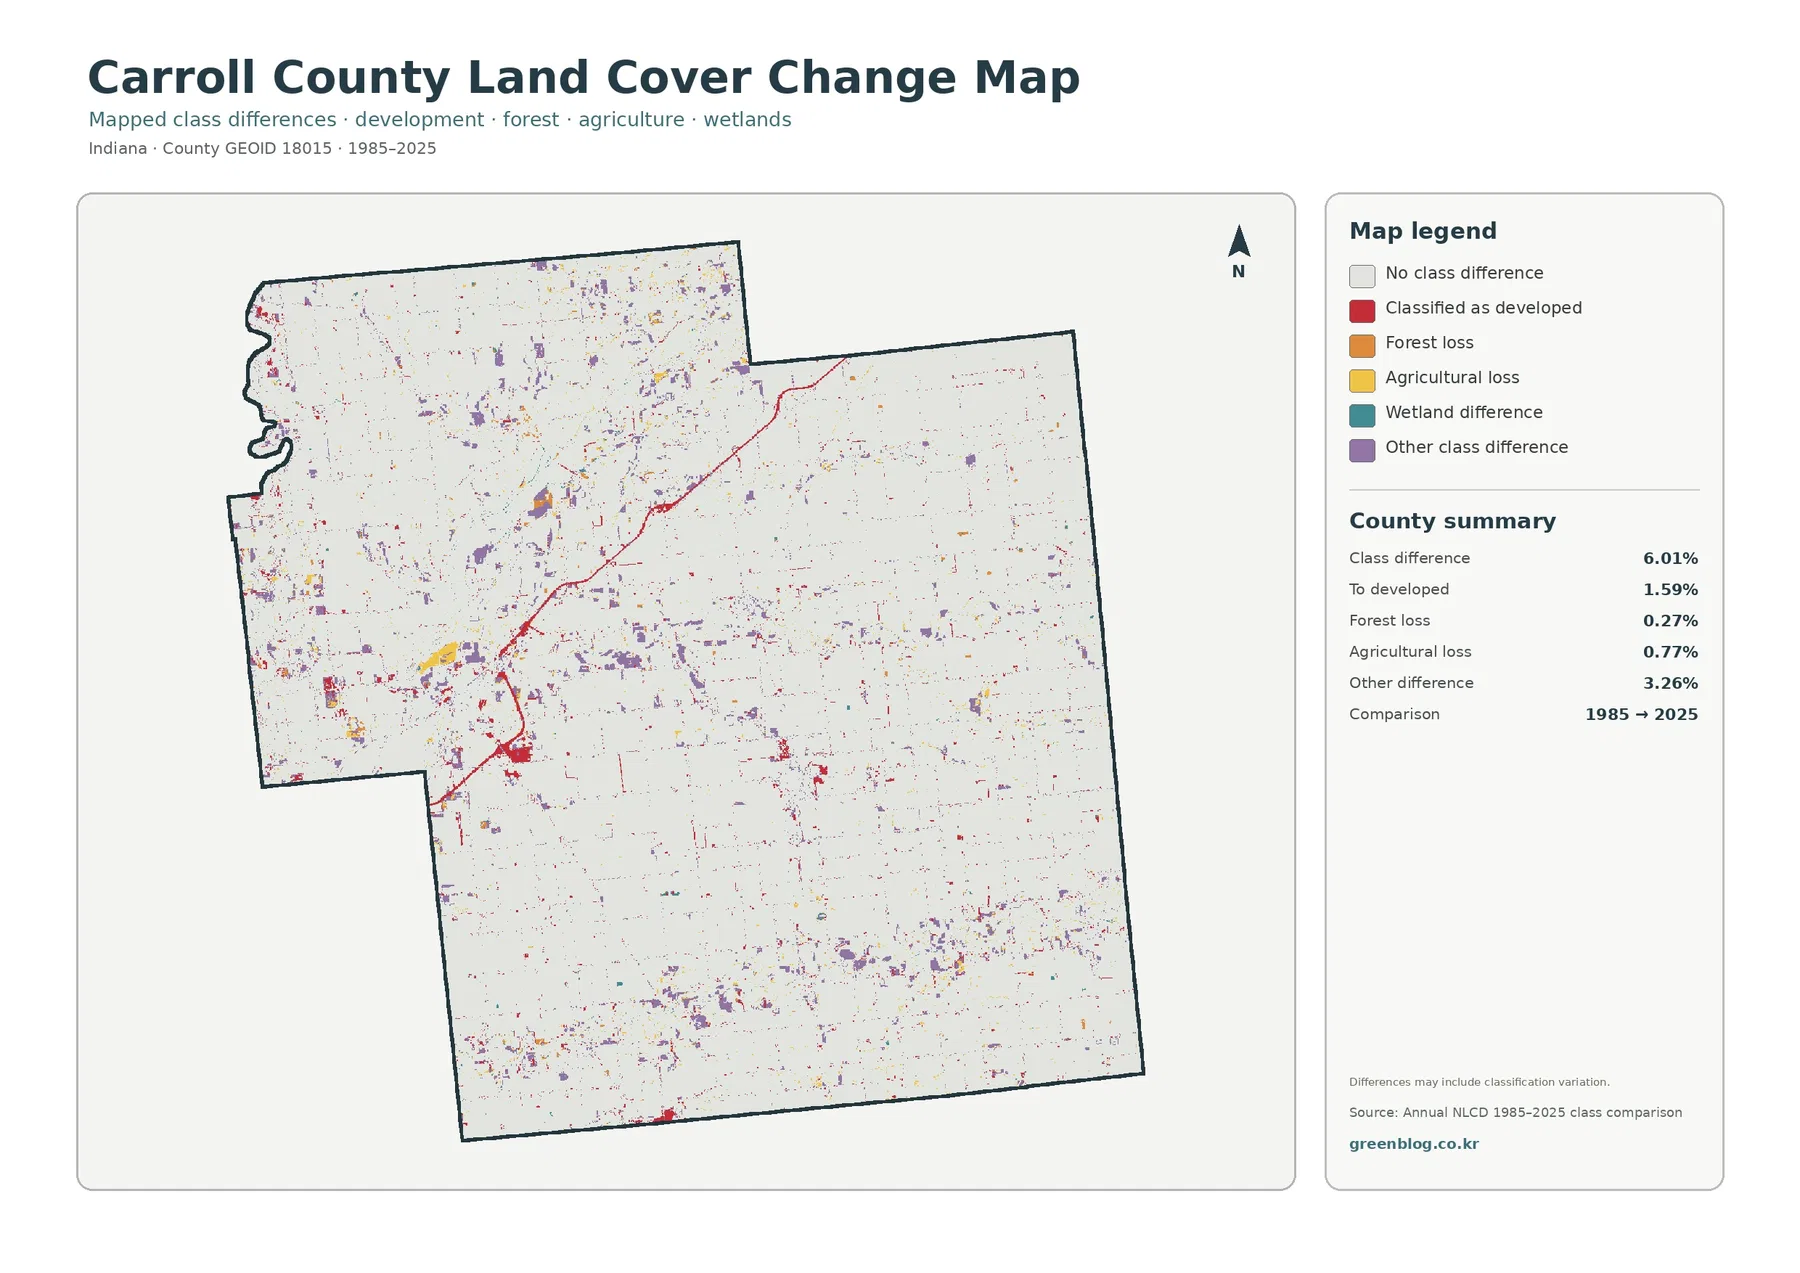
The comparison reports 6.01% total class difference. The listed components include 1.59% classified as developed at the 2025 endpoint, 0.27% forest loss, 0.77% agricultural loss, and 3.26% other difference. Wetland difference appears in the legend but has no separate percentage in the summary, so it should not be calculated by subtraction and presented as an official value.
Red change cells are most noticeable near Delphi and other developed nodes and along some connecting traces. Purple “other difference” cells are more widely scattered, especially through parts of the west and south, while forest-loss and agricultural-loss colors appear as smaller fragments. The map is therefore useful for locating candidate areas for closer review, not for assigning a cause. A changed class can reflect construction, vegetation change, agricultural transitions, flooding, harvest, seasonal conditions, or classification variation.
“Forest loss” and “agricultural loss” are endpoint labels. They mean a cell classified as forest or agriculture in 1985 received another class in 2025. They do not state when the transition occurred or whether it was permanent. A cell could also have changed during the intervening decades and returned to its original endpoint class without being highlighted here. A proper change history needs intermediate annual products, aerial imagery, and local records.
Why the 30-meter classification should stay at county scale
Annual NLCD generalizes the landscape into roughly 30-meter cells. Each cell receives a predominant land-cover class even when several surfaces share the same square. In a rural area that may mean crops, a ditch, a tree line, a farm road, and part of a building are simplified into one label. The method is valuable because the same framework can be applied consistently across a whole county, but it cannot reproduce survey lines or parcel detail.
Zooming farther into the image does not restore information that was never present in the source grid. Parcel-level questions need cadastral GIS, current aerial photography, field inspection, or agency records. The same principle applies to wetlands and development: teal cells are not automatic jurisdictional-wetland boundaries, and red developed cells are not zoning or building-permit boundaries. Readers should use the map to frame a question, then move to the source appropriate for a site-specific decision.
A practical way to combine the four views
For a general Carroll County profile, begin with the 2025 land-cover overview because it places agriculture, woods, water, wetlands, and settlement footprints on one page. Follow it with the forest-and-farmland view when the topic is farming, habitat, or the river system. The impervious layer works best when the discussion shifts to Delphi, Flora, roads, and other hard-surface concentrations. Place the endpoint-change map last so its red and purple colors are not mistaken for present-day land-cover classes.
The maps also work well in side-by-side teaching. Students can identify a developed cluster in the current-cover image, check whether the same location contains high impervious values, then see whether the 1985–2025 comparison marks class differences there. Along the Wabash River system, the same sequence can compare current forest and wetlands with endpoint changes without implying that every difference has a single cause. This approach turns the four graphics into connected evidence rather than four repeated versions of the same description.
Purdue Extension Carroll County provides local agriculture and natural-resource information that can add real-world context to the map. Extension resources address crops, agricultural management, and natural-resource questions, while Annual NLCD supplies a standardized surface classification. Those sources complement each other, but the 78.47% agricultural-cover statistic should not be treated as a substitute for crop acreage, harvested acres, farm counts, or production data.
Observation date, image size, and appropriate limits
The current-cover maps represent the supplied 2025 observation year. Construction, demolition, crop rotation, timber work, vegetation recovery, or water conditions after that date may not appear. For a current planning or property question, later aerial imagery and local government records should take priority. The 1985–2025 comparison is also an endpoint product rather than a continuous narrative of every year in between.
Each downloadable JPG measures 2480 × 1754 pixels. That resolution is useful for screens, reports, lessons, and many presentation layouts, but the asset manifest does not mark the files as meeting an A3 high-resolution reference. Test a large print before relying on small labels or legend text at poster size. The files are reference graphics, not engineering drawings, surveys, parcel maps, official flood maps, or legal wetland determinations.
Frequently Asked Questions
Is Carroll County almost entirely farmland?
Agriculture is the dominant class at 78.47%, but the county contains important contrasts. Forest and wetlands are concentrated along the Wabash River system and branching drainages, while Delphi, Flora, and smaller settlements create separate developed clusters. The countywide percentage is most useful when it is read together with those locations.
Why is developed cover 9.37% when mean impervious cover is only 2.31%?
Developed land-cover classes can include lawns, trees, bare soil, and other permeable surfaces around buildings and roads. Impervious cover focuses on hard surfaces such as roofs, pavement, and parking areas. Because the definitions are different, the countywide impervious mean is expected to be lower than the developed-cover share.
Does the 6.01% class difference mean 6.01% of the county was damaged after 1985?
No. It is the share of cells whose endpoint class differs between 1985 and 2025. The value can include real surface change and classification variation, and it does not identify the date or cause of a change. Intermediate imagery and local records are needed for a site-specific history.
Sources and Reference Data
- MRLC Annual NLCD Data – official access point for annual land-cover and comparison products
- USGS Annual NLCD Land Cover Classification – definitions and guidance for agriculture, forest, developed land, wetlands, water, and related classes
- U.S. Census Bureau TIGER/Line Shapefiles – official county-boundary reference for Carroll County
- Purdue Extension – Carroll County Agriculture & Natural Resources – local agriculture and natural-resource programs and county information
- Carroll County Communities – local descriptions of Delphi, Flora, and the Wabash River and Deer Creek setting around Delphi
Map File Information
The ZIP contains four original JPG maps for comparing Carroll County agriculture, wooded river corridors, Delphi and Flora hard surfaces, and 1985–2025 endpoint class differences.
- Included Files: General land cover, forest and farmland, impervious/developed surface, and land-cover change maps
- File Type: Four original JPG map files bundled in one ZIP archive
- Intended Use: Printing, education, presentations, and map-based projects
Related Maps
- Adams County Indiana Land Cover Map
- Allen County Indiana Land Cover Map
- Bartholomew County Indiana Land Cover Map
Green Map creates custom-edited map images using open geographic data sources such as geoBoundaries, Natural Earth, OpenStreetMap, and government open data. These maps are edited visual materials, not raw data files, and are provided for education, documents, presentations, and graphic reference.