The Jefferson County Indiana Land Cover Map set shows a county that is much more evenly divided between wooded land and agriculture than many farm-dominated parts of Indiana. In the 2025 summary, forest covers 46.57% and agriculture 39.24%, while the developed share is concentrated around Madison and smaller settled areas. The maps also make the large natural-cover areas north and east of Madison stand out against the more agricultural western side of the county.
Four views are included on this page: 2025 land cover, a simplified forest-and-farmland map, an impervious-surface view, and a 1985–2025 class-difference map. After reviewing the WebP maps on the page, you can download the four original JPG maps together in one ZIP for printing, teaching, presentations, or closer comparison of Madison, Hanover, the Big Oaks area, and the Ohio River side of the county.
Table of Contents
Madison is the clearest built-up center inside a mostly green and yellow county
The 2025 land-cover summary reports 46.57% forest, 39.24% agriculture, 10.26% developed land, 2.53% wetlands, 0.68% grassland, 0.33% water, and 0.27% shrubland. Those numbers describe the county as a whole, but the map makes clear that the classes are not evenly mixed. A large red developed cluster sits near the Ohio River side of the county around Madison, while a smaller cluster west of it corresponds with the Hanover area. Much of the land between and beyond those settlements is forest or agriculture.
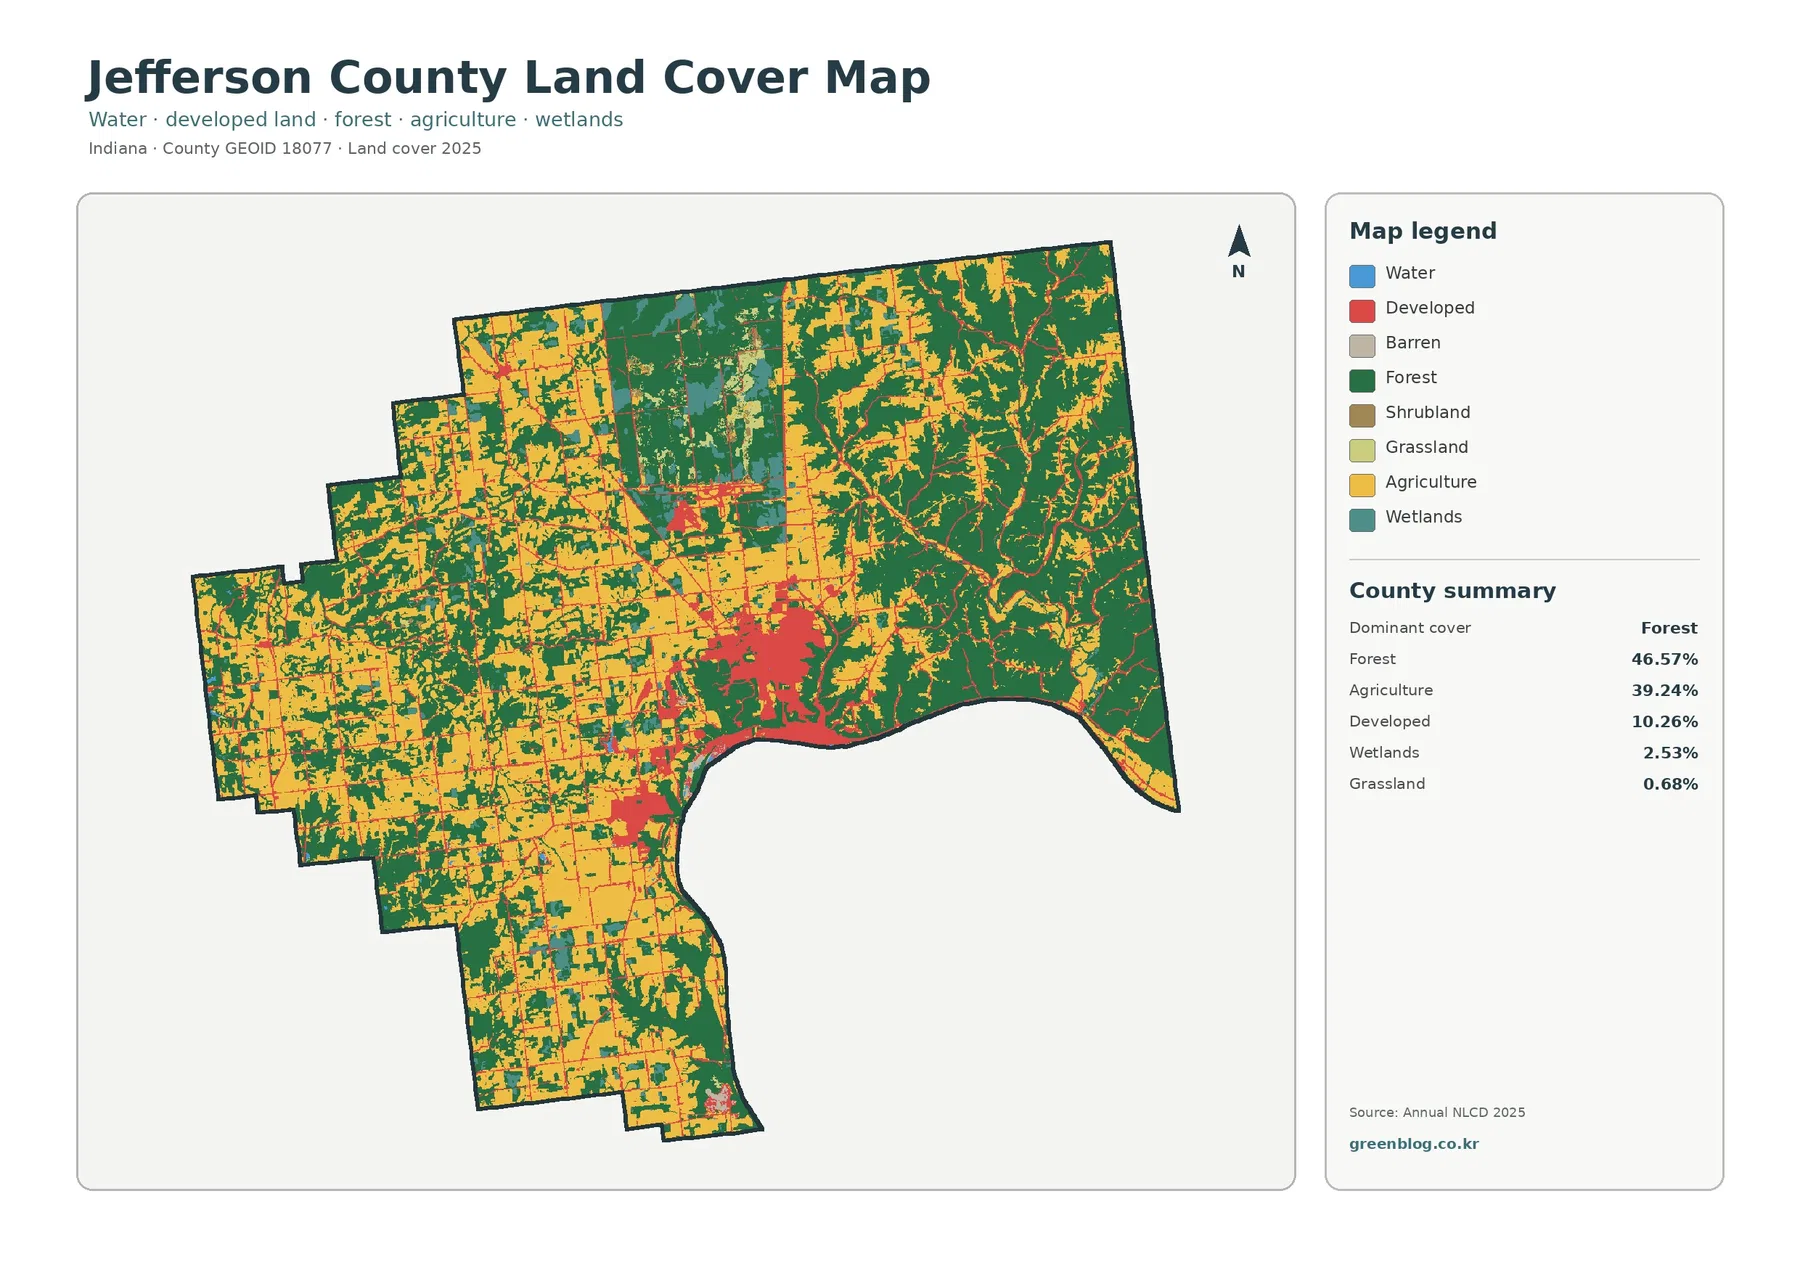
The western and southwestern parts of the county show broader blocks of agricultural cover, interrupted by woodlots and narrow natural strips. The eastern and northeastern parts look more heavily wooded, with agriculture appearing in smaller or more irregular openings. North of Madison, a large area contains a mix of forest, wetland, grassland, and other natural cover rather than the continuous farm pattern seen farther west. This is one reason the county-wide percentages alone do not capture the local contrast.
Land cover should not be read as zoning or parcel ownership. Annual NLCD classifies the surface of the ground in raster cells, so a developed class can include lawns and trees around buildings, and an agricultural class can cross many separate farms or parcels. Jefferson County Planning & Zoning also notes that the City of Madison and Town of Hanover have their own zoning jurisdictions. The land-cover colors therefore should not be used as municipal boundaries or as a substitute for official zoning maps.
The impervious map separates hard surfaces from the broader developed class
Jefferson County has 10.26% developed land in the land-cover summary, but its mean impervious surface is only 2.17%. The area at 50% impervious or greater is 1.06% of the county. That difference matters because developed land is not the same thing as pavement. Neighborhoods, institutions, low-density development, and other built settings may contain roofs and roads along with grass, trees, and other surfaces that still absorb water.
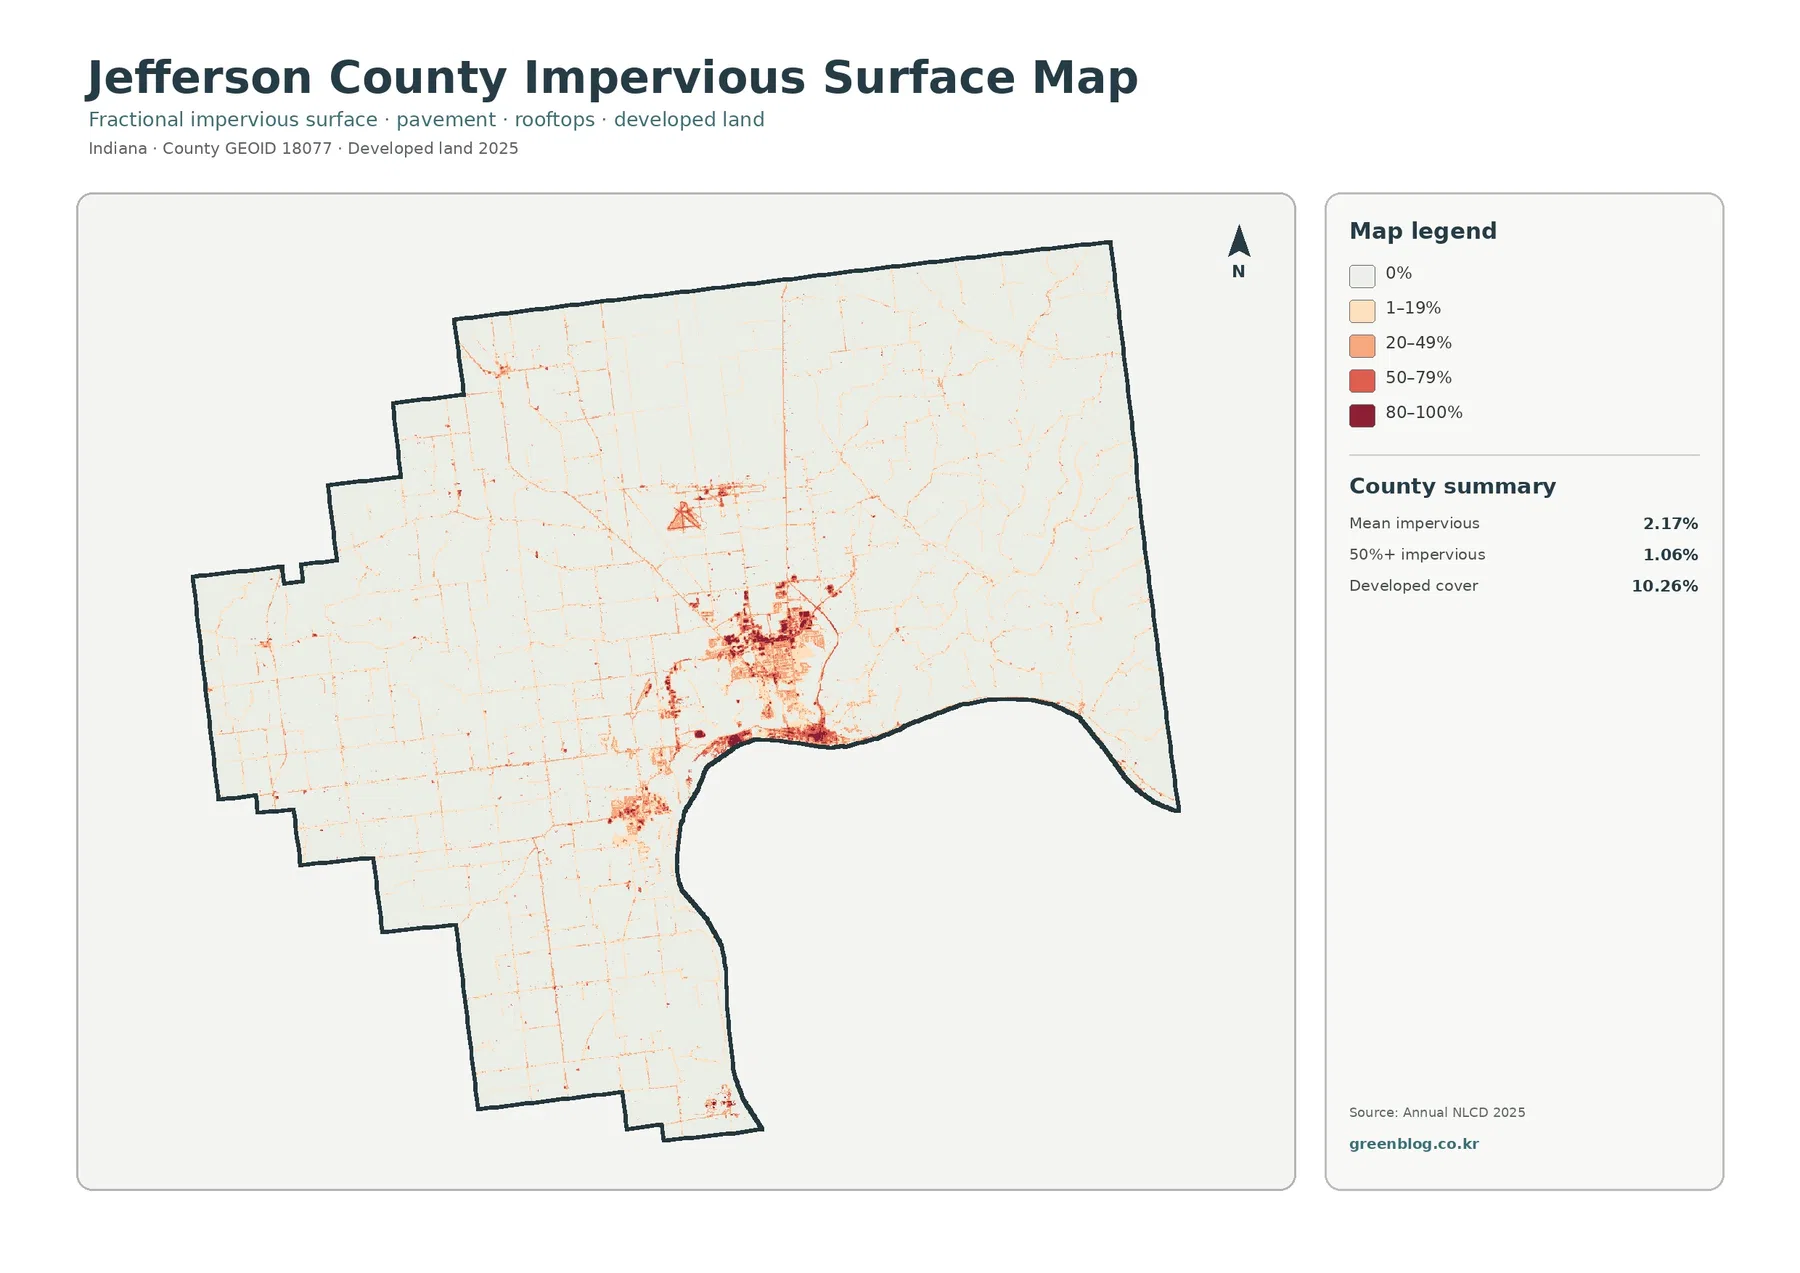
The darkest and most continuous impervious values occur around the Madison area. A smaller built cluster appears to the west toward Hanover, and thin lines trace roads across the rural parts of the county. There is also a distinct narrow impervious feature north of Madison that is visible in the map, but the map does not label it, so it is better treated as a mapped hard-surface feature rather than assigning a specific facility name from the image alone.
A countywide mean of 2.17% should not be applied to downtown Madison or any individual neighborhood. Large areas of forest and farmland lower the average. Within the built cluster, many cells fall into much higher impervious classes. For stormwater or flood work, however, this map is only one input. Runoff also depends on slope, soil, drainage systems, rainfall, stream levels, and other factors that are not shown here.
The impervious map is particularly useful when paired with the general land-cover map. A place may appear as developed in the first view but show only moderate hard-surface values in the second. Reading the two together helps distinguish a broad developed landscape from places where roofs, pavement, and other hard surfaces are actually concentrated.
Big Oaks provides local context for the broad natural cover north of Madison
The forest-and-farmland view reduces visual clutter and makes Jefferson County’s split character easier to see. Forest dominates much of the east and northeast, and a large natural-cover zone also appears in the north-central part of the county. Agriculture is more extensive in the west and southwest, where yellow blocks form larger and more regular shapes. The two leading classes are close in countywide share, but their geography is noticeably different.
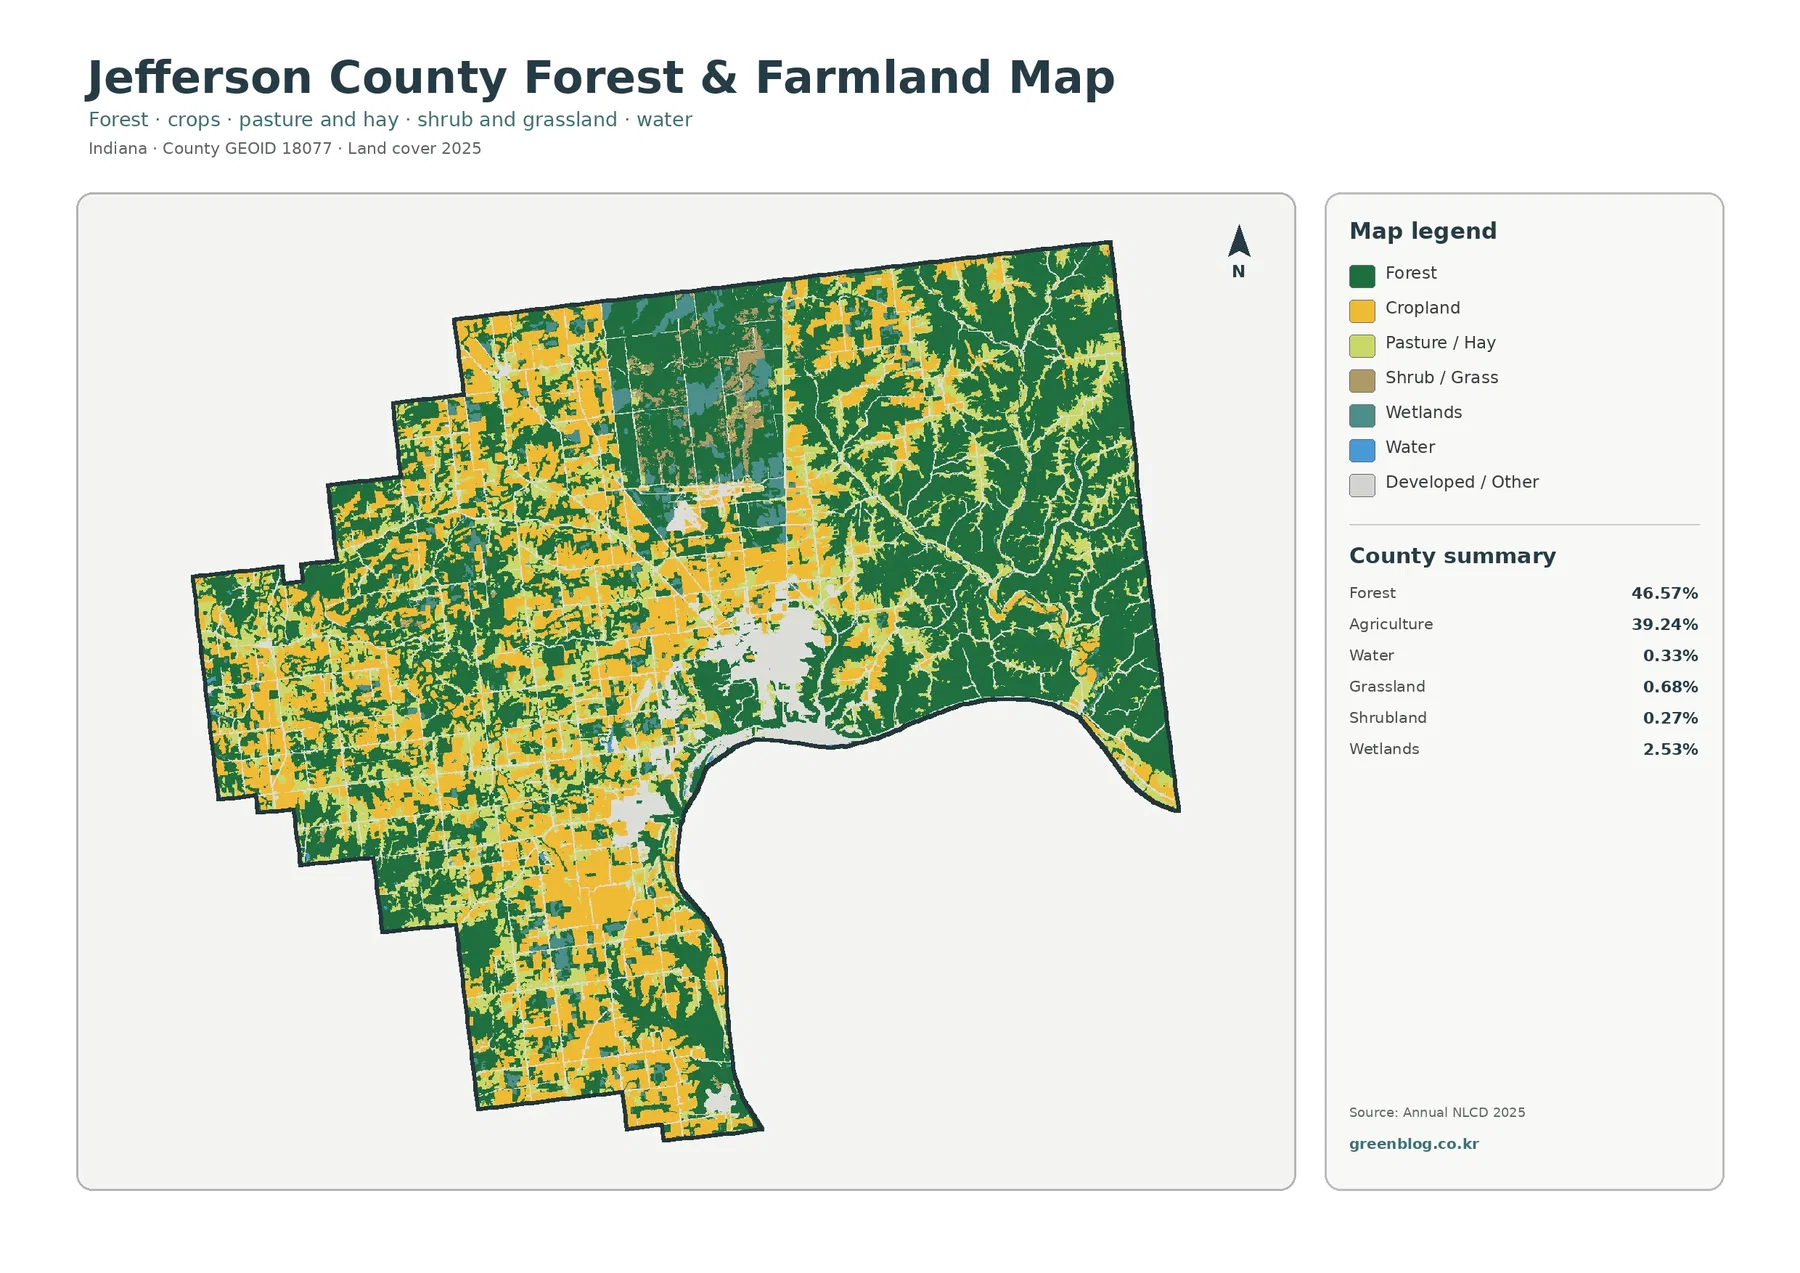
Big Oaks National Wildlife Refuge is useful context for reading the northern portion of the map. The U.S. Fish & Wildlife Service states that Big Oaks encompasses about 50,000 acres across Jefferson, Jennings, and Ripley counties and occupies part of the former Jefferson Proving Ground. The refuge entrance is about five miles north of Madison. Those facts help explain why a large managed natural landscape is important to the county, but the land-cover map does not draw the refuge boundary. Not every green or teal pixel in the north should be assumed to be refuge land.
The refuge also contains multiple habitat types, not just forest. Its official information describes wildlife and habitat management across a large landscape, and the land-cover map likewise shows mixtures of forest, wetland, grassland, and other classes in the northern natural-cover area. The map can therefore help compare broad surface patterns, while the refuge’s own maps are the proper source for property boundaries, access areas, and management units.
The same caution applies to wooded land elsewhere in the county. NLCD forest can include public land, private woodland, streamside trees, and larger continuous forest blocks. A green area is evidence of tree cover, not evidence of ownership or public access. For recreation, forestry rules, or property research, a separate land-management or parcel source is still required.
The Ohio River edge is geographically important even though mapped water is only 0.33%
Jefferson County sits along the Ohio River, yet the 2025 land-cover summary lists only 0.33% water within the mapped county area. That is not a contradiction. The map is clipped to the county boundary rather than built as a river-basin map, so the broad river surface outside the county polygon is not counted as county land cover. The curving southern and southeastern edge still makes the river corridor easy to recognize as a major geographic reference.
Clifty Falls State Park adds another useful piece of local context near Madison. Indiana DNR describes the park as being near Madison and highlights rugged Clifty Canyon, waterfalls, and the nearby Ohio River. The land-cover map does not outline the park, so it cannot be used to claim that a particular forest patch is inside the park. It does show, however, that substantial forest reaches close to the Madison area and continues through much of the eastern side of the county.
Wetlands account for 2.53%, much more than open water. Teal wetland cells appear within the northern natural-cover area and in narrower strips elsewhere among forest and agricultural land. Because wetlands often occur as elongated or broken patches, their visual importance can be greater than their countywide percentage suggests. At the same time, an NLCD wetland class is not a regulatory wetland determination; project permitting or legal wetland boundaries require separate official information and, in some cases, field work.
Small streams and narrow wet areas can also be generalized by the 30-meter raster. A cell that contains water, trees, grass, and a road is assigned a representative class rather than recording every feature separately. For watershed teaching or regional comparison, this level of detail is useful. For a culvert, parcel, streambank, or site plan, the map is too generalized to stand alone.
Agriculture forms the western counterweight to Jefferson County’s wooded east
Agriculture covers 39.24% of the county, making it the second-largest class. Its strongest visual presence is on the western and southwestern side, where the forest-and-farmland map shows larger yellow blocks separated by smaller woodlots and narrow natural strips. The eastern side is more strongly green, creating a clear west-to-east contrast even though neither class has a majority much larger than the other.
The shape of the agricultural cover is also different from the forest pattern. Many farm areas appear in straighter, more regular blocks, while wooded areas often follow irregular edges and branching forms. The map itself does not prove why those differences exist. Soil, slope, land ownership, road access, and historical land use all influence agriculture, but those causes need separate evidence. The map is best used to describe where agricultural cover is concentrated, not to explain every reason it is there.
Agriculture in Annual NLCD is also broader than a crop inventory. Cropland and pasture/hay can be grouped into the agricultural total, and the simplified map is designed to emphasize the contrast with forest. It cannot identify corn versus soybeans, farm boundaries, yield, or management practices. Those questions require agricultural statistics or field-level data beyond this land-cover package.
The 1985–2025 map records 13.20% class difference, not a single growth rate
The change view compares the mapped class in 1985 with the mapped class in 2025. Jefferson County has 13.20% total class difference. Within that summary, 1.85% is mapped as change to developed, 2.05% as forest loss, 0.80% as agricultural loss, and 8.42% as other class difference. Wetland difference is shown as its own legend category as well. These categories make it clear that 13.20% should not be described as a development rate or a simple measure of land consumed by growth.
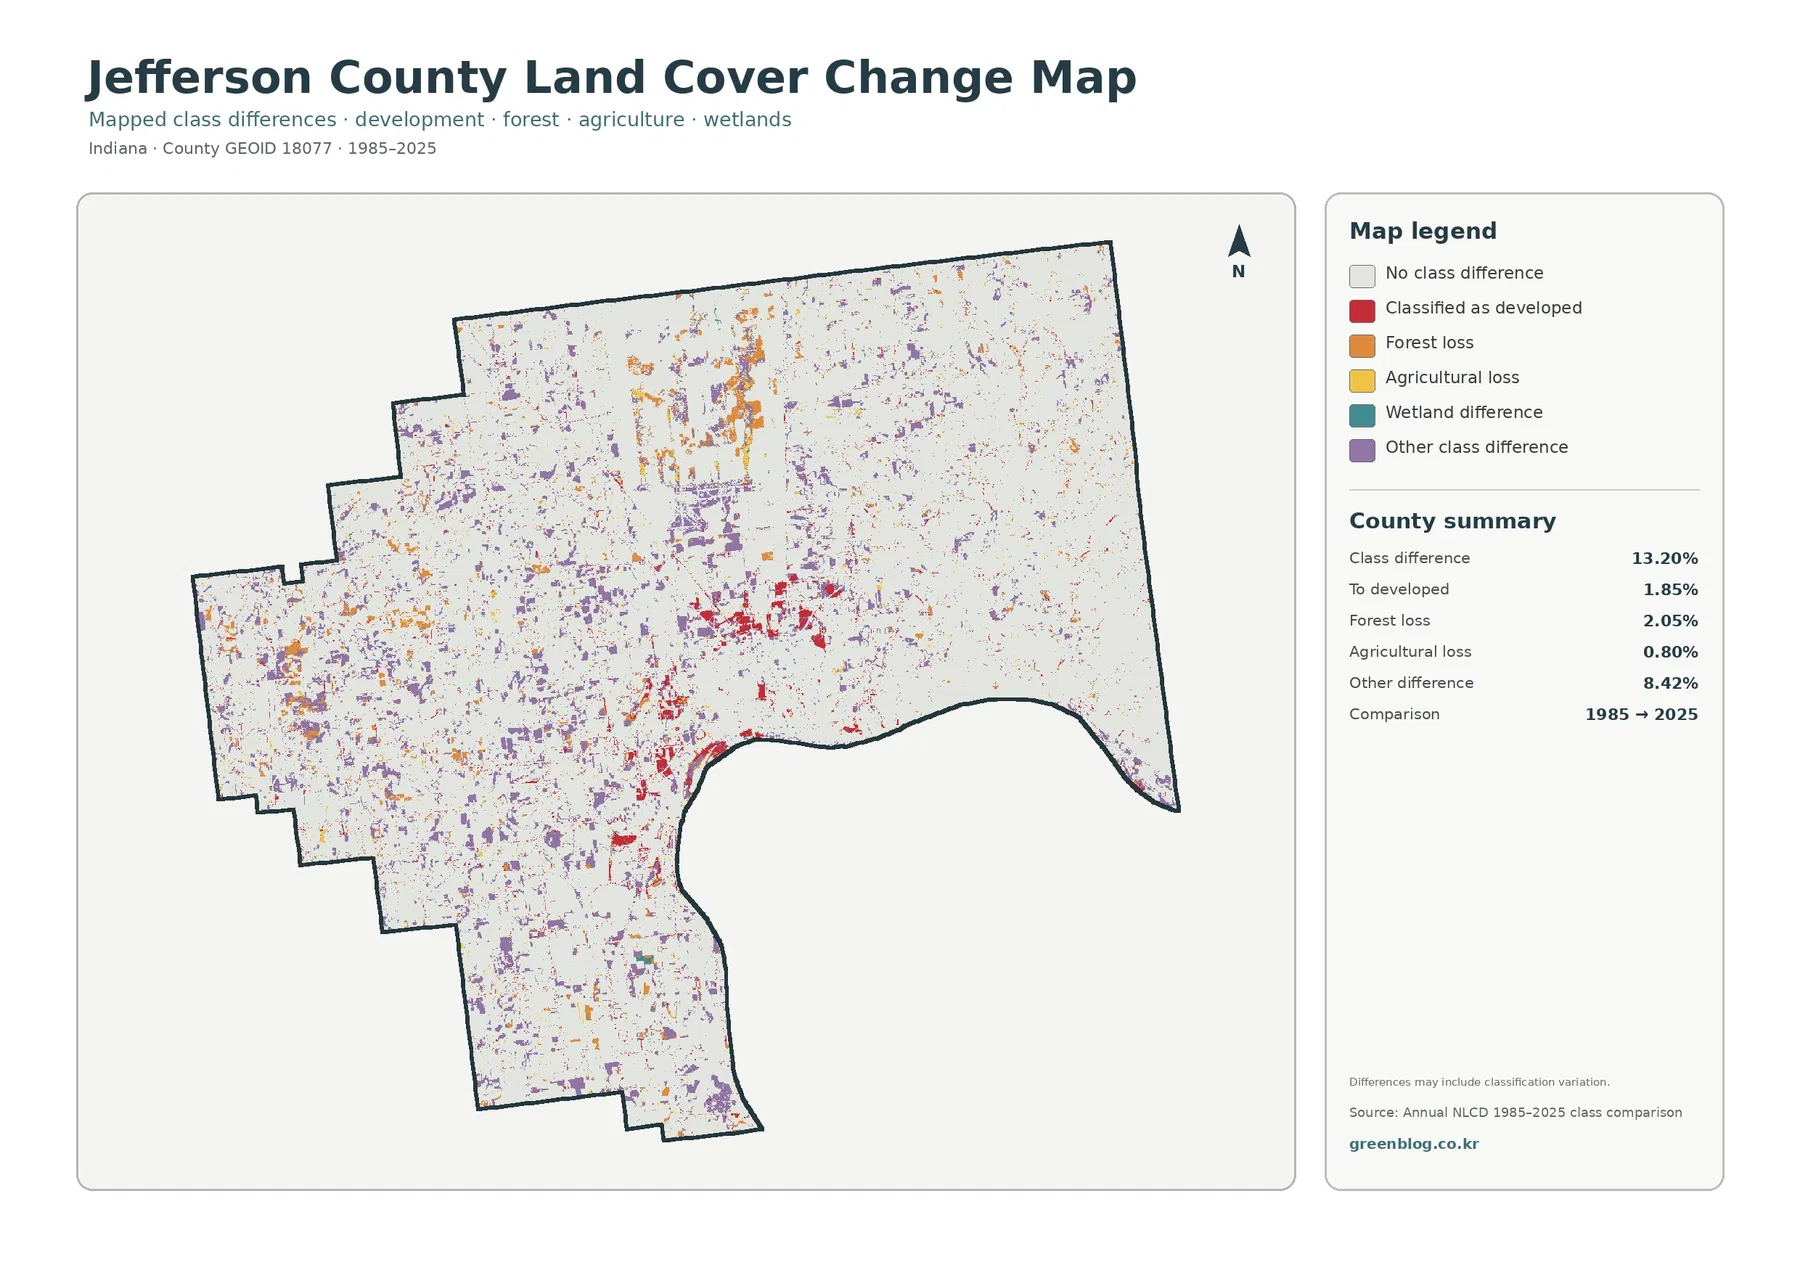
Red change-to-developed cells are most noticeable around Madison and in some smaller settled or road-adjacent locations. Orange forest-loss cells and purple other-difference cells are more scattered, including parts of the northern and western county. Much of the map remains light, indicating the same representative class at the two endpoints. Comparing colors rather than focusing on one category gives a more accurate reading of the map.
An endpoint comparison cannot tell you the exact year a change occurred. It also does not identify the cause. A cell that differs between 1985 and 2025 might reflect real land conversion, vegetation change, hydrologic differences, or classification variation at a complex edge. The map itself warns that differences may include classification variation. If the question is when a subdivision appeared, when forest clearing happened, or what caused a land-cover transition, intermediate-year imagery and local records are needed.
Forest loss at 2.05% is also not the same as net countywide forest decline. The change legend reports a direction of class difference, while other cells may have changed into forest or into another category that is summarized elsewhere. The same caution applies to the 0.80% agricultural-loss value. These percentages are most useful for locating areas worth closer investigation rather than replacing a full time-series land-change analysis.
Use the four maps as a sequence: context, contrast, hard surface, then time
Start with the general land-cover map when you need orientation. It shows Madison, the agricultural west, the wooded east, the northern natural-cover area, wetlands, and smaller developed patches in one view. Then use the forest-and-farmland map to strip away much of the visual complexity and focus on the county’s two dominant covers. This two-step comparison works well for explaining why Jefferson County does not look like a uniformly agricultural county.
Move to the impervious map when the question is about the intensity of built surfaces. Madison becomes much more distinct, rural roads appear as thin lines, and most forest or farm areas fade to very low values. Finally, use the 1985–2025 map when you need historical comparison. Checking the same location across all four maps is more informative than reading any one layer as a complete description of land use.
For a presentation, keep the maps at the same orientation and similar size so the reader can follow the same place from one view to the next. A Madison example can move from red developed cover, to darker impervious values, to red change-to-developed cells where they occur. A northern example can compare the large natural-cover area with the forest-and-farmland view and then check whether forest loss or other class differences appear in the historical layer.
The dates and scale should travel with the maps. Current land cover and impervious values are based on Annual NLCD 2025, while the change layer compares 1985 and 2025. The 30-meter grid is appropriate for county-scale comparison but can simplify narrow streams, individual buildings, small fields, and parcel edges. Changes after the 2025 observation year are not included, so recent local projects should be checked against newer imagery or official planning information.
Frequently Asked Questions
Why does Jefferson County look more wooded than many Indiana farm counties?
The 2025 summary gives forest 46.57% and agriculture 39.24%, and the map places much of the broad forest cover in the east, northeast, and parts of the north. Big Oaks National Wildlife Refuge is also an important managed natural landscape north of Madison, although the land-cover map does not draw its boundary. The western and southwestern county remains strongly agricultural, so the county is better described as a forest-farm split than as uniformly wooded.
Does a 2.17% mean impervious value describe the built surface inside Madison?
No. The 2.17% figure is an average across the entire county, including large areas of forest and farmland with very little pavement or roofing. The impervious map shows much higher local values inside the Madison built cluster and along some roads and smaller developed areas. Site-scale drainage or stormwater work still requires more detailed local data.
Is the 13.20% class difference from 1985 to 2025 the amount of new development?
No. Only 1.85% of the county is summarized as change to developed. The 13.20% total also includes 2.05% forest loss, 0.80% agricultural loss, wetland difference, and 8.42% other class difference. It is an endpoint land-cover classification comparison, not a population-growth or construction-rate statistic.
Map File Information
The ZIP contains four original JPG maps for Jefferson County: 2025 land cover, forest and farmland, impervious surface and developed land, and the 1985–2025 land-cover class-difference map.
- Printable Size: 2480 × 1754 px each
- File Type: ZIP containing 4 JPG images
- Intended Use: printing, classes, presentations, county land-cover comparison, and reference graphics
Related Maps
- Adams County Indiana Land Cover Map
- Allen County Indiana Land Cover Map
- Bartholomew County Indiana Land Cover Map
Sources and references
- MRLC Annual NLCD Data – official source for Annual NLCD land-cover and impervious data
- USGS Annual NLCD Land Cover Classification – classification system and 30-meter land-cover documentation
- U.S. Census Bureau TIGER/Line Shapefiles – official geographic boundary data used to identify Jefferson County
- U.S. Fish & Wildlife Service – Big Oaks National Wildlife Refuge – official context for the large refuge landscape in Jefferson, Jennings, and Ripley counties
- Indiana DNR – Clifty Falls State Park – official information on the park near Madison, Clifty Canyon, and the Ohio River setting
- Jefferson County Planning & Zoning – county planning information and zoning-jurisdiction notes for Madison and Hanover
Green Map creates custom-edited map images using open geographic data sources such as geoBoundaries, Natural Earth, OpenStreetMap, and government open data.
These maps are edited visual materials, not raw data files, and are provided for education, documents, presentations, and graphic reference.