Hancock County is still dominated by farmland, yet the 2025 land-cover map shows a sharp internal contrast. Broad agricultural cover fills much of the east and northeast, while Greenfield and several western communities form larger concentrations of developed land. Narrow wooded and wet areas break up the farm grid in a few corridors, but they occupy a much smaller share of the county. Reading the map by location, rather than by percentages alone, makes the county’s pattern much easier to understand.
This page brings together four views of the same landscape: current land cover, forest and farmland, impervious surface, and mapped class differences from 1985 to 2025. The WebP images are useful for quick comparison on the page, and the four original JPG maps are packaged together in one ZIP. A practical sequence starts with the countywide pattern and then moves to the simplified farm-and-forest view. Built surfaces around the main communities come next, followed by the long-term change comparison.
Table of Contents
Where developed cover breaks the agricultural grid
The 2025 summary places agriculture at 72.28% of Hancock County, followed by developed land at 20.55%, forest at 5.87%, wetlands at 0.95%, and water at 0.29%. Those numbers describe the county as a whole, but the map reveals that the categories are not evenly mixed. Large farm blocks dominate the eastern side, whereas the central and western parts contain the most obvious built areas. The result is a county that can look strongly rural and strongly suburban depending on which side of Greenfield is being examined.
Greenfield forms the clearest developed center near the middle of the county. From there, additional red areas appear toward Mount Comfort and the western county line, with separate clusters toward McCordsville and Fortville in the northwest and New Palestine in the southwest. Agricultural cover remains between these places, so the western half is not one continuous urban area. Instead, it is a patchwork of communities, transportation corridors, farm fields, and other developed surfaces.
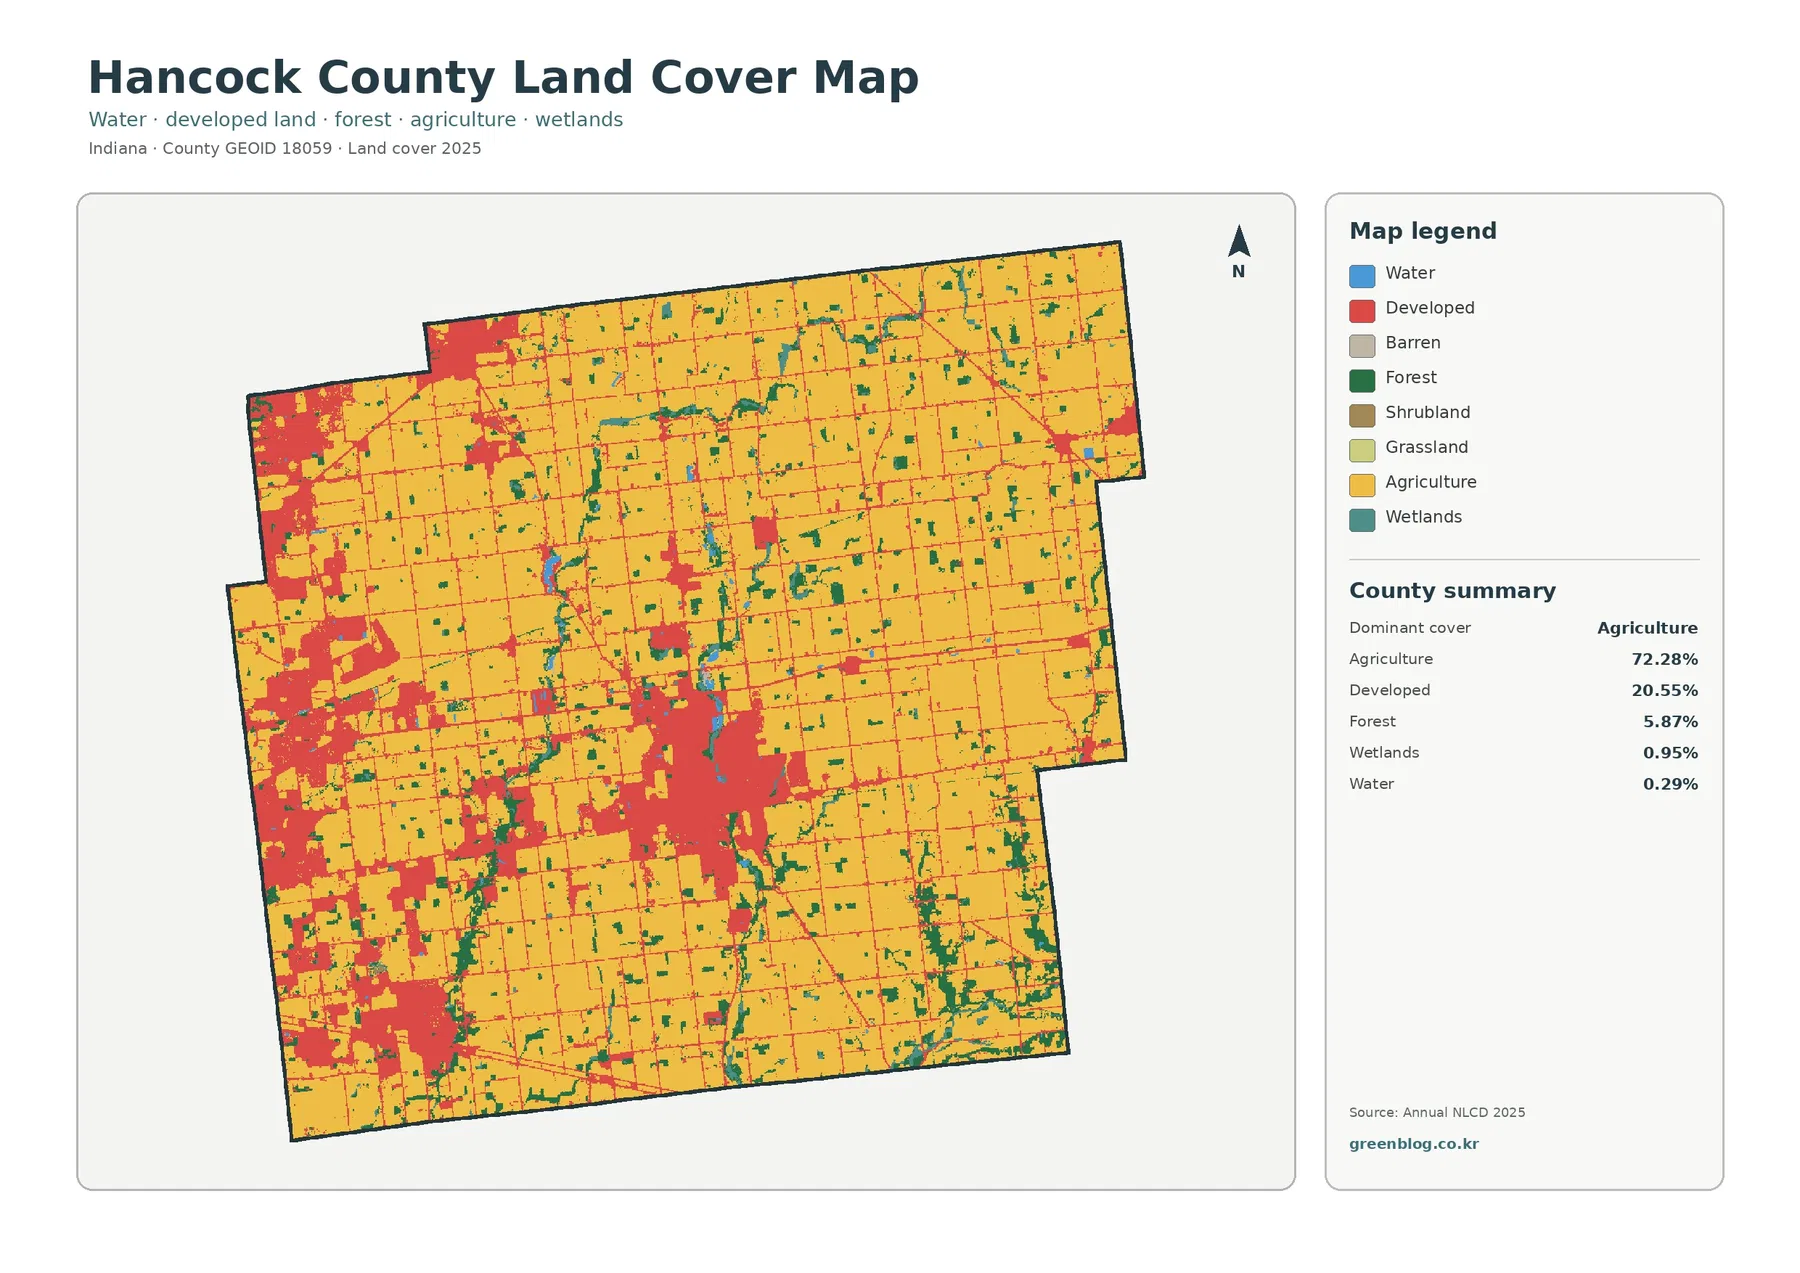
Farther east, the red patches become smaller and more separated. Fields occupy much of the space between the road grid, with wooded strips and small wet areas appearing along drainage features and field edges. This east-west contrast is one of the most useful things the general map can show because it combines every major cover class without turning the page into a list of statistics. It also explains why a county with more than seven-tenths agricultural cover can still contain several visually prominent developed centers.
The farm-and-forest view separates fields from the smaller natural cover
Removing much of the detail from developed and other classes makes the agricultural pattern even clearer. Cropland and related agricultural cover spread across nearly every part of the county, including areas between the western communities. The largest uninterrupted farm areas are easier to pick out east and northeast of Greenfield, while western fields are more frequently divided by gray developed areas and roads.
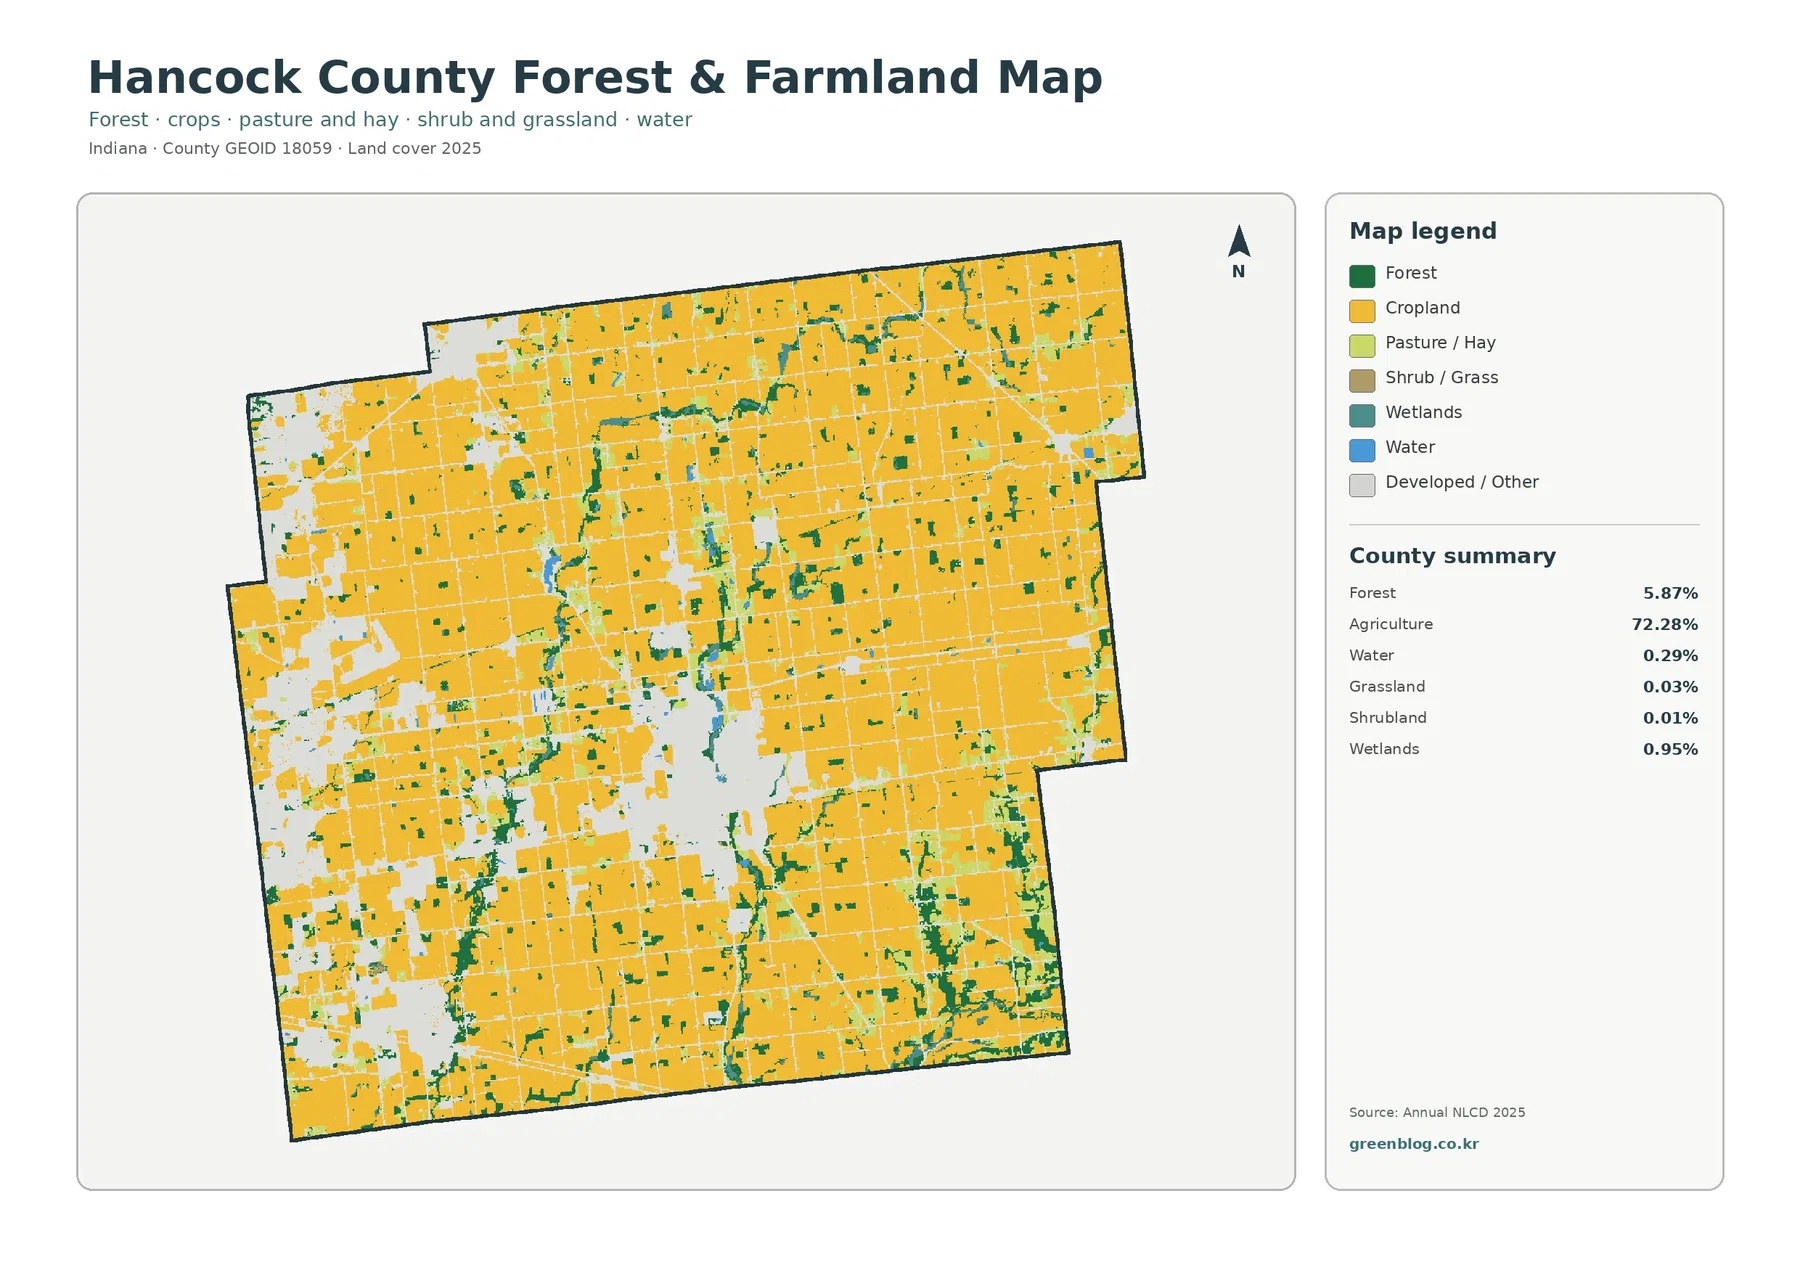
Forest accounts for 5.87%, so wooded cover is secondary to agriculture but still visible in meaningful locations. Rather than forming a large forest block, green areas often appear as small patches or narrow bands near streams and lower ground. Wetlands make up 0.95% and water 0.29%, which means neither category dominates the landscape. Their importance on the map comes from where they occur: narrow blue-green features can interrupt otherwise large agricultural blocks and help identify drainage-related natural cover.
The legend also lists grassland at 0.03% and shrubland at 0.01%. Because those shares are extremely small, they are not useful as the main story of the county. Farmland, developed land, forest, wetlands, and water provide a much clearer description of what is actually visible. None of these colors represents zoning, ownership, or a legal land-use designation; they describe the surface class assigned from the land-cover data.
Impervious cover pinpoints Greenfield and the western built centers
Impervious surface adds a different measurement. The countywide mean is 7.30%, and 4.83% of the area falls in cells with at least 50% impervious cover. That is much lower than the 20.55% developed-land share because a developed class can include lawns, trees, and other surfaces that still absorb water. Impervious values focus more directly on pavement, rooftops, parking areas, and similarly sealed surfaces.
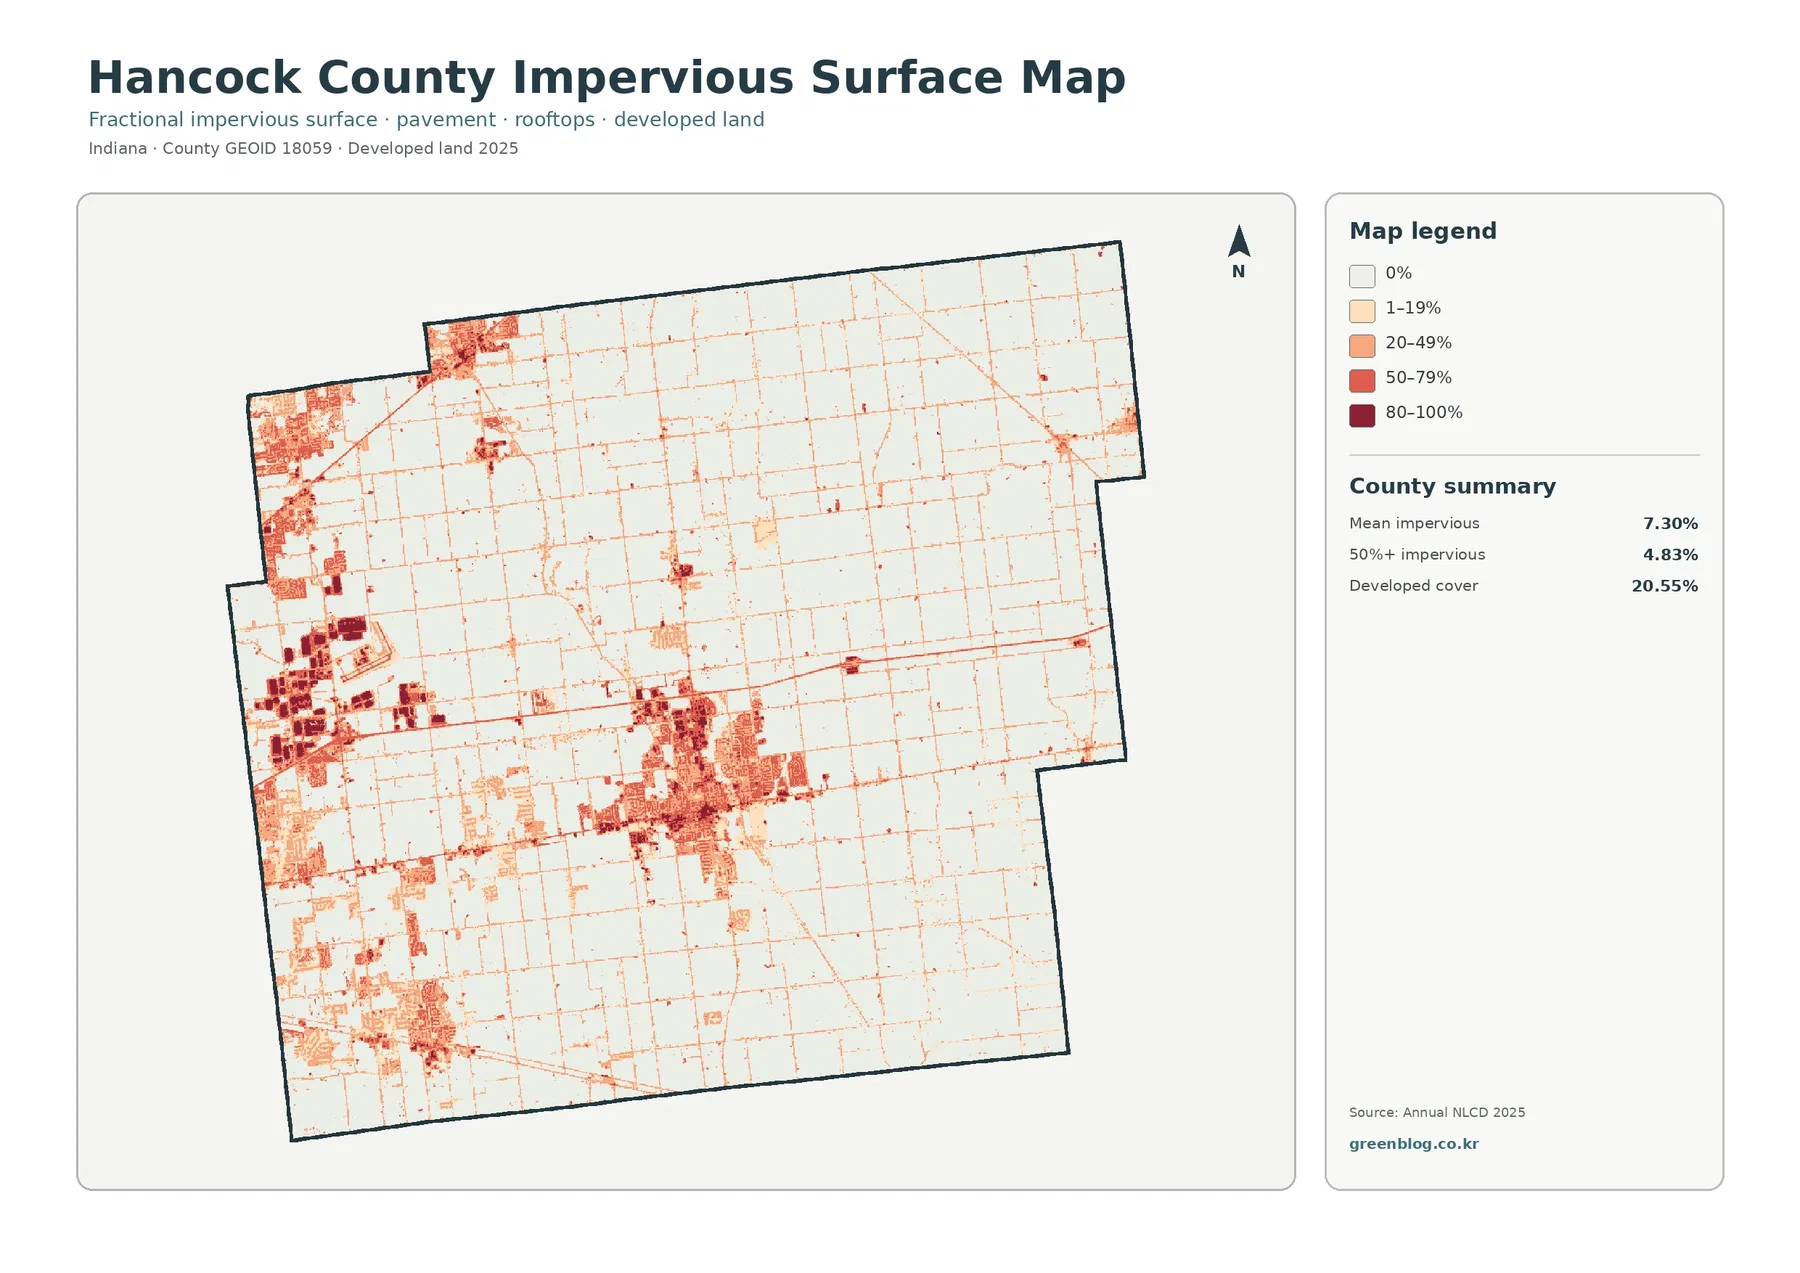
Greenfield contains the densest and most extensive high-value pattern in the central county. Another strong concentration appears near Mount Comfort, while smaller but distinct areas occur toward McCordsville, Fortville, and New Palestine. Thin lines crossing low-impervious agricultural areas often follow paved transportation routes. The eastern countryside, by comparison, is dominated by very low values except where roads or small settlements interrupt the fields.
Comparing this image with the general land-cover map helps separate “developed environment” from “hard surface.” A subdivision may be classified as developed across a broad area. Only streets, driveways, roofs, and other constructed surfaces receive high impervious values. That distinction is useful for studying built intensity, but it does not turn the map into a flood-risk product. Drainage, rainfall, terrain, soils, stream conditions, and infrastructure all matter for site-specific flooding.
The 1985–2025 comparison concentrates change around today’s built areas
The two-date change summary reports a 15.65% total class difference. Within that total, 8.20% is identified as change to developed, 0.88% as agricultural loss, 0.16% as forest loss, and 6.36% as other class difference. Wetland difference is also represented in the legend. The key point is that 15.65% is not a development rate; it combines several types of classification difference between 1985 and 2025.
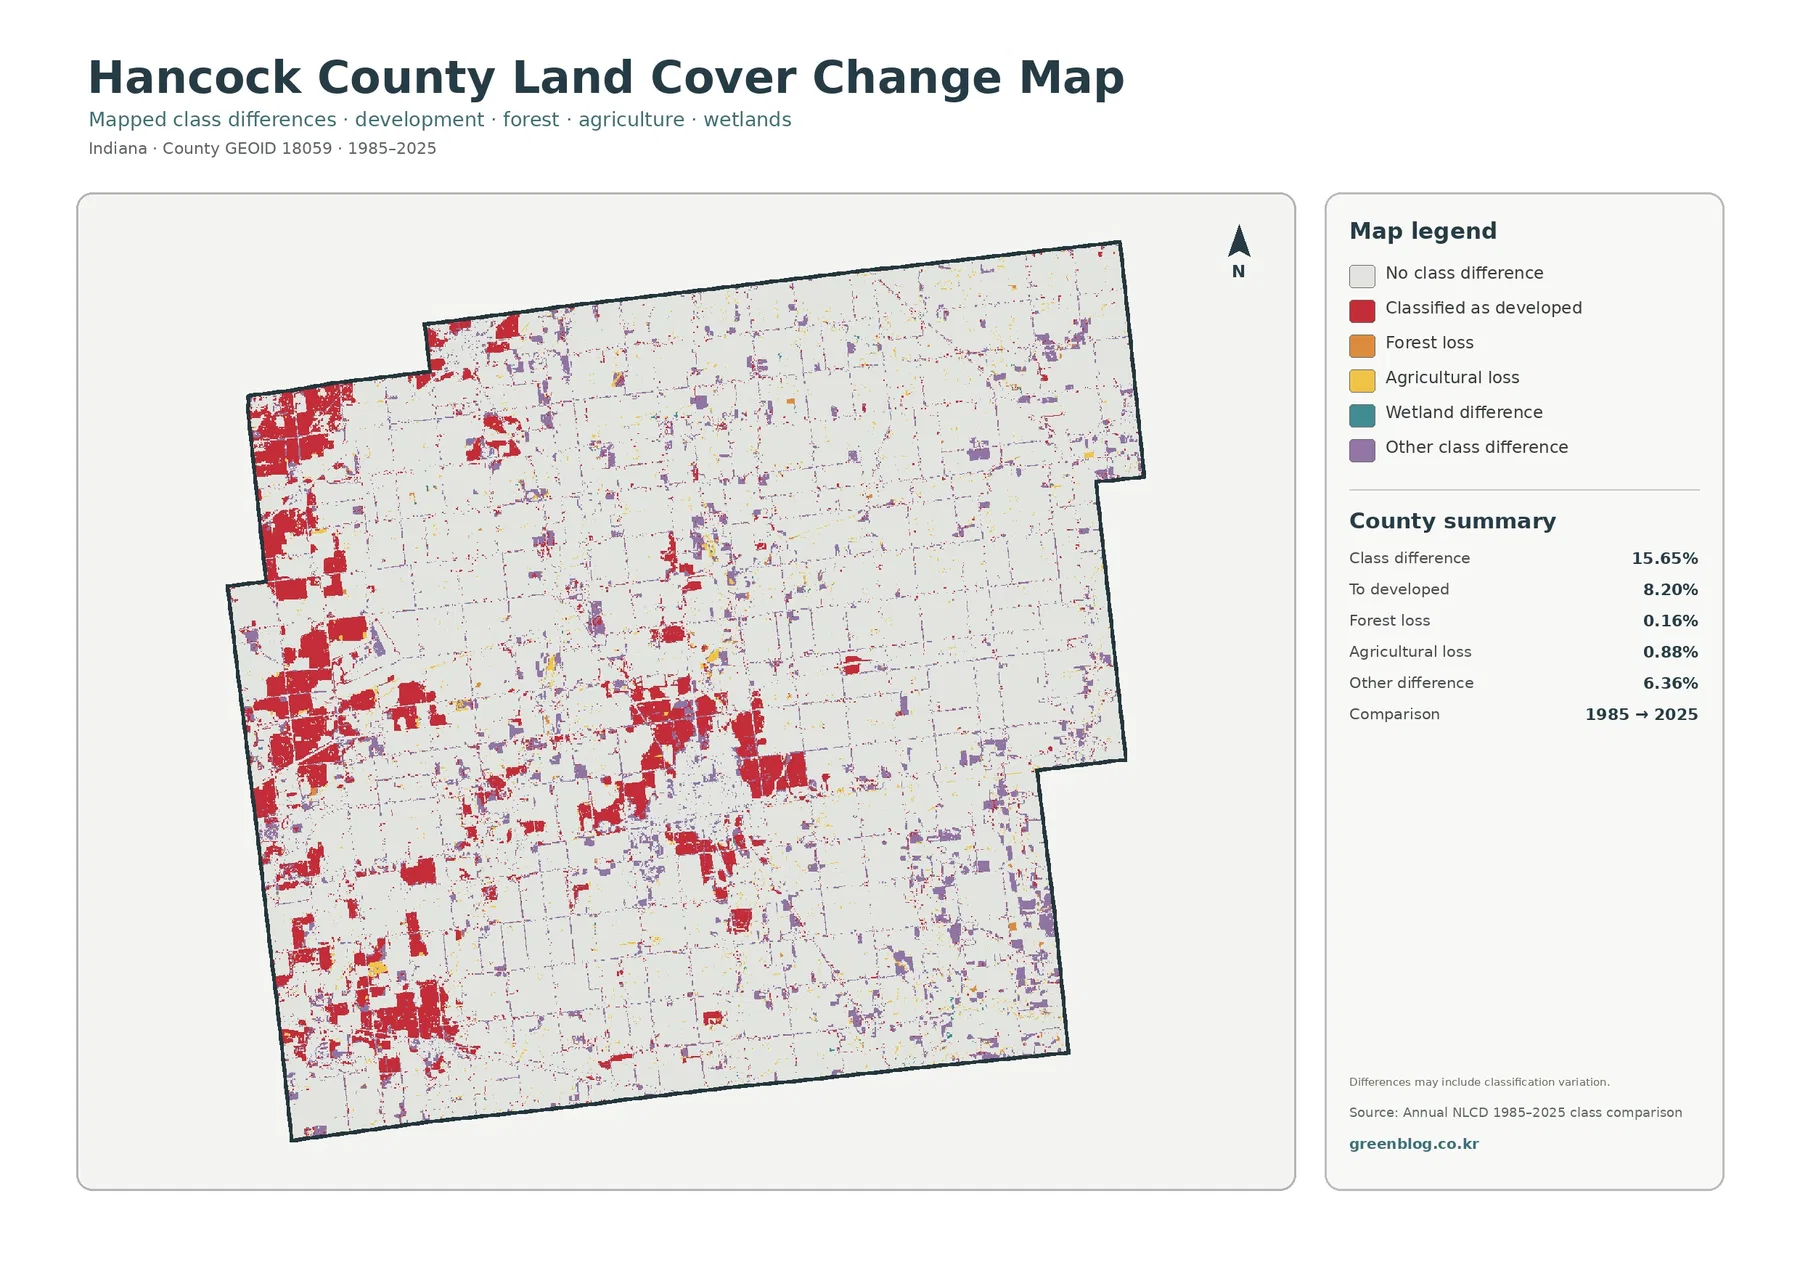
Red change areas are especially noticeable around Greenfield and across the western side, which is also where current developed cover and impervious surfaces are most concentrated. The northwest and southwest contain additional red patches near the communities that already stand out on the 2025 maps. Large parts of the east remain white, indicating no mapped class difference between the two comparison dates in those cells.
Purple, yellow, orange, and teal pixels remind the reader that not every change is urban development. Some differences involve agriculture, forest, wetlands, or another class. Classification methods and raster resolution can also contribute to small differences, so the product should not be treated as a parcel-by-parcel history. A specific development date or acreage change requires more detailed records, historical imagery, or local GIS sources.
Using Greenfield and Mount Comfort as reference points
Local place names make the land-cover pattern easier to orient. Greenfield is the central reference because its developed area is large and easy to recognize on all four products. Mount Comfort provides a second useful point farther west, where the county comprehensive plan discusses substantial industrial development near the I-70 interchange and additional growth in the surrounding area. The land-cover and impervious maps show a broad concentration of built surfaces in that same part of the county.
McCordsville and Fortville help explain the northwest, while New Palestine anchors a separate developed area in the southwest. Farm fields remain between those communities, which is why the western side appears fragmented rather than fully urbanized. Moving east from Greenfield changes the picture again: agricultural blocks become larger, and developed concentrations are smaller and farther apart.
Roads such as I-70 and US 40 provide useful geographic context, but the maps are not transportation studies. A corridor may coincide with developed or impervious cover without proving that the road caused a particular change. The county comprehensive plan, transportation documents, historical imagery, and project records are better sources for explaining why development occurred or when a specific site changed.
Choosing the right map without overreading the data
For a countywide overview, the general land-cover map is the best starting point. It keeps agriculture, developed land, forest, wetlands, and water in one view. The forest-and-farmland version is easier when the question is simply where fields and wooded cover remain. The impervious product is more useful for locating concentrated pavement and rooftops, while the change map answers a different question by comparing the assigned class at two dates.
A classroom or report can use all four without repeating the same explanation. One useful sequence begins with the east-west contrast on the first map and the remaining farm and woodland pattern on the second. The third map can then compare built intensity around Greenfield and Mount Comfort. Finally, the fourth map shows whether substantial class change appears in those same areas. Each step adds a new layer rather than restating the county summary.
Every product is a generalized raster classification. Small streams, narrow tree lines, individual buildings, and parcel edges may be simplified by cell size and classification rules. The maps do not establish property ownership, zoning, building rights, municipal boundaries, or survey lines. Local government GIS and planning records should be used when a decision depends on those legal or site-specific details.
Frequently Asked Questions
Why does the western side look more developed when agriculture is 72.28% countywide?
Most of the county’s agricultural cover is concentrated across the east, northeast, and other large areas outside the main developed centers. Greenfield and the western communities occupy a smaller share of the county but create larger, denser developed patches. The countywide percentage combines both patterns, while the map shows where each class is located.
Why is developed land 20.55% but mean impervious cover only 7.30%?
Developed land can include lawns, trees, and other permeable surfaces within a built environment. Impervious cover focuses on surfaces such as pavement, rooftops, and parking areas that do not readily absorb water. Because the two measures describe different parts of the landscape, the developed percentage can be substantially higher than the countywide mean impervious value.
Does 15.65% class difference mean 15.65% of Hancock County became developed?
No. The 15.65% total combines several kinds of class difference between 1985 and 2025. The summary identifies 8.20% as change to developed, 0.88% as agricultural loss, 0.16% as forest loss, and 6.36% as other class difference, with wetland difference also represented in the legend. It is a two-date land-cover comparison rather than a single development-rate statistic.
Map File Information
The ZIP contains four original JPG maps for Hancock County: 2025 land cover, forest and farmland, impervious surface/developed land, and the 1985–2025 land-cover change comparison.
- Printable Size: 2480 × 1754 px each
- File Type: ZIP containing 4 JPG files
- Intended Use: printing, classroom work, reports, presentations, and county land-cover reference
Related Maps
- Adams County Indiana Land Cover Map
- Allen County Indiana Land Cover Map
- Bartholomew County Indiana Land Cover Map
Sources and references
- MRLC Annual NLCD Data – official access to annual land-cover data used for the mapped classes
- USGS Annual NLCD Land Cover Classification – class definitions and guidance for interpreting the dataset
- U.S. Census Bureau TIGER/Line Shapefiles – official geographic boundary data for county mapping
- Hancock County Cities – county government context for Greenfield, McCordsville, Fortville, New Palestine, and nearby communities
- Hancock County Comprehensive Plan – local planning context for Mount Comfort, western growth, and land-use policy
Green Map creates custom-edited map images using open geographic data sources such as geoBoundaries, Natural Earth, OpenStreetMap, and government open data.
These maps are edited visual materials, not raw data files, and are provided for education, documents, presentations, and graphic reference.