Yukon-Koyukuk Census Area spans an enormous section of Interior Alaska. The map makes the distance between its communities obvious from the start. U.S. Census Bureau geography lists about 145,576 square miles of land, making it the largest county-equivalent in Alaska by land area. Fort Yukon sits far to the east, Galena and Nulato are well to the west, McGrath is deep in the southern part of the area, and many smaller communities occupy river corridors between them. This page explains the boundary and settlement map, the ranked city distribution, and the terrain-and-water reference. The same high-resolution JPG files are available together in the download box near the end of the article.
The word “Census Area” is important here. In Alaska, census areas are statistical county equivalents used within the portion of the state that is outside organized boroughs; they are not borough governments of their own. That helps explain why a single boundary can contain such a huge and varied landscape. On the supplied maps, a handful of numbered highways appear mainly in the eastern and southeastern portions, while many labeled settlements lie far from those road corridors. Rivers and drainage networks fill much of the space in between, so geography here is easier to understand by looking at settlements, roads, and water together rather than treating the area like a conventional road-centered county.
Table of Contents
A boundary that stretches from Fort Yukon to the lower Interior
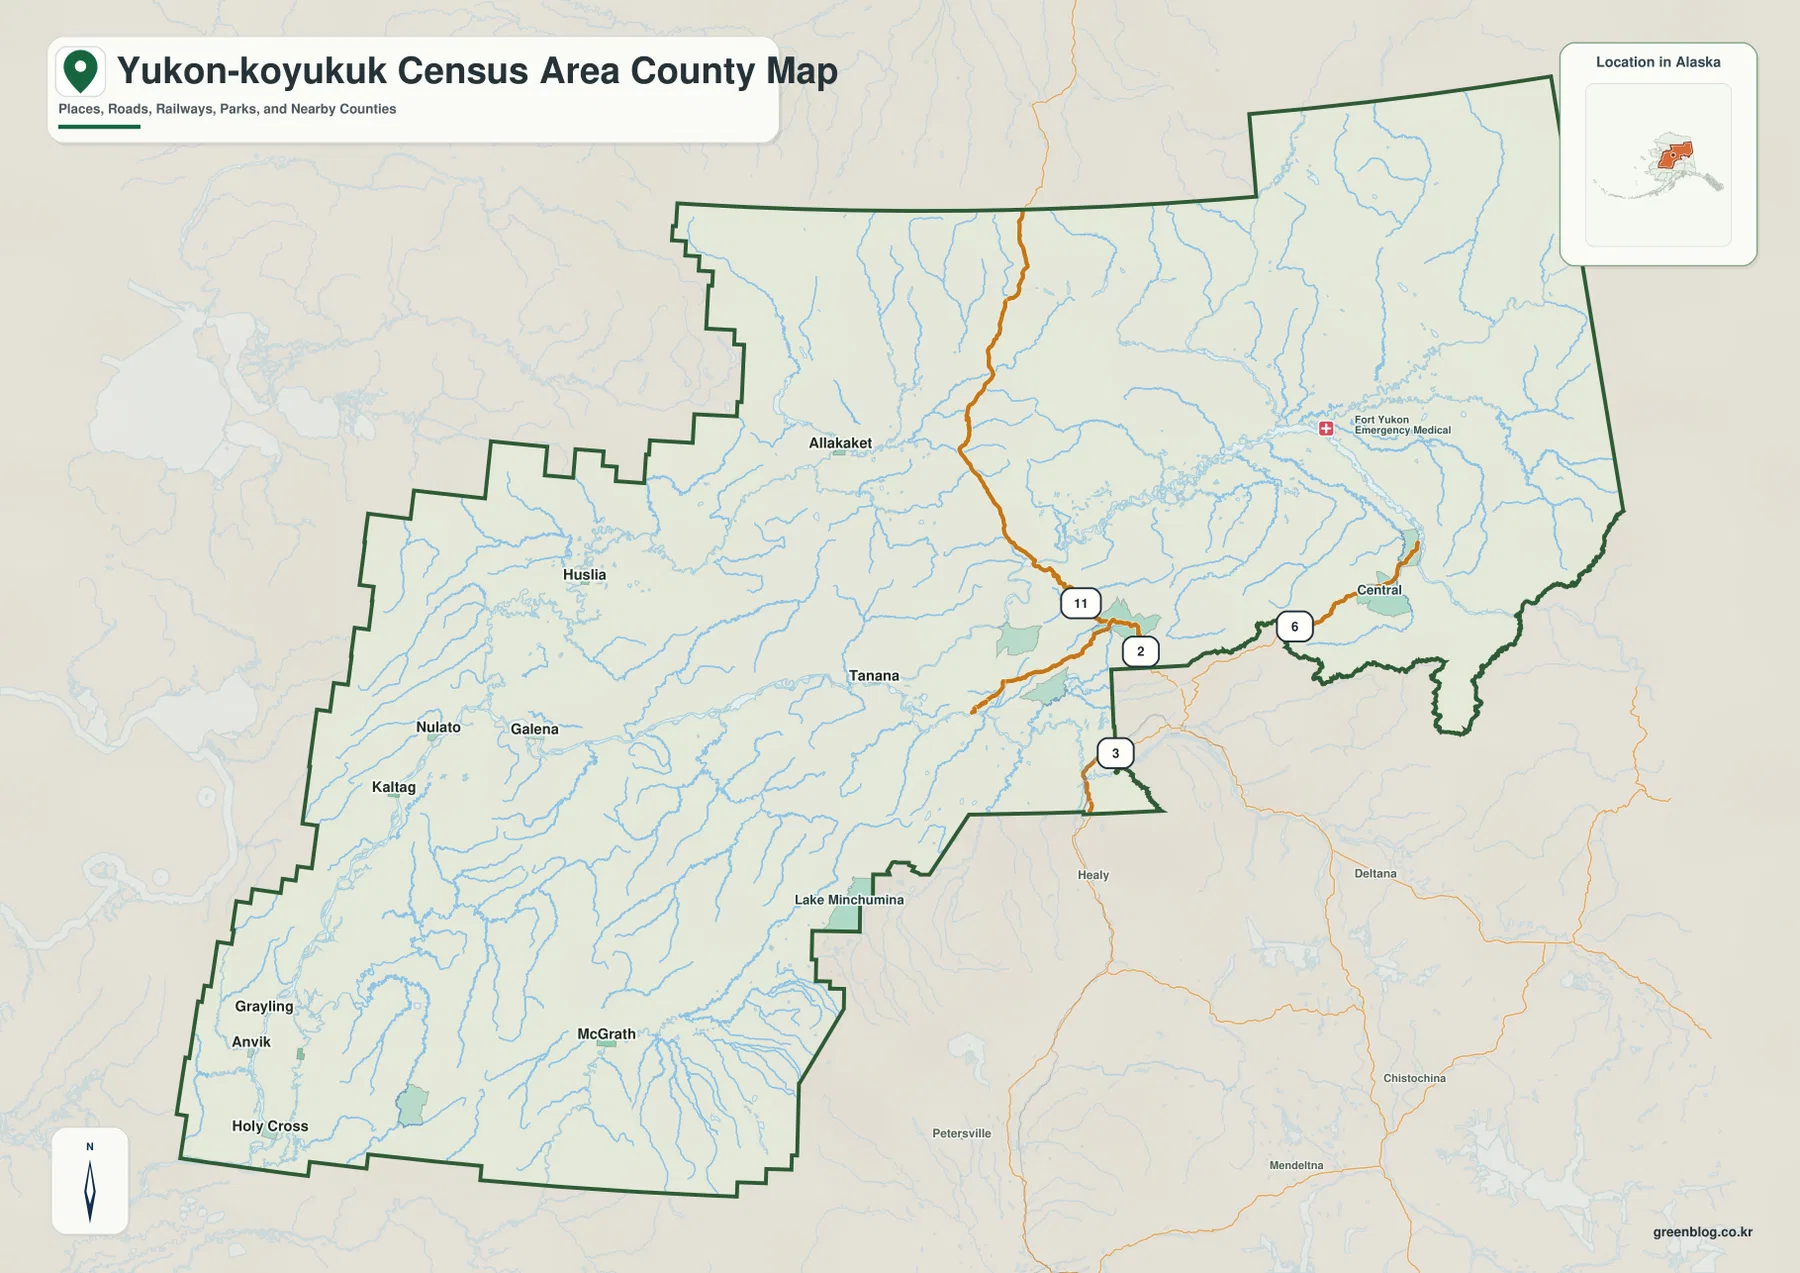
The general map is the best place to appreciate scale. Fort Yukon and Central are labeled near the eastern side, Allakaket and Tanana occupy the broad middle, and Huslia, Nulato, Galena, and Kaltag form a group of western river communities. Farther south are Lake Minchumina and McGrath, while Grayling, Anvik, and Holy Cross appear toward the southwest edge. These are not suburbs around one metropolitan center. They are separate communities spread across a county-equivalent so large that the gaps between labels become an important part of the story.
The numbered highways are concentrated in only part of that space. Alaska Route 11 is the Dalton Highway, which runs north from its connection with the Elliott Highway near Livengood. Route 2 includes the Elliott Highway in this part of Interior Alaska, Route 6 follows the Steese Highway toward Central and Circle, and Route 3 is the Parks Highway near Nenana. Alaska DOT&PF describes the Elliott Highway as the road linking the Steese and Dalton highways before extending toward Manley Hot Springs, while the Steese continues northeast from Fairbanks to Circle. Those corridors are prominent on the eastern side of the map, but they do not form a road grid across the entire census area.
That contrast matters when interpreting community locations. Galena, Nulato, Kaltag, Huslia, Allakaket, and Fort Yukon are all clearly labeled, yet they do not appear as stops along one continuous numbered highway. Straight separation on the page therefore should not be treated as driving distance. For a regional report or classroom map, it is more useful to describe which communities lie in the western, central, eastern, or southern parts of the census area and then note where the major road corridors actually appear.
The outline itself is also irregular. The western and southwestern sides step through several angular boundary changes, while the eastern side includes a broad projecting section and a deep indentation farther south. Nearby labels place the census area between regions such as North Slope Borough, Northwest Arctic Borough, Nome Census Area, Bethel Census Area, Matanuska-Susitna Borough, and Southeast Fairbanks Census Area. This map is excellent for regional orientation, but it is not a parcel or legal-survey product. Current Census Bureau TIGER/Line geography should be used when an authoritative statistical boundary is required.
Six ranked cities show how dispersed the population centers are
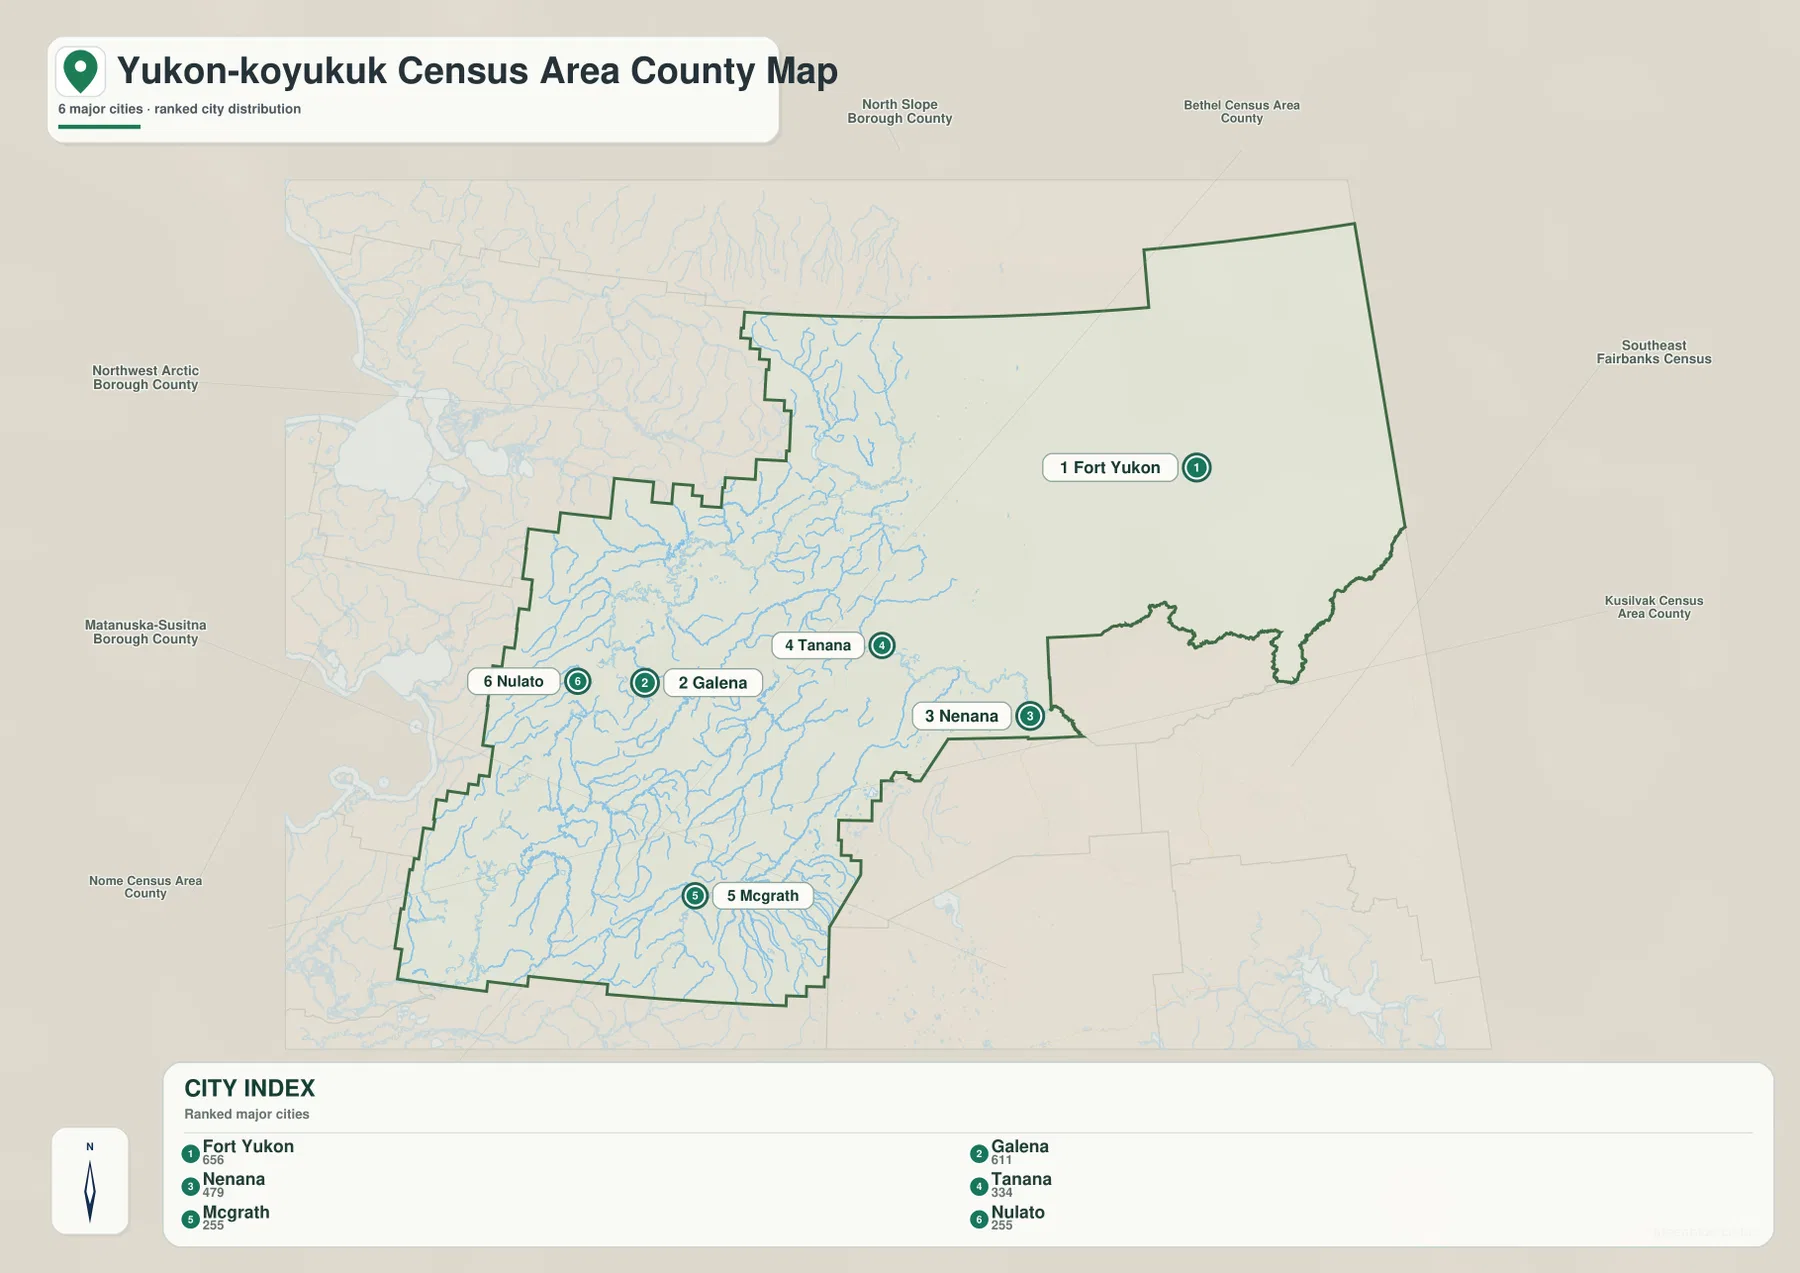
The city map narrows the view to six places in its CITY INDEX: Fort Yukon, Galena, Nenana, Tanana, McGrath, and Nulato. Their numbered markers are spread across nearly the full width and much of the height of the census area. Fort Yukon stands by itself in the east. Galena and Nulato are both in the western part of the map, Tanana is closer to the center, Nenana sits near the southeastern boundary, and McGrath is far to the south. The distribution is useful because it makes the absence of a single dominant urban cluster immediately visible.
Galena and Nulato appear relatively close to one another compared with the distance to Fort Yukon or McGrath, but even that visual relationship should be read as regional orientation rather than a travel-time estimate. Nenana has a different transportation setting because the Parks Highway passes near it, while several other indexed places are not shown on the same continuous highway system. A presentation about settlement geography can use this map to compare direction and separation without implying that all six cities are connected in the same way.
The six indexed places are not the complete set of communities shown in the package. The general map also labels Allakaket, Huslia, Kaltag, Grayling, Anvik, Holy Cross, Lake Minchumina, and Central, among others. In other words, the ranked version is a selected city layer, not a comprehensive settlement inventory. Use the general map when the goal is to see the broader network of named places, and use the city map when the goal is to compare the six highlighted cities quickly.
Small numeric values also appear in the city index, but this article does not treat those values as a current population series because the map package does not identify their reference year in the image itself. For current demographic figures, the Census Bureau’s QuickFacts or data.census.gov profile is the better source. The city map remains valuable without that interpretation: its main job is to show where the highlighted cities sit inside a very large county-equivalent.
Melozitna, Nowitna, Innoko, and Iditarod rivers fill the interior map
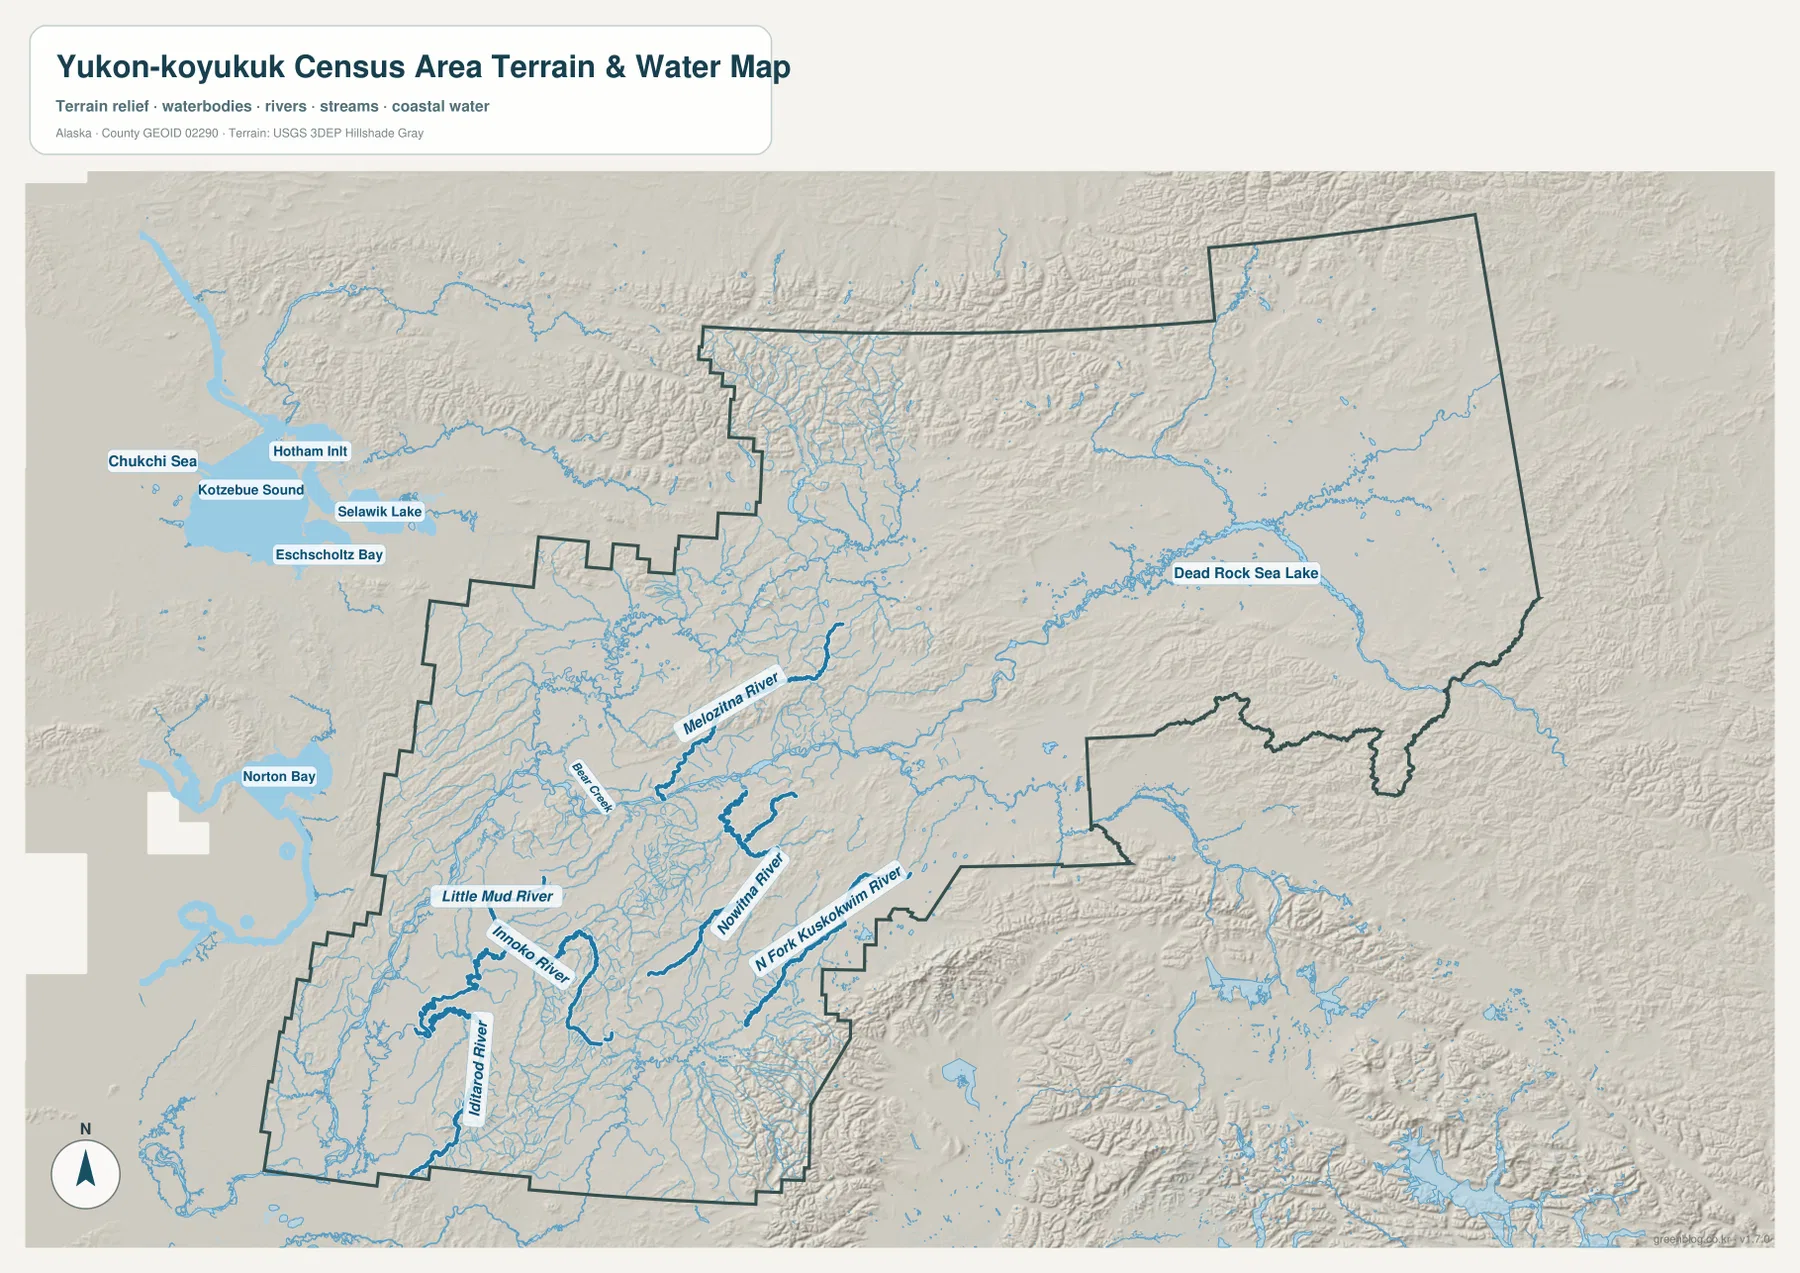
The terrain-and-water map changes the emphasis completely. Roads become secondary while branching streams and major rivers dominate the view. Melozitna River is labeled in the west-central interior, and farther south the map identifies Nowitna River, Innoko River, and Iditarod River. Near the McGrath side of the census area, North Fork Kuskokwim River is another strong reference line. Dead Rock Sea Lake appears in the eastern interior, giving the reader a fixed landmark in an otherwise very broad network of drainage channels.
Shaded relief adds another layer of information. The northern and eastern portions show more pronounced mountain texture, while broad river valleys and lower-looking terrain occupy large parts of the central and southern interior. Tributaries repeatedly branch from the main channels, especially around the Melozitna, Innoko, and Iditarod systems. This visual pattern helps explain why a road-only map would leave out much of the geography that shapes the census area.
The map also labels large water features outside or near the western edge of the census-area boundary, including Kotzebue Sound, Selawik Lake, Eschscholtz Bay, and Norton Bay. Those names are best used as regional reference points rather than assumed to be contained within the census area. When identifying a river or lake that belongs to the mapped county-equivalent, follow the green boundary first. The surrounding water labels are useful for placing this vast Interior region in relation to western Alaska.
BLM’s Central Yukon Field Office describes much of its management area in terms of rural communities along the Yukon and Koyukuk rivers and the Dalton Highway corridor. That official description fits the broad pattern visible here: river systems organize much of the interior landscape, while one major highway corridor cuts north through only part of it. The supplied water map is still a general geographic reference, not a navigation chart, flood-hazard map, or engineering survey. It does not provide water depth, current, flood probability, channel condition, or legal ownership information.
Which map works best for roads, settlements, or river geography
Start with the general map when the question is “Where is this place in the census area?” It includes many more community labels than the ranked city version and shows the major numbered highways at the same time. That makes it the strongest choice for comparing Fort Yukon with Galena, locating McGrath relative to the northern settlements, or showing how the Dalton, Elliott, Steese, and Parks highway corridors occupy only a limited part of the total area.
Choose the ranked city map when the six highlighted cities are the subject. Fort Yukon, Galena, Nenana, Tanana, McGrath, and Nulato can be found quickly without competing with every other settlement label. The wide spacing between those markers is itself useful information for a presentation or classroom handout. If the discussion includes Allakaket, Huslia, Kaltag, Holy Cross, Central, or other communities outside the city index, pair it with the general map rather than forcing the city version to do a job it was not designed for.
Use the terrain-and-water map when river basins and landform are more important than administrative labels. It is the clearest supplied image for finding Melozitna River, Nowitna River, Innoko River, Iditarod River, North Fork Kuskokwim River, and Dead Rock Sea Lake. The relief background also gives a better sense of where mountain terrain rises around the drainage network. For technical hydrology, navigation, flood analysis, or land-status work, however, specialized current data should supplement this general reference.
For printing or close inspection, use the original JPG files rather than relying only on the smaller WebP previews embedded in the article. The download archive contains three high-resolution JPG maps: the boundary-and-settlement map, the ranked city distribution, and the terrain-and-water map. Each original image is 3638 by 2572 pixels, which makes labels and boundary details easier to inspect on a desktop screen or in a printed handout.
Frequently Asked Questions
Why is Yukon-Koyukuk called a census area instead of a borough?
Alaska uses census areas as statistical county equivalents in the portion of the state outside organized boroughs. Yukon-Koyukuk is one of those statistical areas rather than a borough government of its own. Its boundary is therefore important for Census Bureau geography and data reporting, but it should not be interpreted as the jurisdiction of a separate organized borough government.
Why does the city map show only Fort Yukon, Galena, Nenana, Tanana, McGrath, and Nulato?
The supplied city map is a ranked layer that highlights six cities; it is not a complete list of every community in the census area. The general map also labels places such as Allakaket, Huslia, Kaltag, Grayling, Anvik, Holy Cross, Lake Minchumina, and Central. Use the general map for the broader settlement picture and the ranked map for a quick comparison of the six highlighted cities.
Can the terrain-and-water map be used for river navigation or flood decisions?
No. It is a geographic reference for relative locations of rivers, lakes, drainage networks, and terrain. It does not contain the depth, current, channel, flood-probability, evacuation, or engineering information required for safety decisions. Use current USGS and other purpose-specific official products for navigation, flood work, or technical hydrology.
Map File Information
The archive contains the Yukon-Koyukuk Census Area boundary-and-settlement map, ranked city map, and terrain-and-water map as original high-resolution JPG files.
- Included Files: 3 JPG maps
- Printable Size: 3638×2572 pixels each
- Intended Use: Printing, education, presentations, and regional map comparison
Related Maps
Sources and references
- U.S. Census Bureau QuickFacts – Yukon-Koyukuk Census Area: official population and land-area statistics for the census area
- U.S. Census Bureau TIGER/Line Shapefiles: authoritative county-equivalent boundary and geographic reference data
- Alaska Department of Labor – Yukon-Koyukuk Census Area Map: state reference map for communities, highways, and census geography
- Alaska DOT&PF – Interior Alaska Transportation Plan: official background for the Dalton, Elliott, Steese, and Parks highway systems
- Bureau of Land Management – Central Yukon Field Office: official description of the Yukon and Koyukuk river region and Dalton Highway corridor
- USGS National Hydrography: official reference for rivers, streams, lakes, and hydrographic data
Green Map creates custom-edited map images using open geographic data sources such as geoBoundaries, Natural Earth, OpenStreetMap, and government open data.
These maps are edited visual materials, not raw data files, and are provided for education, documents, presentations, and graphic reference.