Kusilvak Census Area stretches across a broad part of western Alaska where coastal water, branching river channels, and widely separated communities dominate the supplied maps. Kotlik appears near the northwestern side, Emmonak and Alakanuk sit farther down the coastal river network, St. Mary’s and Pilot Station are inland along the lower Yukon system, and Hooper Bay lies much farther southwest near the Bering Sea. This page uses only the places and water features visible in the provided map set. Larger JPG versions of the same map subjects are available in the downloadable ZIP near the end of the article.
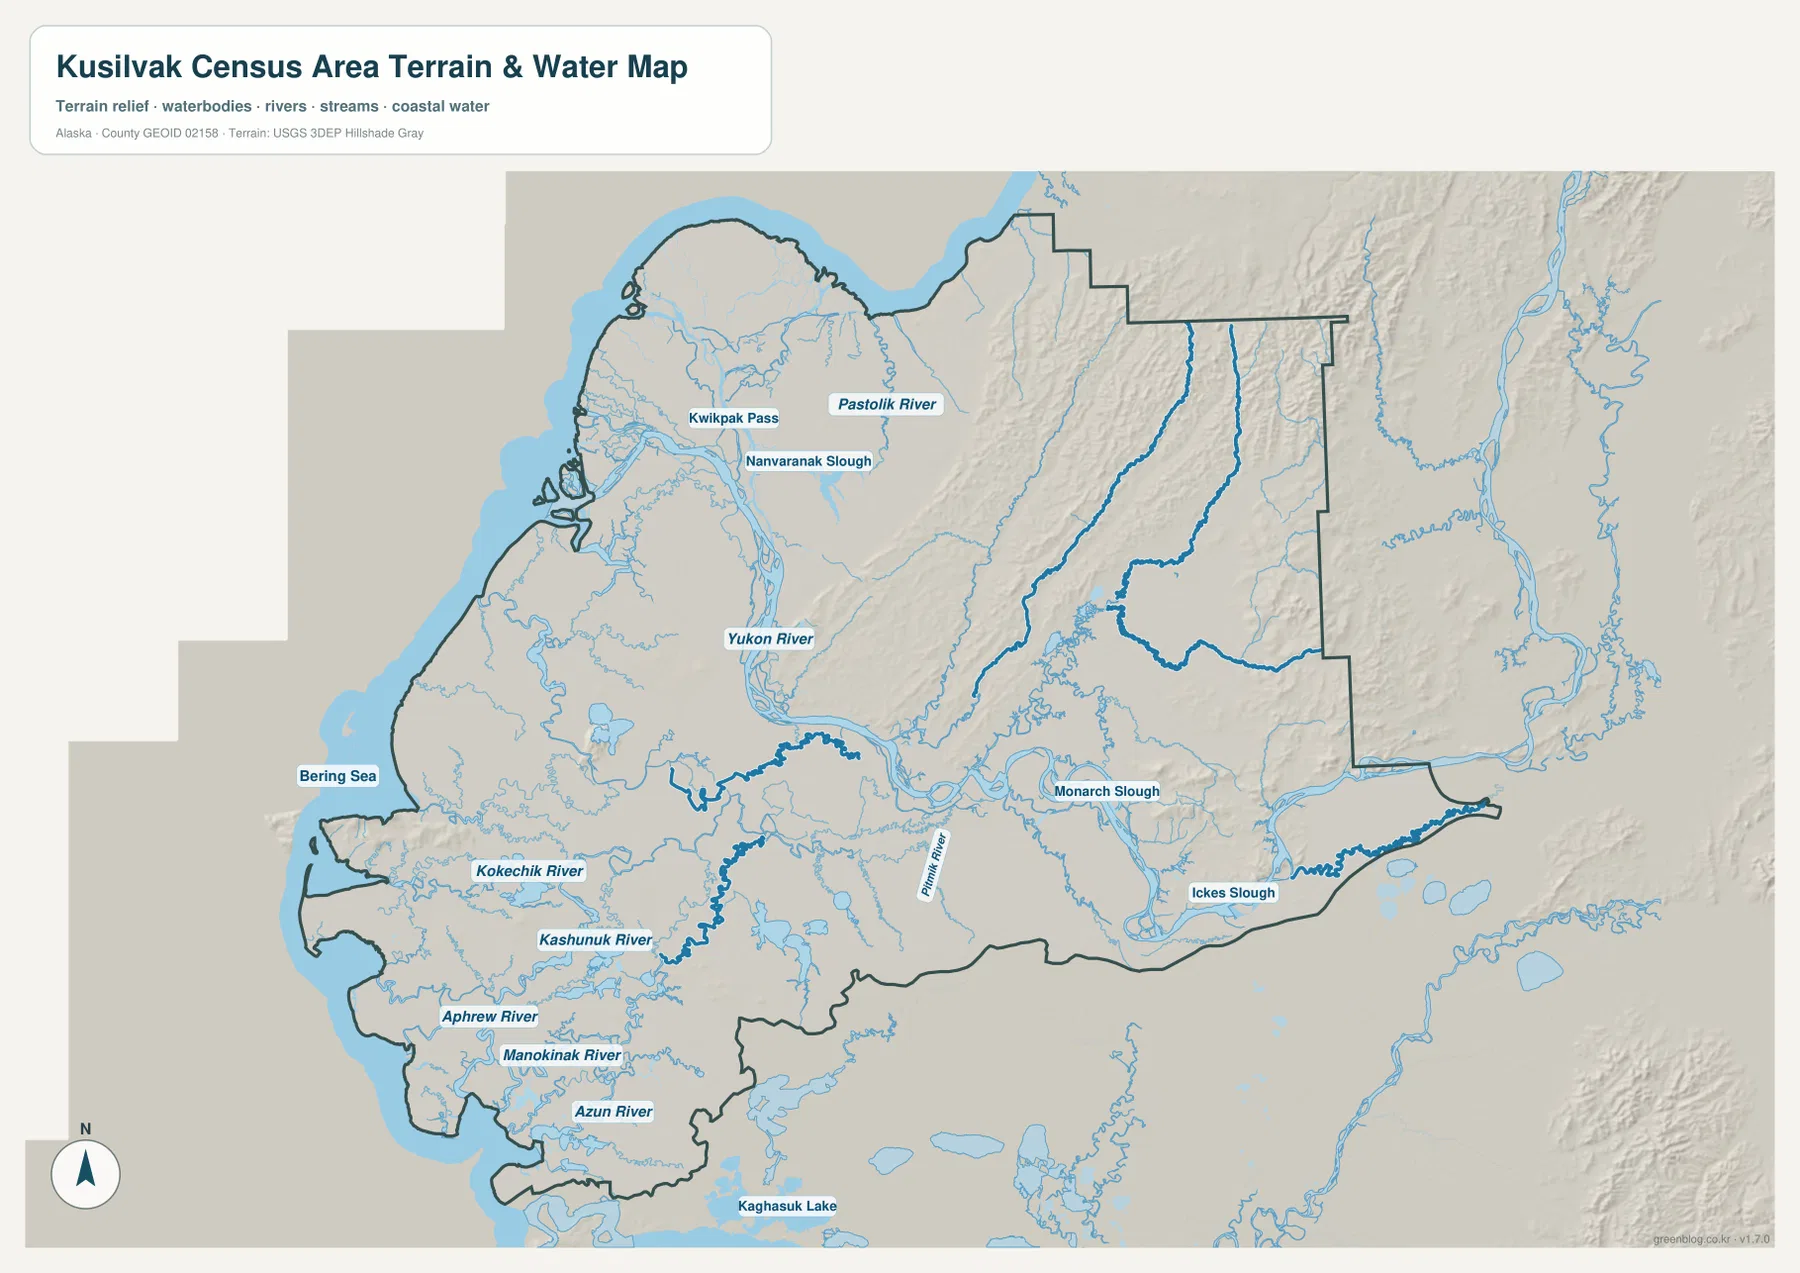
A useful way to approach the area is to start with the waterways rather than assume that communities are connected by one obvious road corridor. The terrain-and-water sheet labels the Yukon River, Pastolik River, Kwikpak Pass, Nanvaranak Slough, Kokechik River, Kashunuk River, Aphrew River, Manokinak River, Azun River, Monarch Slough, Ickes Slough, and the Bering Sea. The western half is cut by many channels and small lakes, while shaded relief becomes more apparent toward the eastern side. That contrast gives the map a very different appearance from a compact inland county.
Table of Contents
Use the lower Yukon as the first landmark
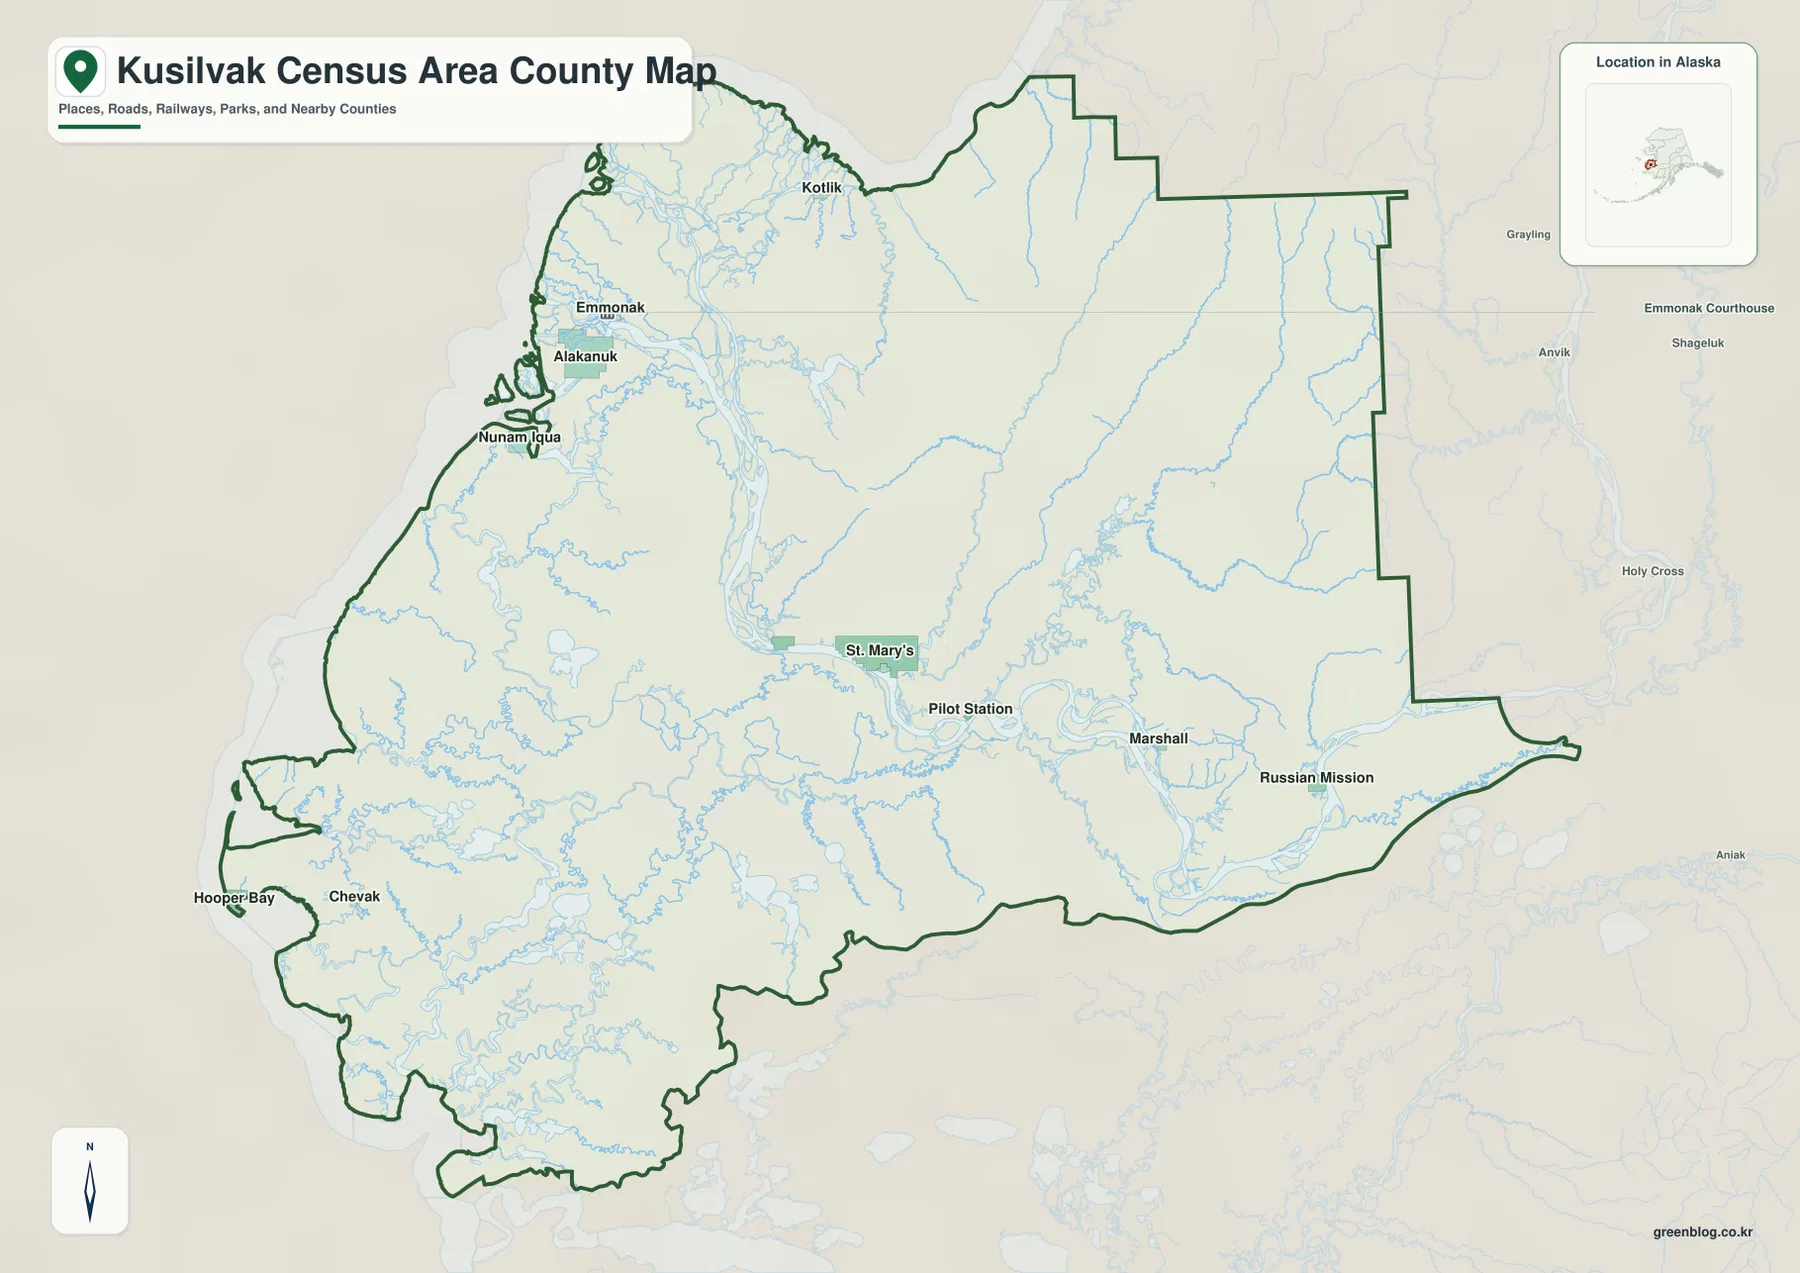
The general map becomes easier to follow once the Yukon River is used as a reference line. St. Mary’s is shown near a broad bend in the river system, with Pilot Station to the southeast and Marshall and Russian Mission farther east. Moving toward the northwest coast, Emmonak and Alakanuk appear among a much denser group of branching waterways, while Kotlik sits farther north. These locations are not arranged as a single chain of towns, so following the river and then locating each community is more useful than scanning the entire map at once.
Hooper Bay and Chevak form a different southwestern reference area. They are well removed from the communities around Emmonak and St. Mary’s, and the land between them is crossed by numerous small channels and lakes. The map is therefore useful for relative position and regional orientation, but it does not show a complete transportation network or seasonal travel conditions. Straight visual distance on this sheet should not be treated as a road or travel distance.
Northern coastal communities and the southwestern edge on the general map
Kotlik, Emmonak, Alakanuk, and Nunam Iqua occupy the northwestern side of the general map. Their labels appear relatively close together, but the background shows that the surrounding ground is divided by many waterways. Emmonak and Alakanuk in particular sit beside a complicated river-and-channel area rather than one simple shoreline. This part of the map is a good place to see how the census-area boundary meets the coastal lowlands.
Farther south, Hooper Bay is close to the western edge and Chevak is slightly inland. The eastern boundary looks less fragmented than the coast, and several labels outside Kusilvak Census Area—such as Grayling, Anvik, Shageluk, and Holy Cross—help establish which side of the boundary is inside the census area. Those neighboring labels are useful for orientation but should not be confused with communities within Kusilvak itself.
What the six-city index adds to the map
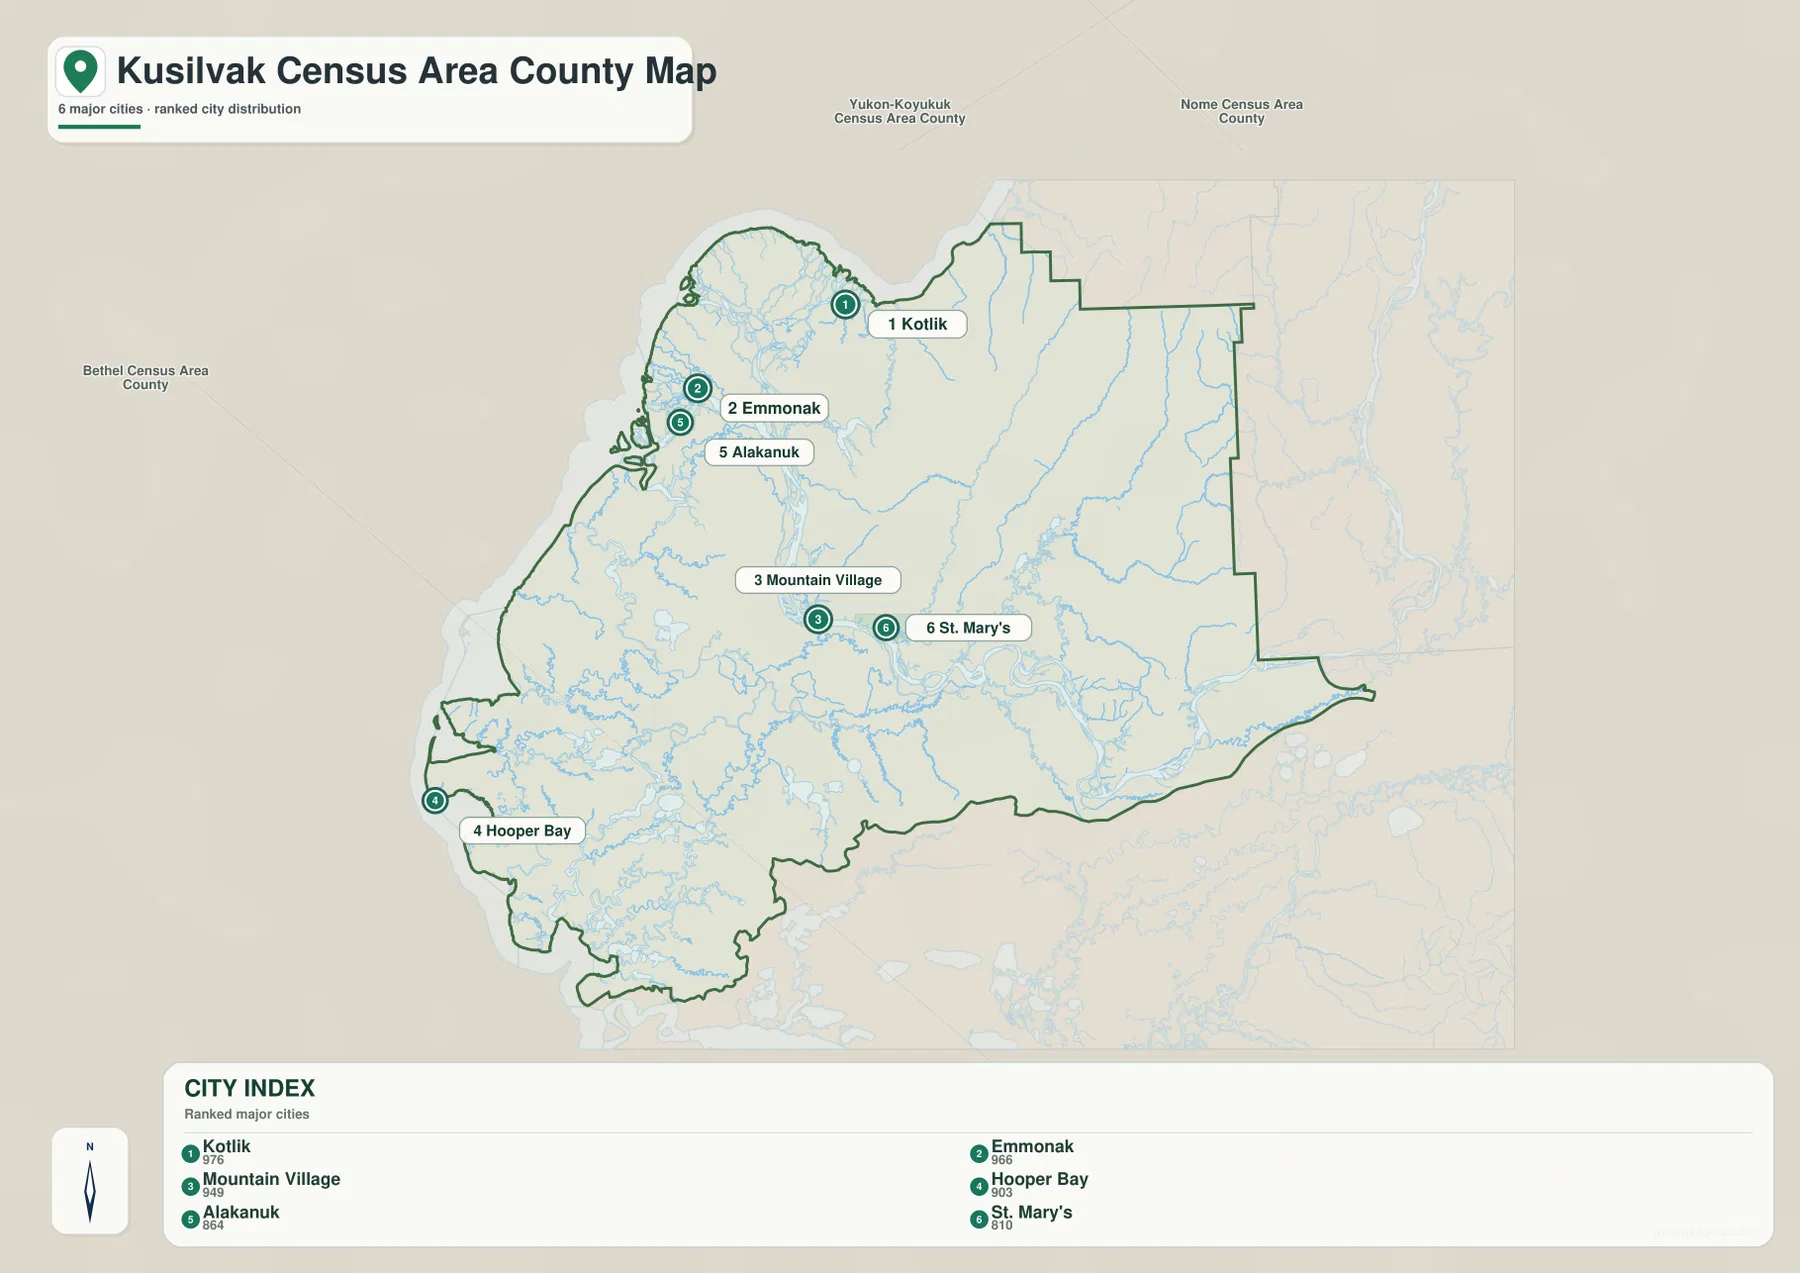
The city-index sheet simplifies the area by highlighting six ranked locations: Kotlik, Emmonak, Mountain Village, Hooper Bay, Alakanuk, and St. Mary’s. Kotlik, Emmonak, and Alakanuk form a northwestern cluster on the page. Mountain Village and St. Mary’s sit farther inland toward the lower Yukon, while Hooper Bay is isolated well to the southwest. Even without every smaller community label, the six markers make the large geographic spread immediately visible.
The CITY INDEX printed on the supplied map shows 976 for Kotlik, 966 for Emmonak, 949 for Mountain Village, 903 for Hooper Bay, 864 for Alakanuk, and 810 for St. Mary’s. These values are reproduced only as information visible in the supplied image; this article does not assign them a survey year or treat them as current population estimates. Readers who need current demographic figures should use the latest Census data. For map reading, the more important point is where the six markers sit in relation to one another.
The index is not a complete settlement inventory. The general map also labels Nunam Iqua, Chevak, Pilot Station, Marshall, and Russian Mission, among others. Using both sheets prevents the simplified six-city view from being mistaken for a full list of communities. The index is especially useful when a classroom handout or presentation needs fewer labels and a cleaner comparison.
Yukon River channels, Kwikpak Pass, and Nanvaranak Slough
The water sheet gives the central and northwestern part of the census area much more detail. The Yukon River is prominently labeled, and its lower reaches are accompanied by Kwikpak Pass and Nanvaranak Slough near the northwest. Pastolik River appears farther north. When Emmonak and Alakanuk are located first on the general map and then compared with this water sheet, the dense network of channels around that part of the coast becomes much easier to understand.
Monarch Slough and Ickes Slough are labeled farther southeast, adding another set of branching waterways away from the northwestern cluster. This is a reference map of water features and broad terrain, not a navigation chart. It does not provide depth, current speed, channel condition, ice information, or a guarantee of navigability. Detailed hydrographic work should be checked against an appropriate official source such as USGS National Hydrography.
Bering Sea coast and the rivers south of the Yukon
The western and southwestern side has its own set of named rivers. Kokechik River, Kashunuk River, Aphrew River, Manokinak River, and Azun River are all labeled inland from the Bering Sea. Numerous smaller unnamed channels and lakes fill the spaces between them. Hooper Bay and Chevak can be located on the general map first, then the water sheet can be used to see the dense coastal drainage around the same part of Kusilvak.
Kaghasuk Lake is also labeled near the southern part of the water map. Together with the river names and the coastal water, it reinforces how strongly the western side is shaped by water on this map. The sheet should not be used as a flood-hazard map, wetland legal boundary, parcel map, or nautical chart. Its purpose here is to show the relative position of major labeled rivers, sloughs, lakes, and coastal water.
Broad terrain contrast from the western channel country to the east
Shaded relief is subdued across much of the western channel country and becomes more pronounced toward the eastern side of the map. That visual contrast separates the broad coastal and lower-river landscape from terrain with more obvious height variation. No precise contour values or spot elevations are supplied, so the image cannot be used to determine exact elevation or slope. It is best treated as a broad terrain reference that complements the named water features.
The pattern is also useful when comparing settlements. Many of the labeled communities on the general map are on the western or central side near major waterways, while the eastern interior carries fewer settlement labels. The maps alone do not explain why people live where they do, and this article does not infer historical or transportation causes that are not supplied. What can be stated directly is where the communities, boundary, waterways, and shaded terrain appear relative to one another.
Choose the map that matches the question
The general sheet is the best starting point when the task is to identify the census-area outline and a broad set of community names. The city-index sheet is cleaner when the goal is to compare six principal locations without the full set of labels. The terrain-and-water sheet adds the Yukon River, sloughs, coastal rivers, the Bering Sea, and broad relief. Moving between the maps is more useful than expecting one image to answer every geographic question.
For example, a reader comparing Emmonak and St. Mary’s can locate both on the general map and then use the city index to see their different positions within the wider area. Someone interested in Hooper Bay can begin with the general map, then move to the water sheet to examine the Bering Sea side and nearby Kokechik and Kashunuk rivers. This two-step method keeps place names and water features connected without crowding them into a single view.
- For the census-area outline and many settlement labels: start with the general map.
- For a clean comparison of six highlighted communities: use the city-index map.
- For the Yukon River, sloughs, coastal rivers, and broad relief: use the terrain-and-water map.
- For legal boundaries, current demographics, detailed hydrography, or exact elevation: consult the appropriate official dataset.
High-resolution files for printing and reference
The WebP images in the article are optimized for viewing on the page. The ZIP below contains three larger JPG originals covering the same subjects: the general census-area map, the city-index map, and the terrain-and-water map. They are useful for printed reference, classroom materials, presentations, and personal geographic study when a larger image is preferable to the web version.
Even at full resolution, these are reference graphics rather than authoritative documents for surveying, legal boundaries, flood decisions, marine navigation, or engineering. When a task depends on exact geometry, water data, or elevation, the corresponding Census or USGS dataset should be consulted directly.
Frequently Asked Questions
Where are Kotlik and Hooper Bay on the map?
Kotlik is shown on the northwestern side near the coastal river network, while Hooper Bay is much farther southwest near the Bering Sea edge. Both the general map and the city-index map make the separation easy to see, with a broad expanse of waterways and lowland between them.
Which map best shows the lower Yukon waterways?
The terrain-and-water sheet is the better choice for that question. It labels the Yukon River together with Kwikpak Pass, Nanvaranak Slough, Pastolik River, Monarch Slough, and Ickes Slough. The sheet is useful for relative position, but detailed depth, flow, or navigation information requires a separate official hydrographic source.
What is included in the downloadable ZIP?
The archive contains three high-resolution JPG files corresponding to the article’s general census-area map, city-index map, and terrain-and-water map. They work well as larger visual references for print, classroom, and presentation use, while decisions about legal boundaries, navigation, flooding, or engineering require the appropriate official data.
Map File Information
The Kusilvak Census Area maps used in this article are available as high-resolution JPG files. The download package contains three larger JPG originals: one for the full census-area map, one for the six-place city index, and one for terrain and water.
- Included Files: 3 high-resolution JPG images
- File Type: JPG files in one ZIP archive
Related Maps
Sources and further reference
Official administrative boundary files are available from the U.S. Census Bureau TIGER/Line Shapefiles. More detailed river and water information can be checked through USGS National Hydrography, and precise elevation datasets are available through the USGS 3D Elevation Program. The descriptions on this page are grounded in the supplied Kusilvak Census Area maps and asset manifest.
Green Map creates custom-edited map images using open geographic data sources such as geoBoundaries, Natural Earth, OpenStreetMap, and government open data.
These maps are edited visual materials, not raw data files, and are provided for education, documents, presentations, and graphic reference.