Forest is the defining surface in Brown County in the supplied 2025 data. It covers 83.36% of the county, while agriculture accounts for 7.29% and developed land for 6.39%. This Brown County Indiana Land Cover Map set makes that contrast easy to see: broad wooded areas dominate the county, Nashville forms a small developed center, and the northeast contains a distinctive mix of water and development around the Cordry-Sweetwater lakes.
The page includes a 2025 land-cover overview, a forest-and-farmland view, an impervious-surface map, and a 1985–2025 class-difference comparison. The WebP images are provided for quick viewing, while the four original 2480 × 1754-pixel JPG maps are available together in one ZIP for county profiles, environmental lessons, presentations, and side-by-side reference work.
Table of Contents
An 83.36% forest share leaves only small openings for farms and settlements
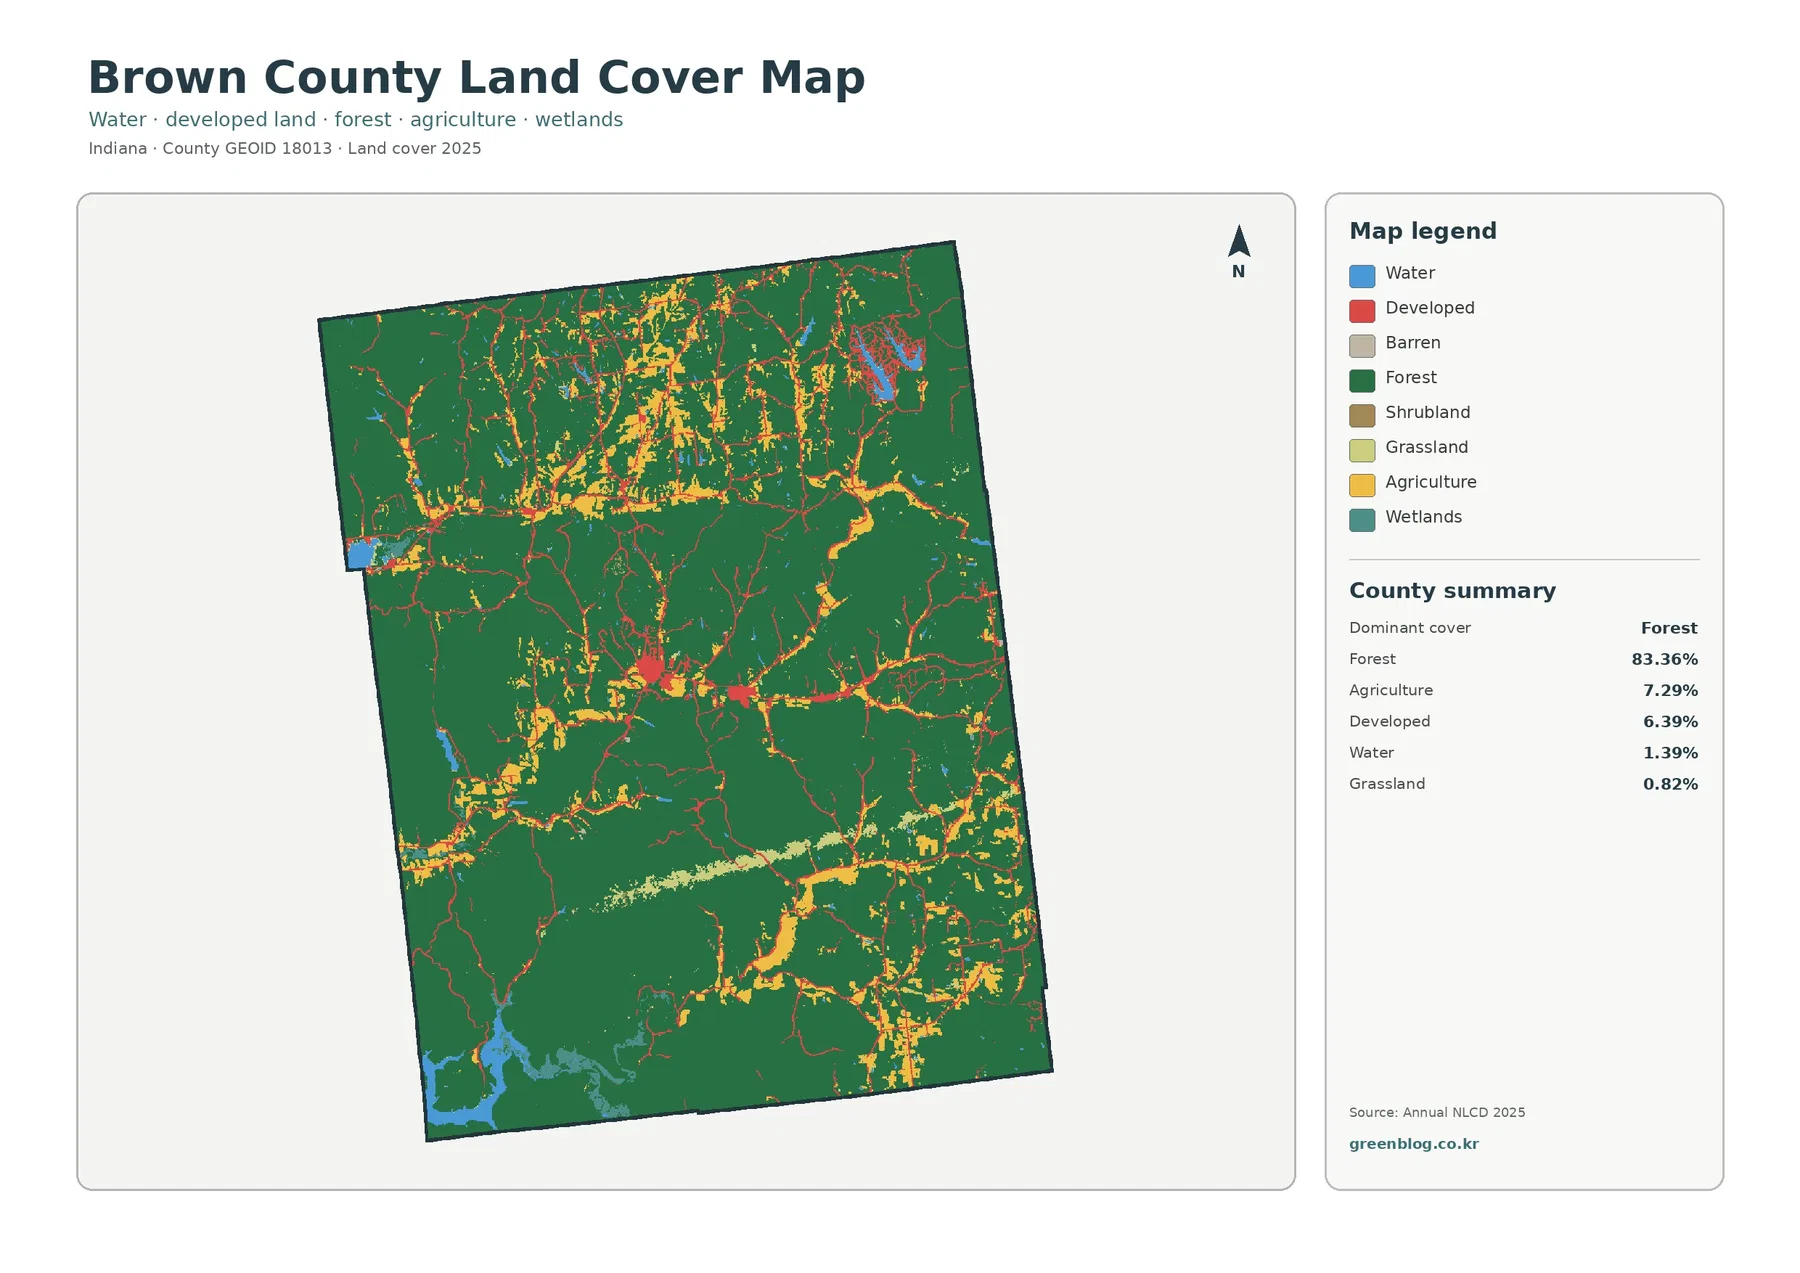
Dark green covers most of the county footprint. The summary gives forest 83.36%, a share large enough that every other class appears mainly as openings, lines, or clusters inside a wooded county. Agriculture is 7.29% and is most noticeable in the north, along parts of the east, and in several southeastern openings. Developed land reaches 6.39%, but it does not form a broad urban block. Much of it follows narrow lines and small settlement concentrations.
Water occupies 1.39%. The northeast contains a conspicuous group of blue water bodies surrounded by a denser developed pattern, while another larger water area touches the southwestern side of the county. Grassland is 0.82%, wetlands 0.64%, and shrubland 0.08% in the supplied summaries. Those smaller classes matter when reading local edges, but none changes the overall picture of a heavily forested county with limited farm and built surfaces.
Land cover is a classification of what the ground surface appears to be in imagery. It is not a zoning map, a property map, or a statement about what a parcel may be used for. A developed cell can include lawns, trees, soil, and other permeable surfaces around buildings. A forest cell does not identify ownership, timber rights, or management status. Parcel, permit, and zoning questions require current local records rather than a county-scale raster map.
Nashville and the northeast lake district stand out inside a largely wooded county
The clearest central developed cluster sits where Nashville is located. Brown County government, the county Planning Department, and Purdue Extension all use Nashville addresses, and local planning material treats the town separately from the surrounding unincorporated county. That makes Nashville a useful geographic reference for the central red concentration. The preview does not contain a municipal boundary, however, so the edge of the red cells should not be treated as the legal town limit.
A different pattern appears in the northeast. The Cordry-Sweetwater Conservancy District describes itself as being in the northeast corner of Brown County and manages Cordry Lake and Sweetwater Lake. The map shows a matching combination of blue water and closely spaced developed surfaces in that corner. This is one of the few places where water and development form a strong local cluster against the county’s forest background. Individual homes, docks, private roads, and lots still require more detailed mapping.
Brown County’s official road page lists State Roads 45, 46, and 135 within the county. Thin developed traces on the land-cover map often resemble transportation lines, especially near the central settlement and several outer corridors, but the preview carries no route labels. It is better to compare these traces with an official road map before naming them. Used together, the two map types answer different questions: land cover shows the surface pattern, while the road map identifies the transportation network.
The forest-and-farmland view makes northern and eastern openings easier to separate
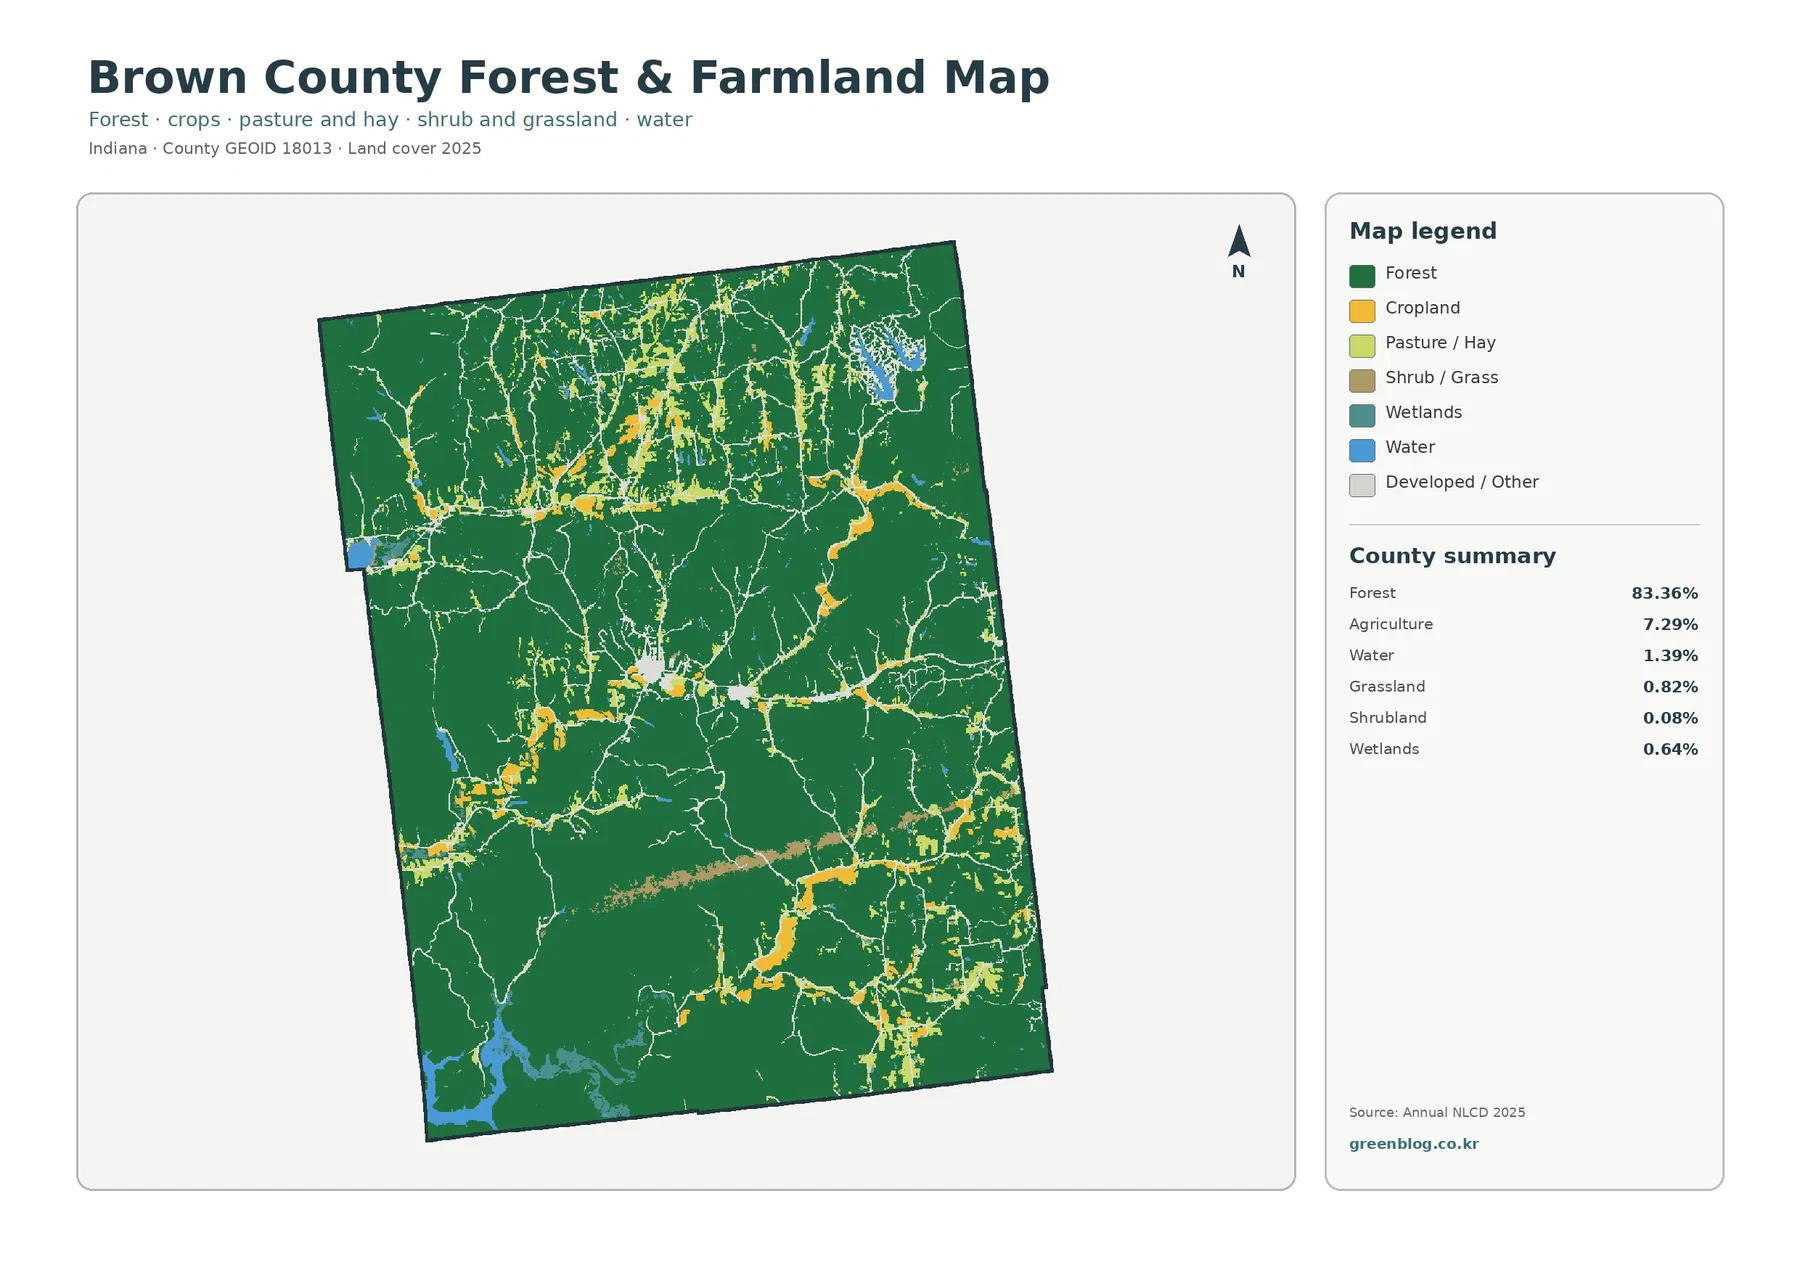
Removing most of the developed color makes the 83.36% forest share even more apparent. Cropland appears in broken yellow patches rather than a continuous farm belt. Larger pieces occur in the north and parts of the east and southeast, with smaller openings elsewhere. Around Nashville, pale developed surfaces and agricultural openings interrupt the forest, but the surrounding green remains dominant. Farther south, the map returns to large forest blocks with only scattered breaks.
Indiana DNR describes Brown County State Park as nearly 16,000 acres of rugged hills, ridges, and ravines with extensive forest views. That official landscape description helps explain why a forest-heavy map is plausible for this part of Indiana. It does not mean every green cell belongs to the state park. The park boundary is not drawn on the supplied land-cover image, and the county also includes private woodland and other forested properties outside the park.
Purdue Extension Brown County provides agriculture and natural-resources services, including forestry information and links to professional foresters. That local emphasis fits a county where woodland is much more extensive than cropland. The 7.29% agriculture figure should not be stretched into a statement about crop production, farm income, or the number of farms. Those questions need agricultural statistics because the land-cover class records surface type rather than the business or crop occupying each field.
Smaller categories are easier to notice in this simplified view. Grassland is 0.82%, shrubland 0.08%, and wetlands 0.64%. Wetlands should not be merged with the 1.39% water class. Blue water generally represents exposed water surfaces, while wetland classes can include vegetation and saturated ground. In a county with several lakes and many wooded drainages, keeping those labels separate prevents a common reading error.
Mean impervious cover of 0.74% highlights how limited hard surfaces are
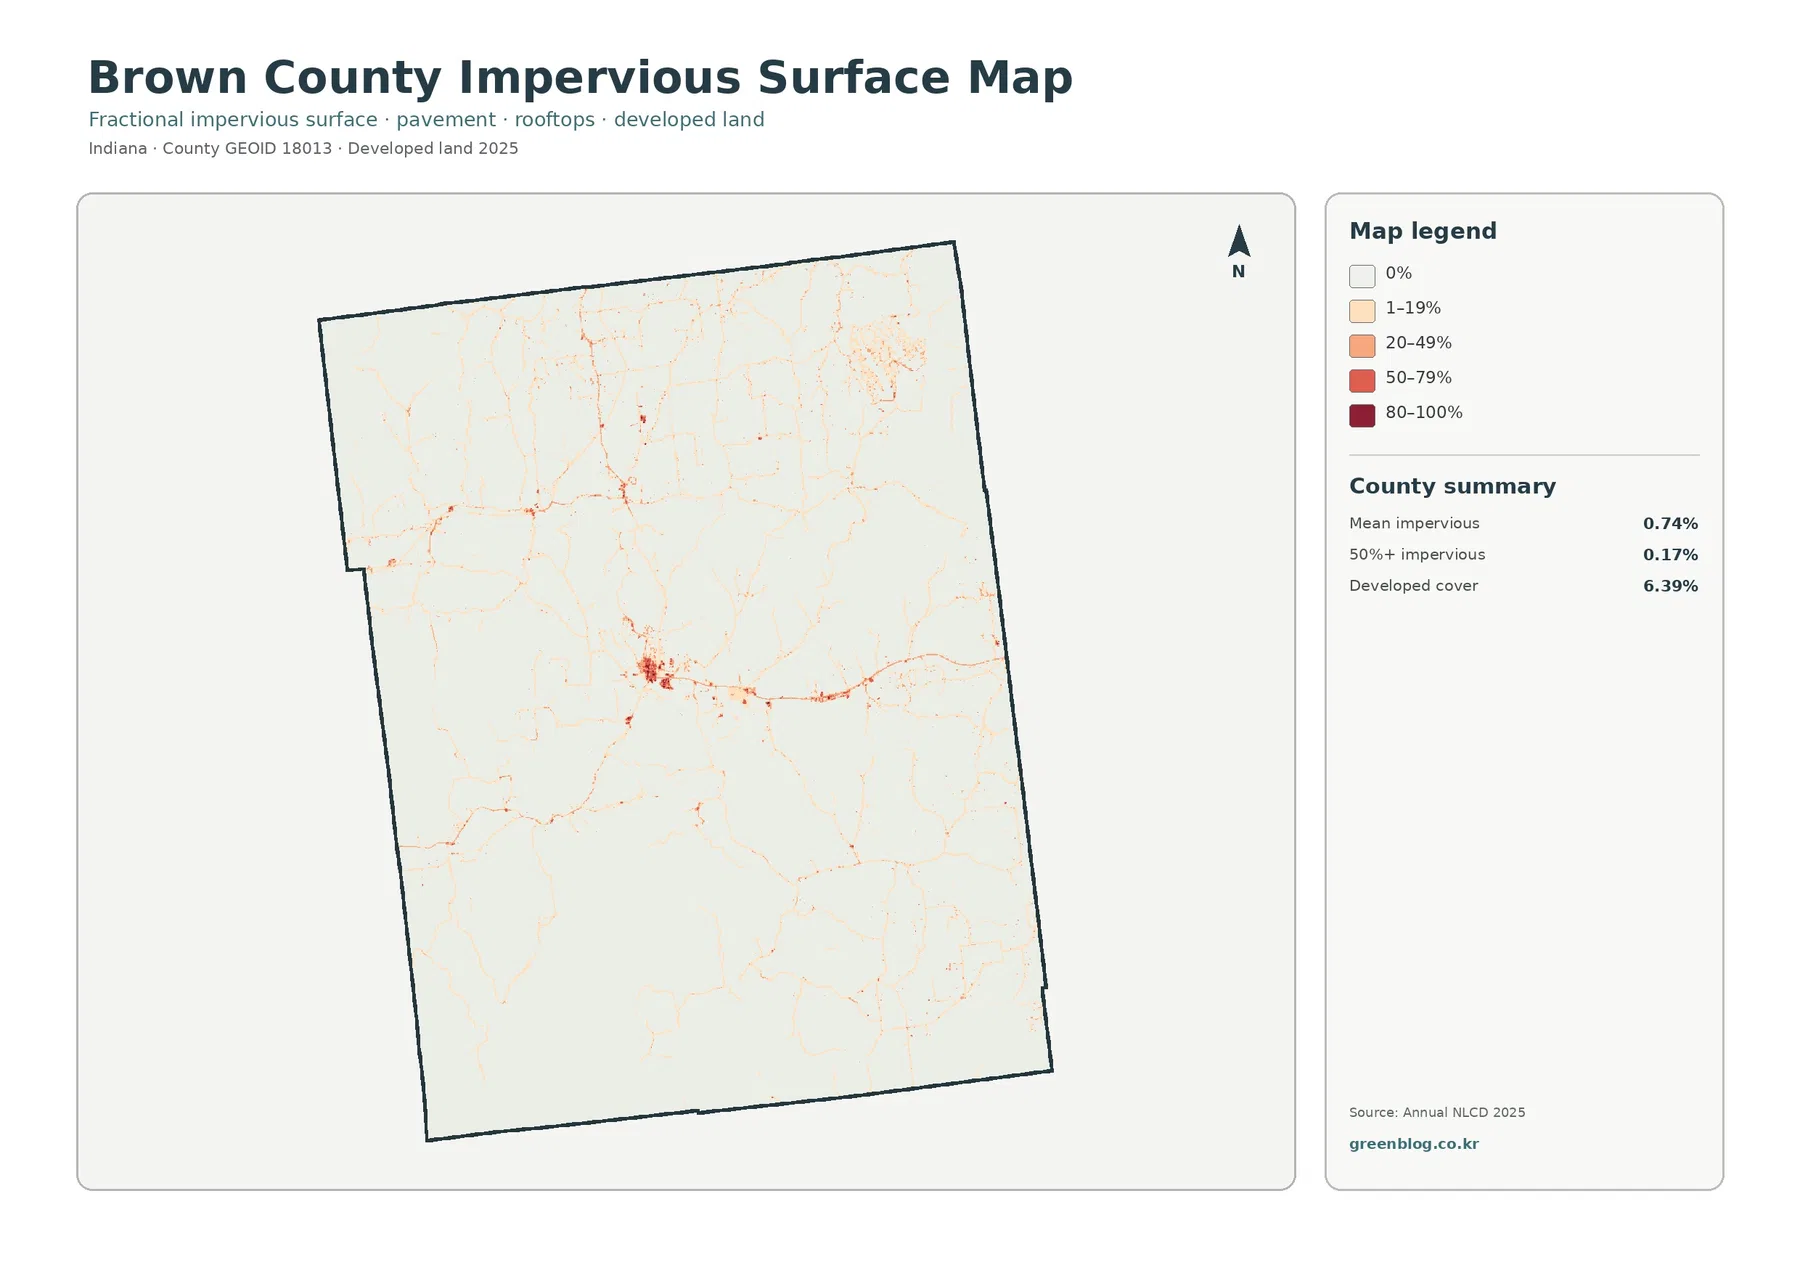
Impervious surface means roofs, pavement, parking areas, and other hard materials that do not readily absorb water. Brown County’s mean impervious cover is only 0.74%, and 0.17% of the county is mapped at 50% impervious or higher. Those numbers are much lower than the 6.39% developed-land share because developed classes can contain trees, lawns, bare soil, and other surfaces that still allow some infiltration.
Most of the impervious map is pale. The darkest concentration is around Nashville, with smaller lines and points extending along the local road network. Another group appears around the northeastern lake district. This distribution matters more than the countywide average alone. A mean of 0.74% combines places with concentrated pavement and rooftops with vast forest areas that have little or no impervious cover.
The layer can support an initial discussion of runoff or development intensity, but it is not a flood-risk map. Flooding depends on rainfall, slope, soils, drainage, stream channels, dams, and other factors that are not represented by the impervious percentage alone. Brown County’s Planning Department publishes floodplain and zoning material for regulatory questions. Those sources should be used directly when a decision involves a specific property or permit.
The 6.26% endpoint difference is a classification comparison, not a damage estimate
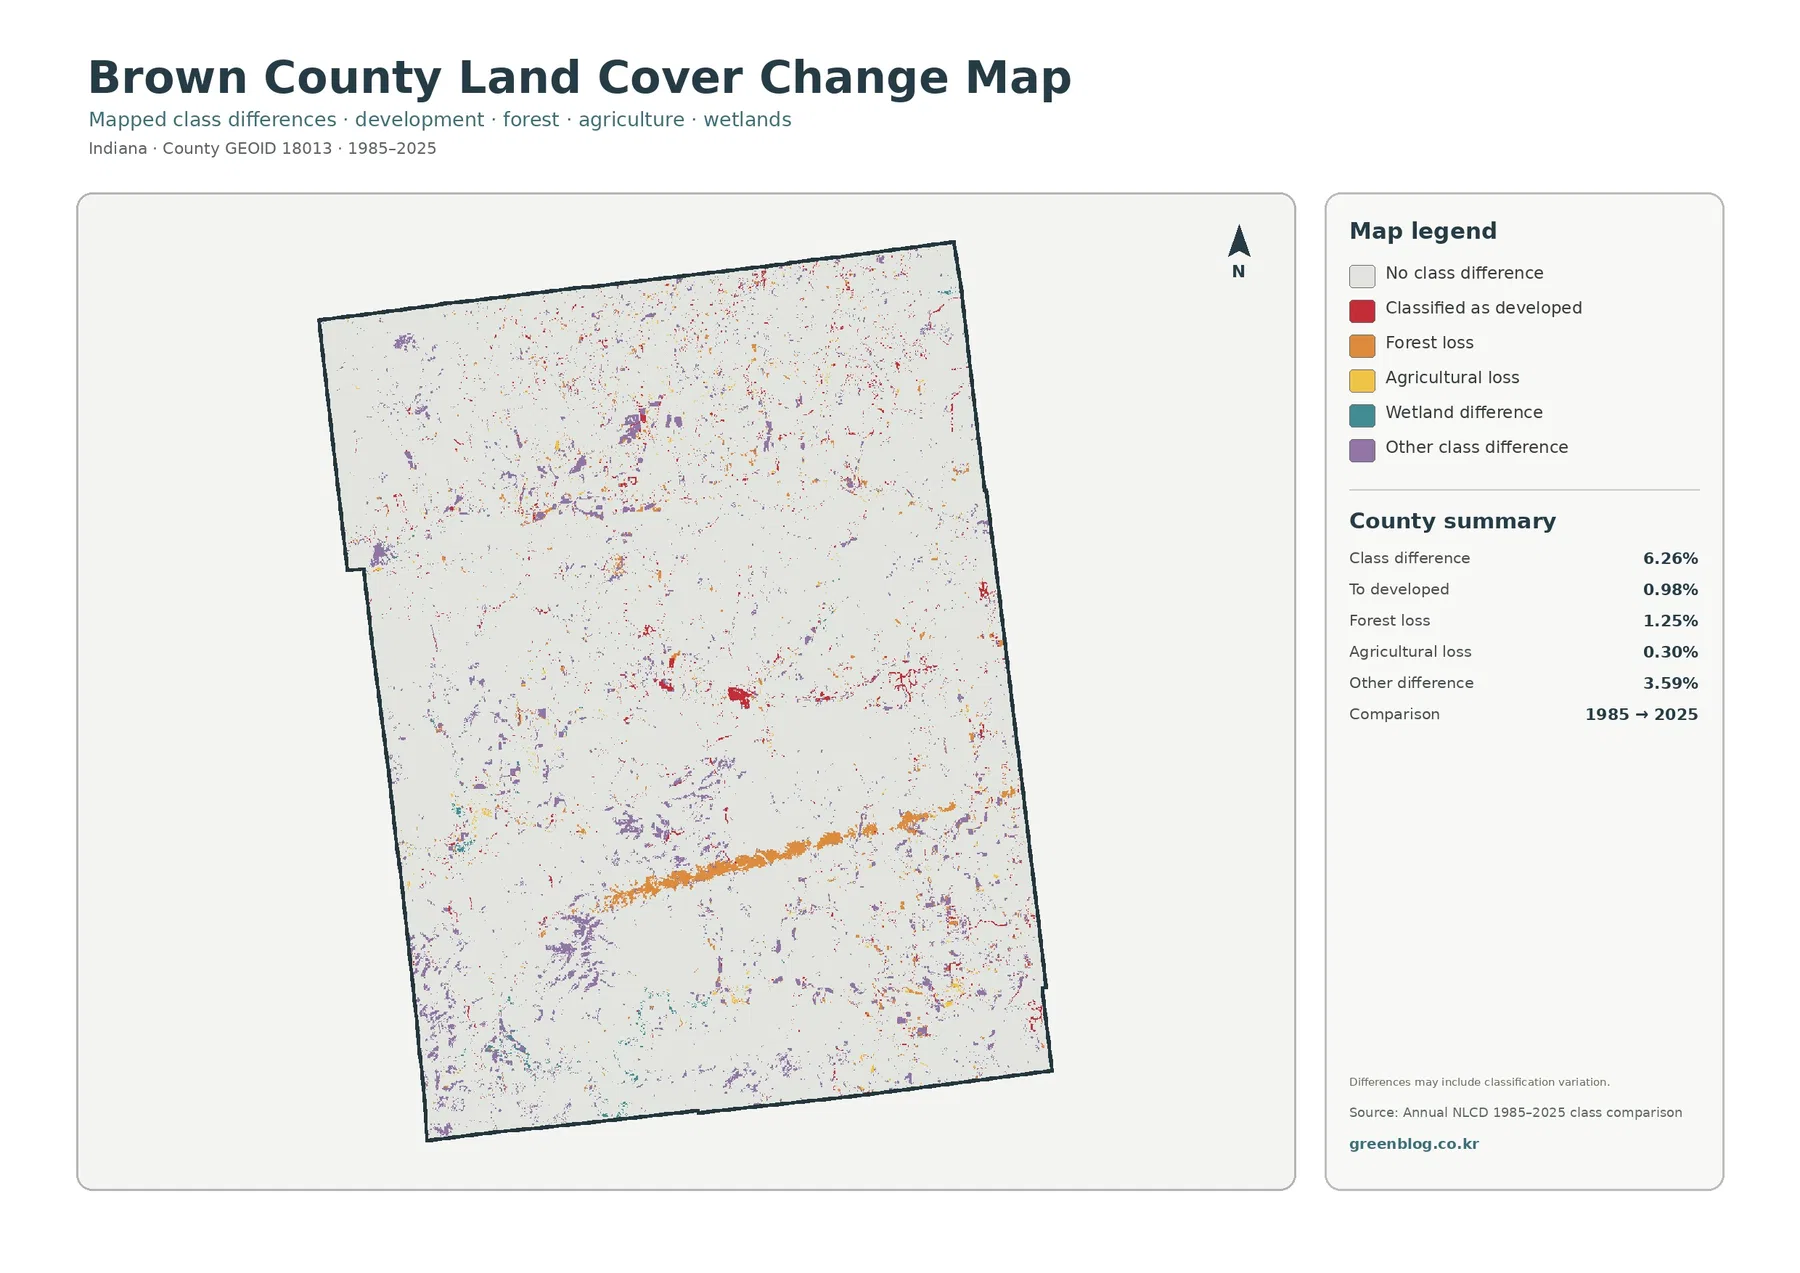
The supplied comparison reports 6.26% total class difference between 1985 and 2025. Listed components include 0.98% classified as developed, 1.25% forest loss, 0.30% agricultural loss, and 3.59% other difference. Wetland difference appears in the legend but does not have a separate percentage in the summary. A residual calculation should therefore not be presented as an official wetland-change value.
Red developed-conversion cells are noticeable around the Nashville area, in the northeast, and along several thin traces. Orange forest-loss cells are scattered across the county, with a more visible band in the southern half. Purple other-difference cells occur widely in the north, west, and south. The map is most useful when those local concentrations are considered together with the countywide 6.26% figure rather than when one bright patch is treated as the story for the entire county.
“Forest loss” has a narrow meaning here: a cell classified as forest in 1985 received another class in 2025. It does not by itself identify logging, construction, storm damage, vegetation succession, or classification error as the cause. The same caution applies to the 0.98% developed conversion. It does not record an exact construction year or every new building. Intermediate imagery, aerial photographs, permits, and planning records are needed to establish timing and cause.
Large areas remain in the no-class-difference category. That fact is easy to overlook because colored change cells draw attention even when they occupy a small fraction of the map. An endpoint comparison also misses temporary changes that occurred between 1985 and 2025 and then returned to the original class. For a continuous history, users would need intermediate annual products rather than this two-date summary alone.
Choosing the right map depends on whether the question is forest, development, or change
For a general Brown County profile, start with the 2025 overview because it puts forest, agriculture, development, and water on the same page. The forest-and-farmland version is better when the goal is to compare wooded land with the smaller agricultural openings in the north and east. The impervious layer is the clearest choice for Nashville, road-related hard surfaces, and the northeastern lake community. The change map belongs after the current-cover maps so its red and orange symbols are not mistaken for present-day land-cover classes.
Annual NLCD uses 30-meter raster cells. In ordinary language, that means the county is divided into square areas and each square receives a predominant class. A single cell may contain a forest edge, lawn, road, building, ditch, and small water feature, yet still be assigned one label. Enlarging the image does not restore parcel-level detail that was never part of the source resolution.
The current maps represent the supplied 2025 observation year. Later construction, forestry work, vegetation recovery, farming changes, or lake-shore alterations may not appear. The 1985–2025 image is also an endpoint comparison rather than a year-by-year record. Anyone using the maps for planning, property review, environmental permitting, or current infrastructure questions should check recent local records and higher-resolution imagery before making a decision.
Each downloadable JPG measures 2480 × 1754 pixels. The originals are convenient for archiving, class handouts, presentations, and county comparison graphics, but the package does not mark them as meeting an A3 high-resolution reference. Test a large print before relying on fine legend text. These are county-scale reference graphics, not survey, parcel, engineering, wetland-jurisdiction, or legal zoning products.
Frequently Asked Questions
Is Brown County really more than 80% forest in this map set?
Yes. The supplied 2025 summary lists forest at 83.36%, compared with 7.29% agriculture and 6.39% developed land. The figure is a countywide 30-meter land-cover classification, however, so it does not imply that every forest cell has the same owner, tree type, or management status.
What is the water-and-development cluster in northeastern Brown County?
The Cordry-Sweetwater Conservancy District says it occupies the northeast corner of Brown County and includes Cordry Lake and Sweetwater Lake. The mapped water and developed concentration matches that area well. Parcel boundaries, private roads, homes, and shoreline details still require district or county GIS data.
Does the 6.26% class difference mean 6.26% of Brown County was damaged?
No. It is the share of cells that received different land-cover classes at the 1985 and 2025 endpoints. Forest loss is listed separately at 1.25%, and even that label does not identify a cause. Intermediate imagery and local records are needed to distinguish development, forestry, natural change, and classification variation.
Sources and Reference Data
- MRLC Annual NLCD Data – official access point for annual land-cover and comparison products
- USGS Annual NLCD Land Cover Classification – definitions and guidance for forest, agriculture, wetlands, developed land, and related classes
- U.S. Census Bureau TIGER/Line Shapefiles – official county-boundary reference for Brown County
- Indiana DNR – Brown County State Park – official description of the county’s rugged hills, ridges, ravines, and extensive forest landscape
- Purdue Extension – Brown County – local agriculture, natural-resources, forestry, and wildlife information
- Brown County Planning Department – official comprehensive-plan, zoning, floodplain, and building information
- Cordry-Sweetwater Conservancy District – official background for Cordry Lake and Sweetwater Lake in northeastern Brown County
Map File Information
The ZIP contains four original JPG maps for comparing Brown County's forest-dominated 2025 cover, farm openings, Nashville and Cordry-Sweetwater hard surfaces, and 1985–2025 class differences.
- Included Files: Use only the versions confirmed in the article and supplied images
- File Type: Use the confirmed download contents
- Intended Use: Printing, education, presentations, and map-based projects
Related Maps
- Adams County Indiana Land Cover Map
- Allen County Indiana Land Cover Map
- Bartholomew County Indiana Land Cover Map
Green Map creates custom-edited map images using open geographic data sources such as geoBoundaries, Natural Earth, OpenStreetMap, and government open data.
These maps are edited visual materials, not raw data files, and are provided for education, documents, presentations, and graphic reference.