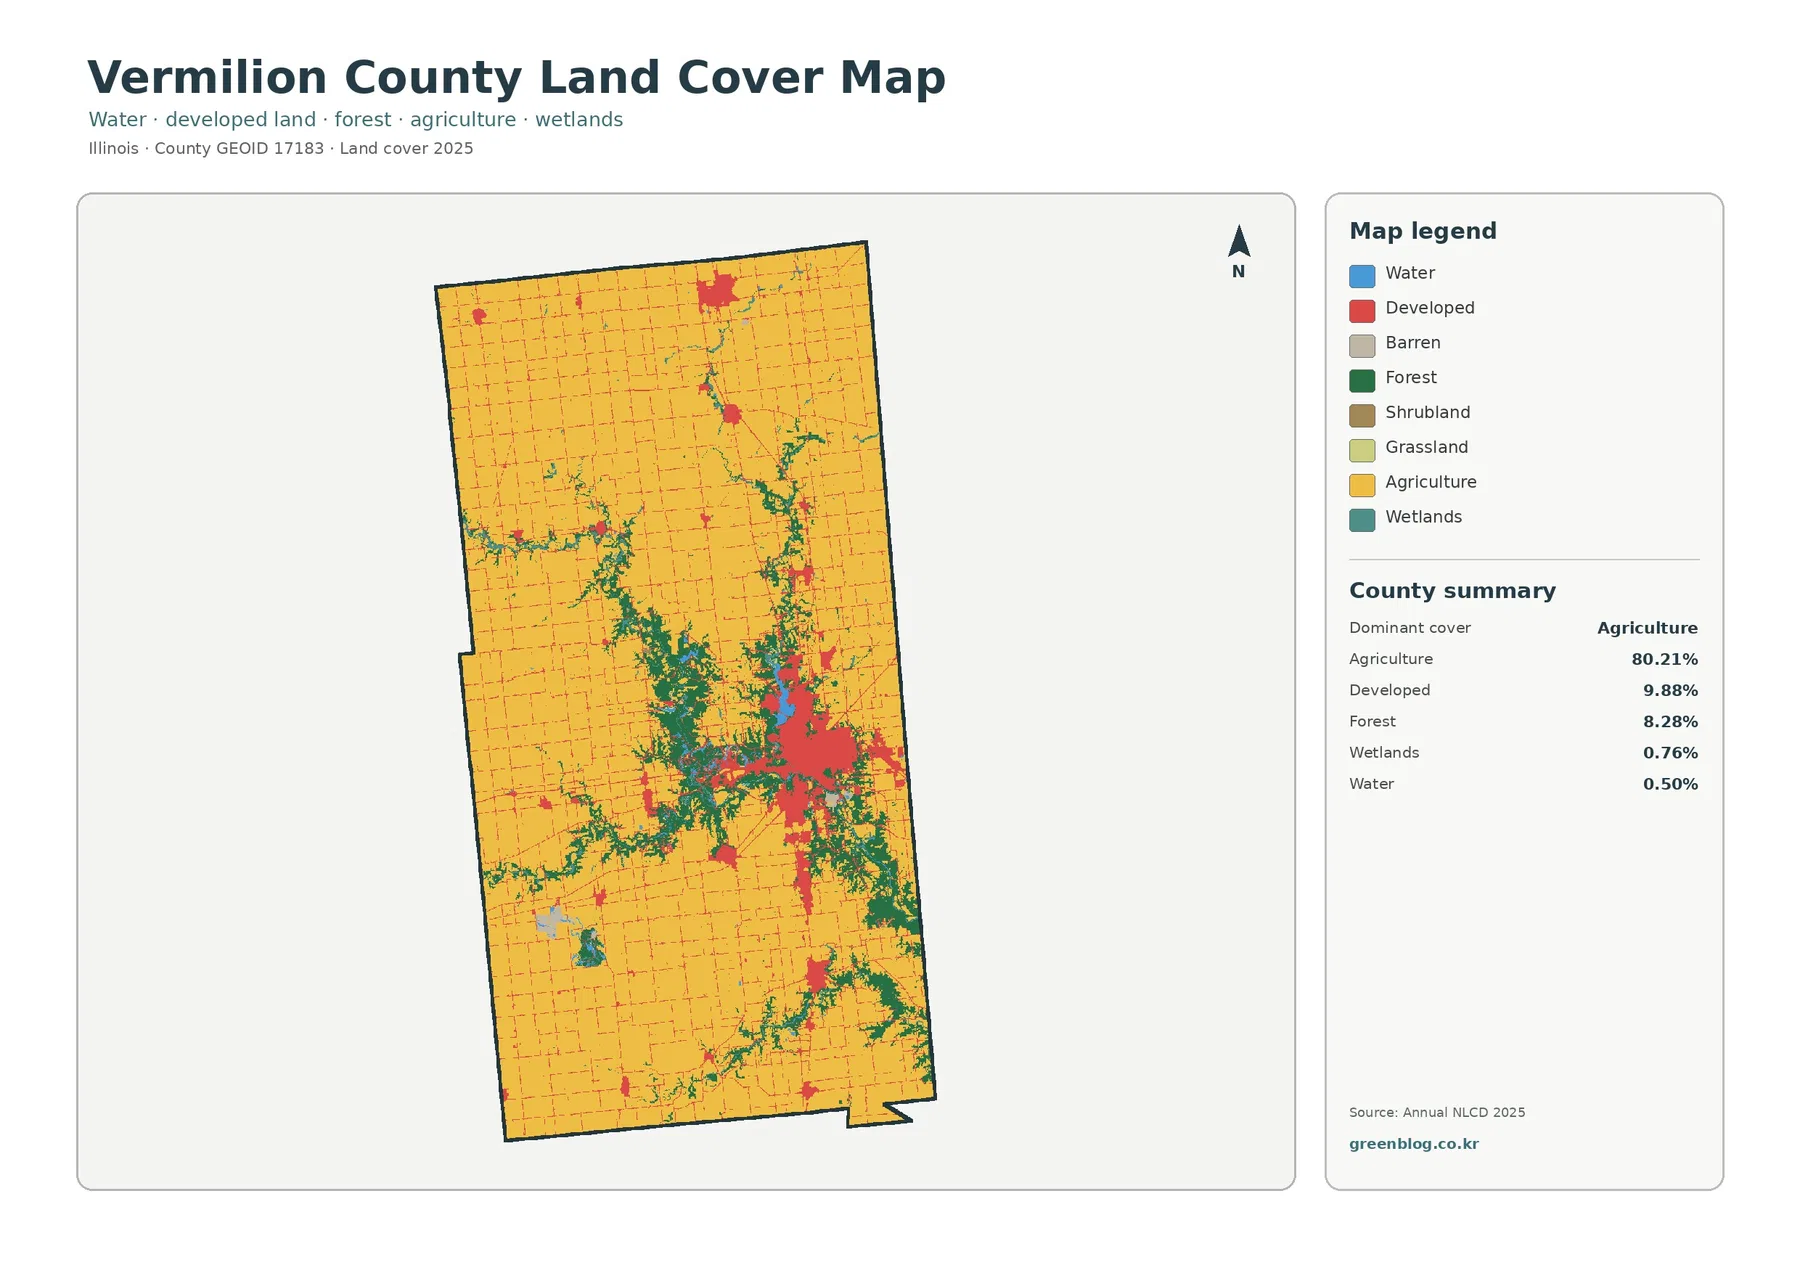
Vermilion County is overwhelmingly agricultural in the 2025 land-cover data, with agriculture accounting for 80.21% of the county. The pattern is not uniform, however. A large developed concentration around Danville breaks the farm landscape near the Indiana side of the county, while branching strips of forest and small water features run through the center and east. The four maps on this page separate those patterns so the farm matrix, wooded areas, hard surfaces, and long-term class differences can be examined without treating them as the same thing.
The page includes WebP previews for quick viewing and one download containing the four original JPG maps. They are useful for comparing agricultural cover with forest, locating the strongest developed and impervious concentrations, and identifying cells whose classification differs between 1985 and 2025. Land cover describes what is visible on the ground surface in the classified imagery. It is not a map of ownership, zoning, parcel boundaries, or legal land use.
Table of Contents
Danville creates the strongest break in a county otherwise dominated by farmland
The most obvious nonfarm feature is the large developed area in the east-central part of Vermilion County. The Vermilion County Conservation District identifies Danville as the county seat and notes that the county lies on the Indiana state line. That local geography matches the broad pattern in the map: the largest built-up cluster sits close to the eastern side, with smaller settlements scattered north, west, and south. Development does not fill the county evenly. It is concentrated in distinct town areas and thin road lines surrounded by much larger agricultural fields.
Developed cover totals 9.88%, making it the second-largest class after agriculture. Forest follows at 8.28%, while wetlands account for 0.76% and water 0.50%. Those percentages explain why the county can look strongly rural at a glance even though Danville produces a substantial urban patch. The map also shows that the developed area is not isolated from natural cover: forest and water occur close to the built cluster, and agricultural land begins again outside the denser developed zone.
The 80.21% agricultural share appears as broad, continuous fields across most of the county
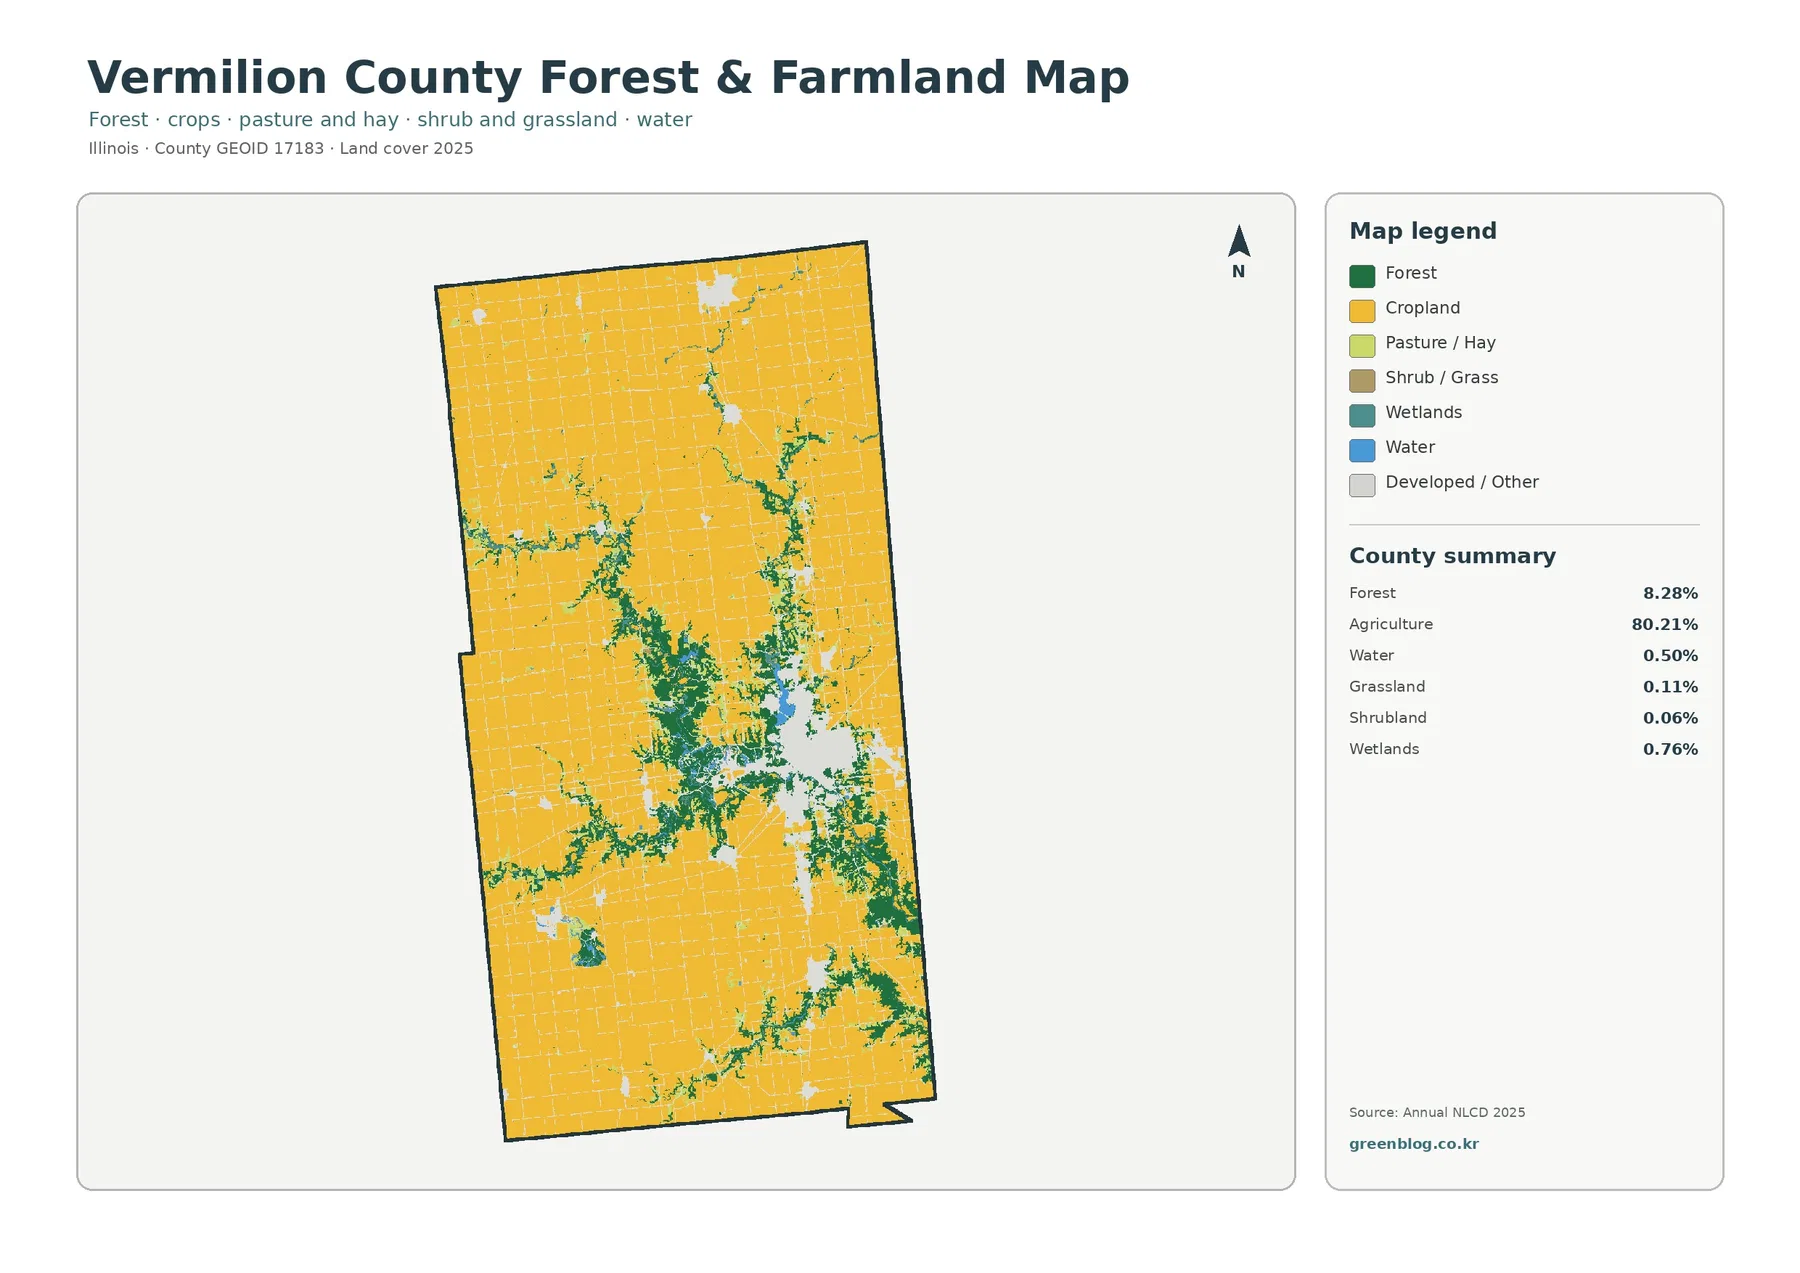
Agriculture is not limited to one corner of Vermilion County. It forms the background across the north, west, and south, with only the larger towns, wooded drainages, and water features interrupting it. The northern half is especially open, where farm cover extends over long distances and smaller settlements appear as isolated developed spots. Farther south, agriculture remains dominant but the forest pattern becomes more frequent, especially where green strips branch through the farm landscape.
The forest-and-farmland view is useful because it removes much of the visual competition from developed classes. With cropland shown broadly and forest emphasized in green, the county no longer reads as a simple block of farms. Wooded lines cut through the center, spread eastward toward the Danville area, and reappear in the south and west. Agriculture still controls the overall landscape, but the places where it is interrupted become easier to trace from one part of the county to another.
Woodland follows branching drainages instead of forming one large forest block
Forest covers 8.28% of the county, yet it has a strong visual presence because so much of it occurs in long, irregular shapes. The green pattern widens in several central locations and narrows into branches that extend through the surrounding farmland. These strips are especially noticeable around the middle and eastern portions of the county, where water, wetlands, development, and forest are more closely interwoven than in the broad agricultural north and west.
Local conservation information adds useful context without turning the land-cover classes into ownership boundaries. The Vermilion County Conservation District manages Forest Glen Preserve, Kennekuk County Park, Lake Vermilion County Park, and Heron County Park. Its nature-preserve descriptions include deep forested ravines at Forest Glen and protected areas along the Middle Fork River at Kennekuk. Those examples confirm that wooded ravines and river environments are part of the county landscape, but they do not mean every green pixel belongs to a park. Private woods and other forested land are classified the same way when the surface cover is similar.
Water and wetlands occupy little area but help explain some of the county’s most complex map patterns
Water and wetlands together account for only 1.26% of Vermilion County, so they are minor classes by area. Their locations matter more than their total share. Blue and teal patches occur near wooded areas in the center and east, including around the broader Danville landscape, while smaller features appear elsewhere in the county. Because these classes often sit next to forest, they help reveal where the otherwise broad agricultural pattern is broken into narrower and more irregular pieces.
Lake Vermilion and the Middle Fork River are examples of real water features recognized by the county conservation district, but the land-cover map is not a detailed hydrography layer. Narrow channels may be generalized within a 30-meter raster cell, and a small pond can be affected by its size, season, or neighboring vegetation. Use the map to understand where water and wetland cover occurs at county scale. A stream inventory, flood map, or watershed dataset is the better source when exact channel boundaries or flood risk is the question.
Impervious cover narrows the developed pattern to the places with more pavement and rooftops
Developed land and impervious surface are related but not interchangeable. Developed land can include lawns, scattered trees, and other permeable surfaces around buildings. Impervious surface focuses on harder surfaces where water does not readily soak into the ground, such as many rooftops, paved streets, and parking areas. Vermilion County has a mean impervious value of 2.80%, and 1.48% of the county is mapped above 50% impervious. Both values are far below the 9.88% developed share.
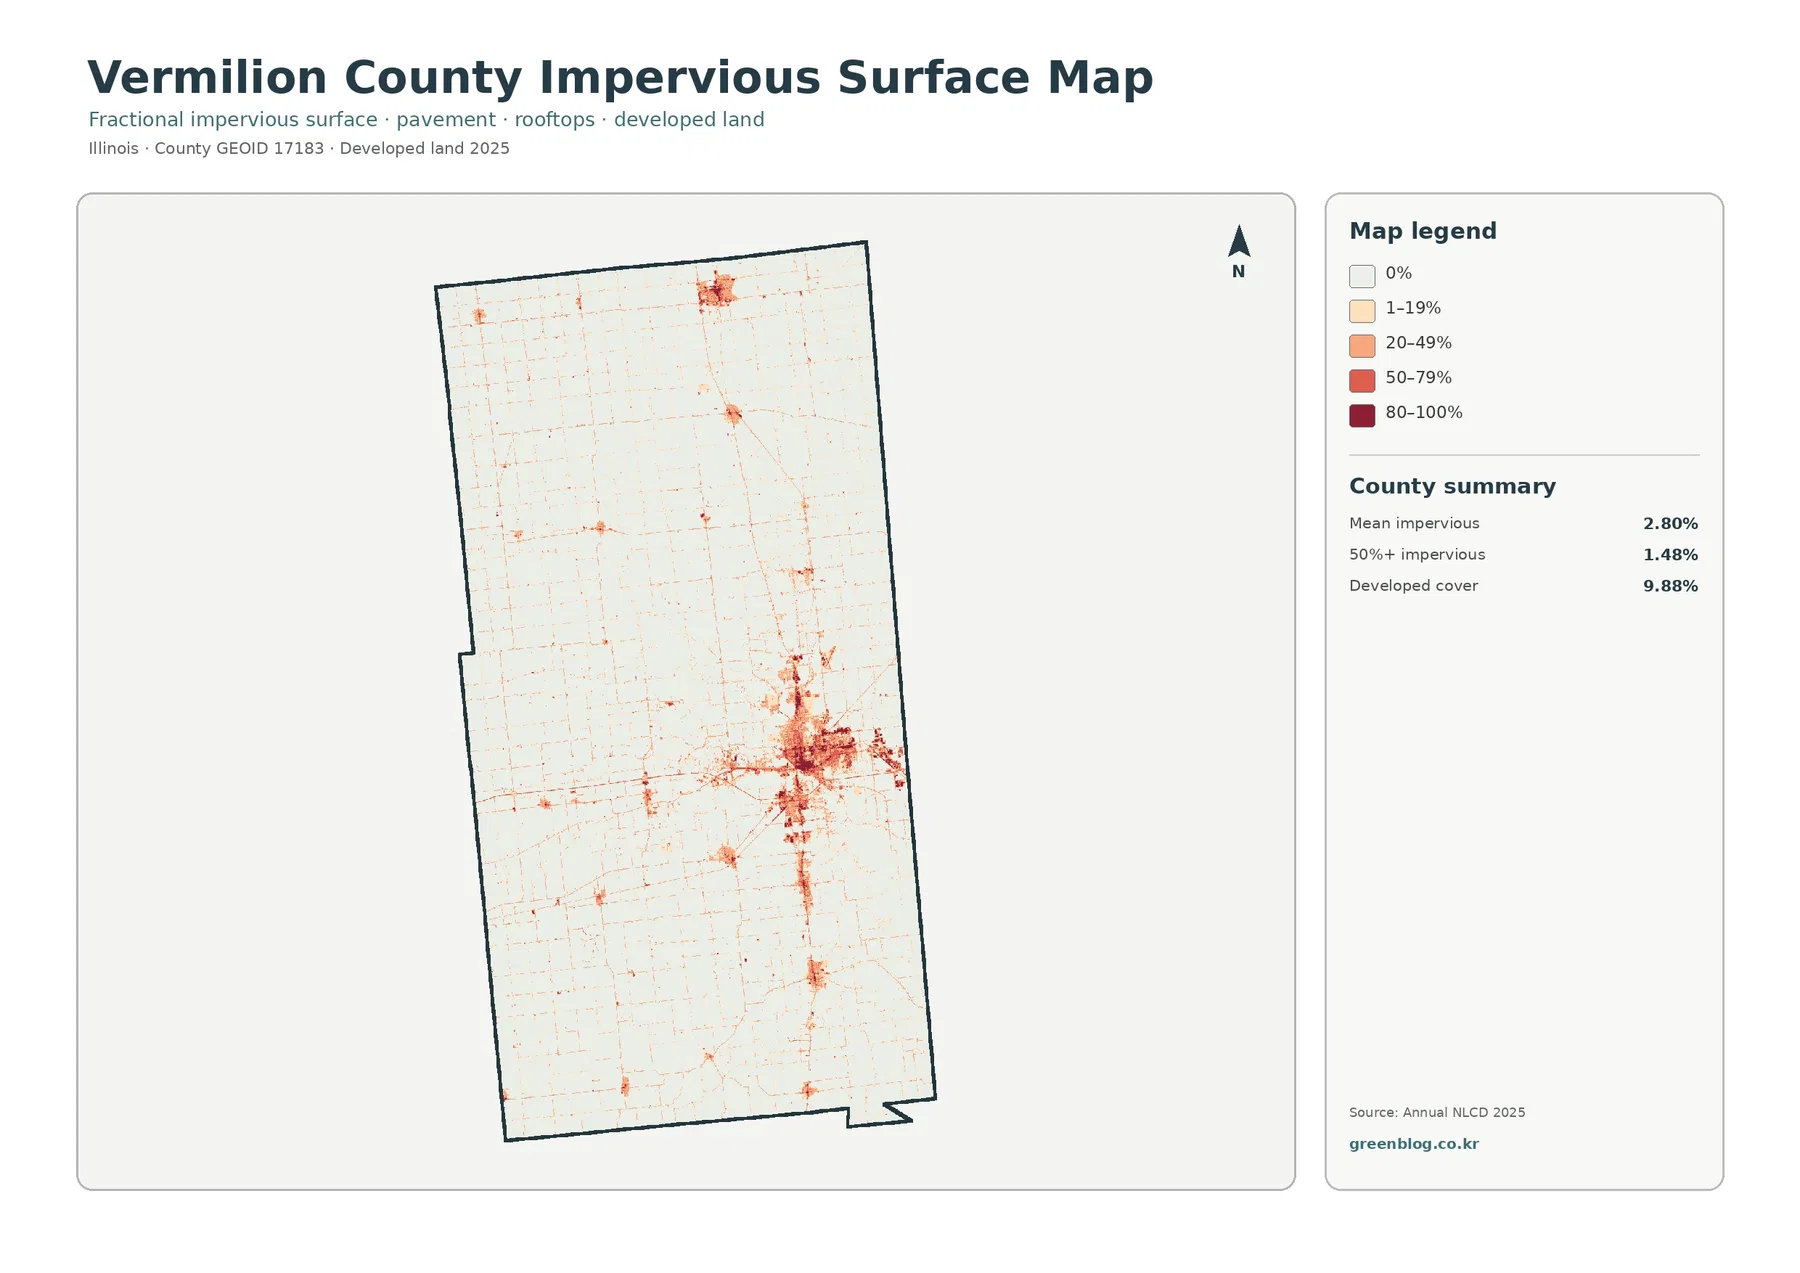
The Danville area is the strongest concentration on this map, with darker values forming a compact core and extending outward along developed routes. A separate northern town cluster is also visible, along with smaller points through the county. By contrast, most agricultural areas remain very pale. This difference is useful when a broad developed class is too general. A place can be mapped as developed without being mostly paved, while a downtown block or large parking area can produce a much higher impervious value within the same general urban landscape.
For stormwater or watershed background work, the impervious map helps identify where hard surfaces are concentrated, but it should not be used by itself to calculate drainage capacity or predict flooding. The map says where the surface is relatively impervious at the NLCD scale. It does not include local storm-sewer design, soil infiltration measurements, channel capacity, or current construction that occurred after the observation year.
Only 5.59% of cells differ between the 1985 and 2025 classifications
The land-cover change map reports a total class difference of 5.59% between 1985 and 2025. Within that summary, 1.04% is classified as a change to developed, 0.21% as forest loss, and 0.60% as agricultural loss. The largest category is other class difference at 3.66%. Most of the county therefore remains uncolored in this comparison, which is consistent with a landscape where the broad agricultural pattern still dominates in 2025.
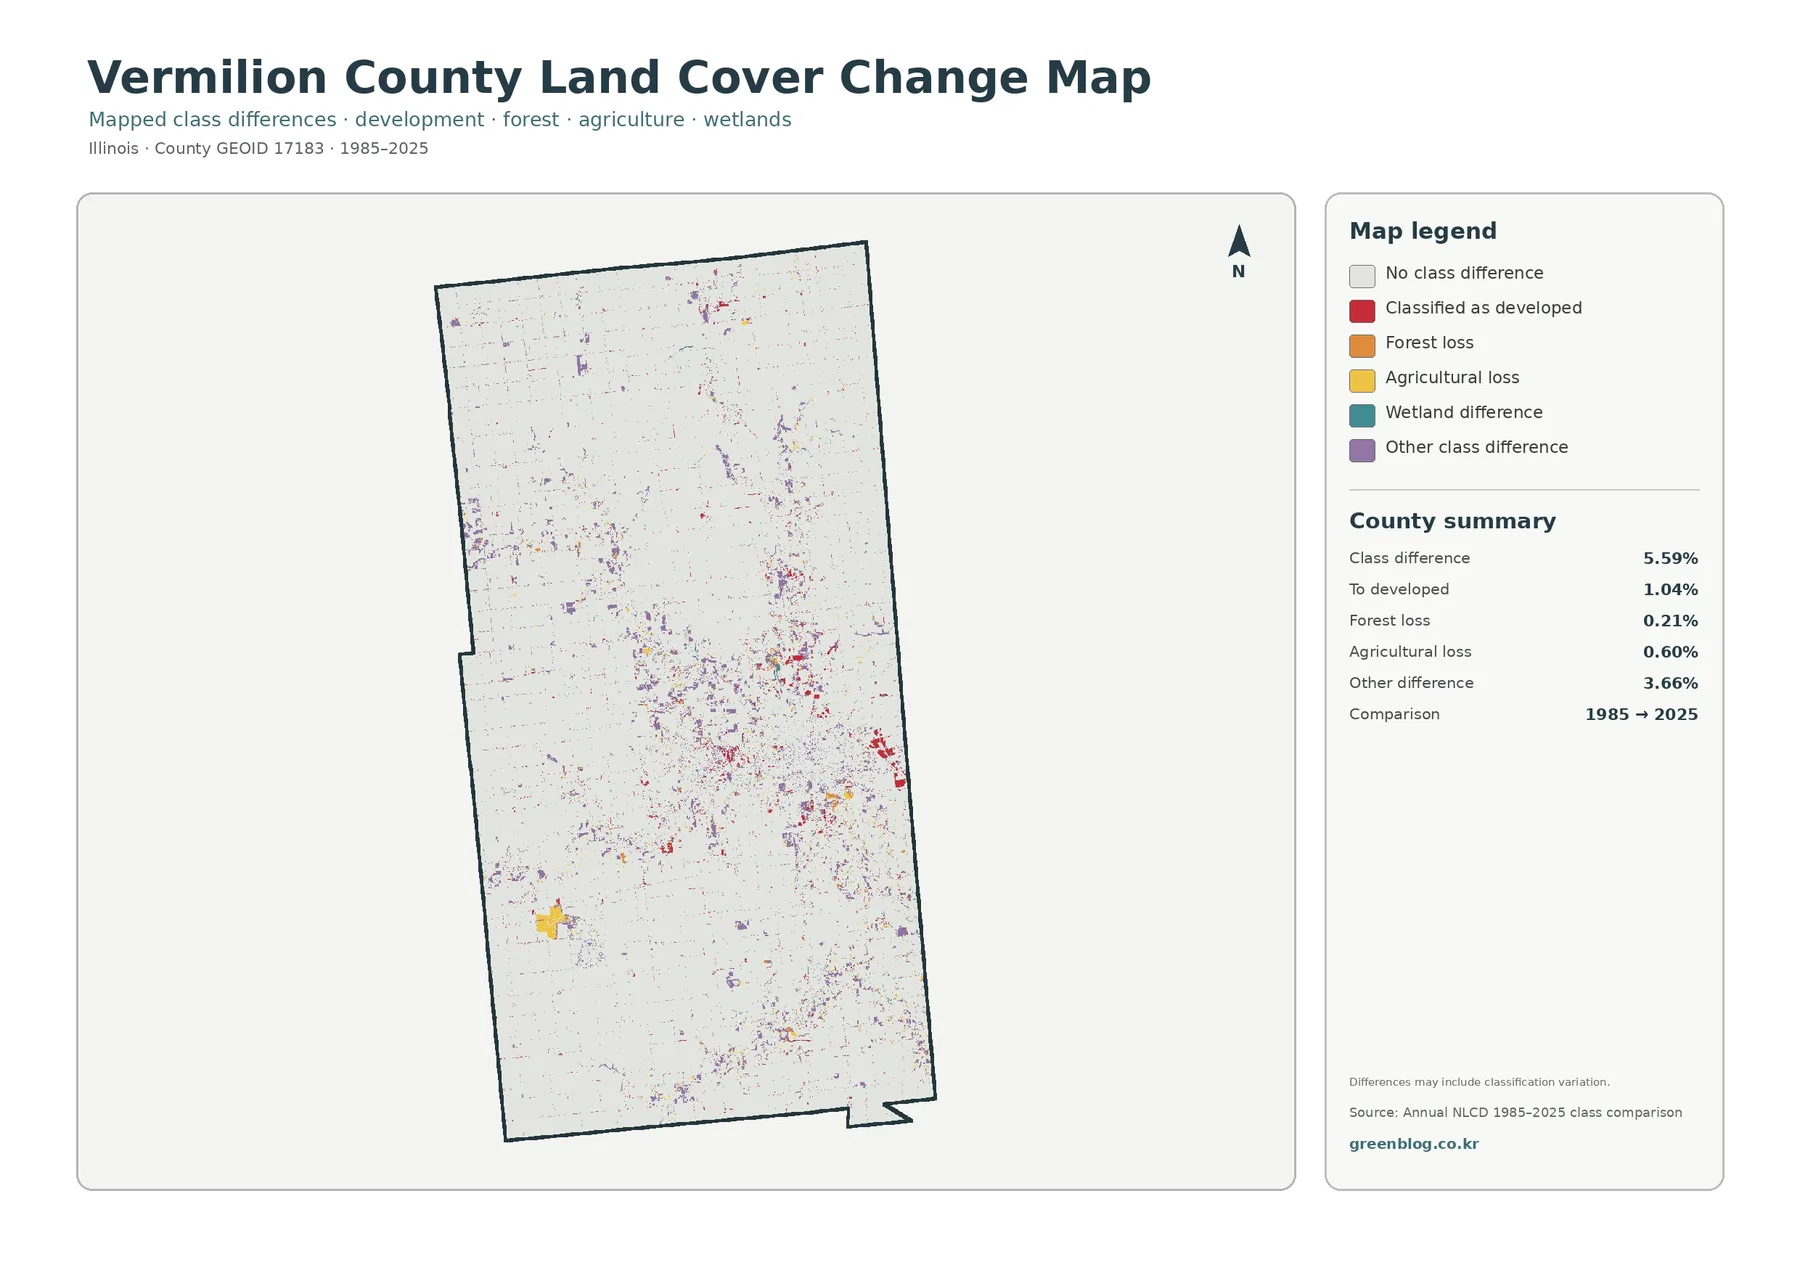
Colored cells are scattered through the county rather than forming one continuous change zone. Red areas indicating change to developed are more noticeable around the Danville side and several smaller settlements, while other difference colors occur along field edges, wooded areas, and mixed landscapes. This is best used as a screening map: it tells the reader where the classification differs, not the exact historical event that produced the difference.
Classification differences can come from real land-cover change, but they can also be influenced by imagery, seasonal conditions, mixed pixels, and changes in the classification process. That point is especially important because the “other difference” category is larger than any named transition in the county summary. To document a specific field becoming developed or a particular woodland being cleared, compare additional Annual NLCD years with aerial imagery and local planning or property records.
The four maps answer different questions about the same county boundary
The general land-cover map is the best starting point when you want the complete mixture of agriculture, development, forest, wetlands, and water. The forest-and-farmland map simplifies that picture so the branching woodland pattern stands out against the cropland. The impervious map is more specific about hard surfaces and makes the Danville core, smaller towns, and roads easier to distinguish. The change map should come last, after the present-day pattern is understood, because its colored cells are meaningful only when you know what the county looks like now.
Using the maps together also prevents misleading conclusions from a single class. For example, the 9.88% developed figure might suggest that nearly a tenth of the county is heavily paved, but the mean impervious value is only 2.80%. Likewise, an 8.28% forest share can sound small until the forest-and-farmland view shows long wooded branches crossing the farm landscape. A 5.59% class difference can sound like a single long-term change rate, yet most of that total belongs to the broad “other difference” category. The separate maps provide the context needed to interpret each number more carefully.
A 30-meter raster is useful for county patterns, not exact parcel decisions
Annual NLCD is raster data. The landscape is divided into regular cells, and each cell receives a representative mapped value. At roughly a 30-meter land-cover scale, one cell can contain part of a field, a few trees, a narrow road, a small building, or water along an edge. The resulting class is a generalized representation rather than a survey of every visible feature. Small streams, thin wooded strips, and mixed suburban edges are some of the places where that simplification is easiest to notice.
For Vermilion County, the dataset works well for comparing the broad agricultural north and west with the more complex forest, water, and development pattern around the center and east. It can also show where impervious cover is concentrated and where 1985 and 2025 classifications differ. It cannot establish property ownership, zoning, buildable area, wetland jurisdiction, or the exact boundary of Danville or any park. Those questions require the appropriate county, state, federal, or parcel-level source.
These maps work well for reference, teaching, and side-by-side local comparisons
For an agricultural overview, the general map and forest-and-farmland map make a useful pair because they show both the 80.21% farm share and the places where woodland interrupts it. For a built-environment discussion, the general developed class can be compared with the impervious map to show why “developed” does not always mean “paved.” For a historical project, the change layer can identify locations worth checking in aerial photos or other dated records.
The map set can also support classroom exercises and presentations. Students can compare why a small forest percentage still forms a visible network, locate the strongest impervious concentrations without assuming every town is equally paved, or discuss why a change-class map needs caution before it is treated as a land-use history. When the maps are reused in a report or presentation, keep the map year and source information with the image so viewers know that the classes represent the 2025 Annual NLCD and the change view is a 1985–2025 classification comparison.
Download all four original Vermilion County JPG maps in one ZIP
The downloadable file contains four JPG maps built on the same Vermilion County boundary: the 2025 general land-cover map, the forest-and-farmland map, the impervious-surface/developed-land map, and the 1985–2025 land-cover change map. Keeping the same boundary makes it easy to compare the Danville developed area, the broad agricultural landscape, wooded drainages, and mapped class differences without resizing or realigning separate sources. Use the WebP images above for quick browser viewing and the JPG files when you want local copies for a document, handout, or printed reference.
Frequently Asked Questions
Does the 80.21% agriculture value mean that 80.21% of Vermilion County is legally designated farmland?
No. It is the share classified as agriculture in the supplied 2025 land-cover map. Satellite-based land cover does not establish parcel ownership, agricultural zoning, tax classification, or conservation status. A legal or parcel-level farmland question should be checked against county property records and the relevant agricultural or planning source.
Why does 8.28% forest look so prominent on the map?
Much of the forest occurs in long, branching shapes through the central and eastern parts of the county instead of one compact block. Narrow woodland along drainages can be visually prominent even when its countywide area is modest. Local conservation areas such as Forest Glen and Kennekuk also confirm the presence of wooded ravines and river landscapes, although the map does not identify ownership and not every forest pixel is protected land.
Is the 5.59% 1985–2025 class difference a confirmed land-use change rate?
Not by itself. The total includes 1.04% mapped to developed, 0.21% forest loss, 0.60% agricultural loss, and 3.66% other class difference. Because the broad “other” category is the largest component and classification can vary between image years, the 5.59% figure is best treated as a mapped comparison. Confirm a specific historical change with additional imagery and local records.
Map File Information
Download four original JPG maps for Vermilion County to compare agriculture, forest, developed land, impervious surfaces, water and wetlands, and mapped differences from 1985 to 2025.
- Included Files: Land cover map, forest and farmland map, impervious/developed land map, land cover change map
- File Type: Four JPG maps in one ZIP
- Intended Use: Farm-forest comparison, Danville development, impervious-surface review, water and wetland context, and long-term class comparison
Related Maps
- Adams County Illinois Land Cover Map
- Alexander County Illinois Land Cover Map
- Bond County Illinois Land Cover Map
Sources and References
- MRLC Annual NLCD Data – Annual land-cover and impervious-surface datasets
- USGS Annual NLCD Land Cover Classification – Land-cover classes and interpretation guidance
- U.S. Census Bureau TIGER/Line Shapefiles – Standard county boundaries and geographic reference data
- Vermilion County Conservation District – About Us – Official local context for Danville, the Indiana boundary, and county parks
- Vermilion County Conservation District – Illinois Nature Preserves – Local descriptions of Forest Glen, the Middle Fork River, and protected natural areas
Green Map creates custom-edited map images using open geographic data sources such as geoBoundaries, Natural Earth, OpenStreetMap, and government open data.
These maps are edited visual materials, not raw data files, and are provided for education, documents, presentations, and graphic reference.