Pontotoc County sits in northeastern Mississippi, with the city of Pontotoc near the center and smaller communities spread toward Ecru, Thaxton, Toccopola, Algoma, and Sherman. The maps on this page show how those places connect to the main roads, a dense network of creeks, and a landscape of low valleys and higher ridges. You can also download the supplied county, city, water, and elevation maps together as high-resolution A3 JPG files in one ZIP archive.
The county is easier to understand when the four map views are read together rather than as separate illustrations. Pontotoc anchors the road network, while Ecru lies to the north, Algoma to the south, Thaxton and Toccopola to the west, and Sherman near the northeastern edge. The water map highlights Skuna River and several named creeks, and the elevation map shows that many of those channels occupy lower ground between wooded hills. That combination gives a much clearer picture of the county than a simple boundary outline alone.
Table of Contents
Roads radiating from Pontotoc
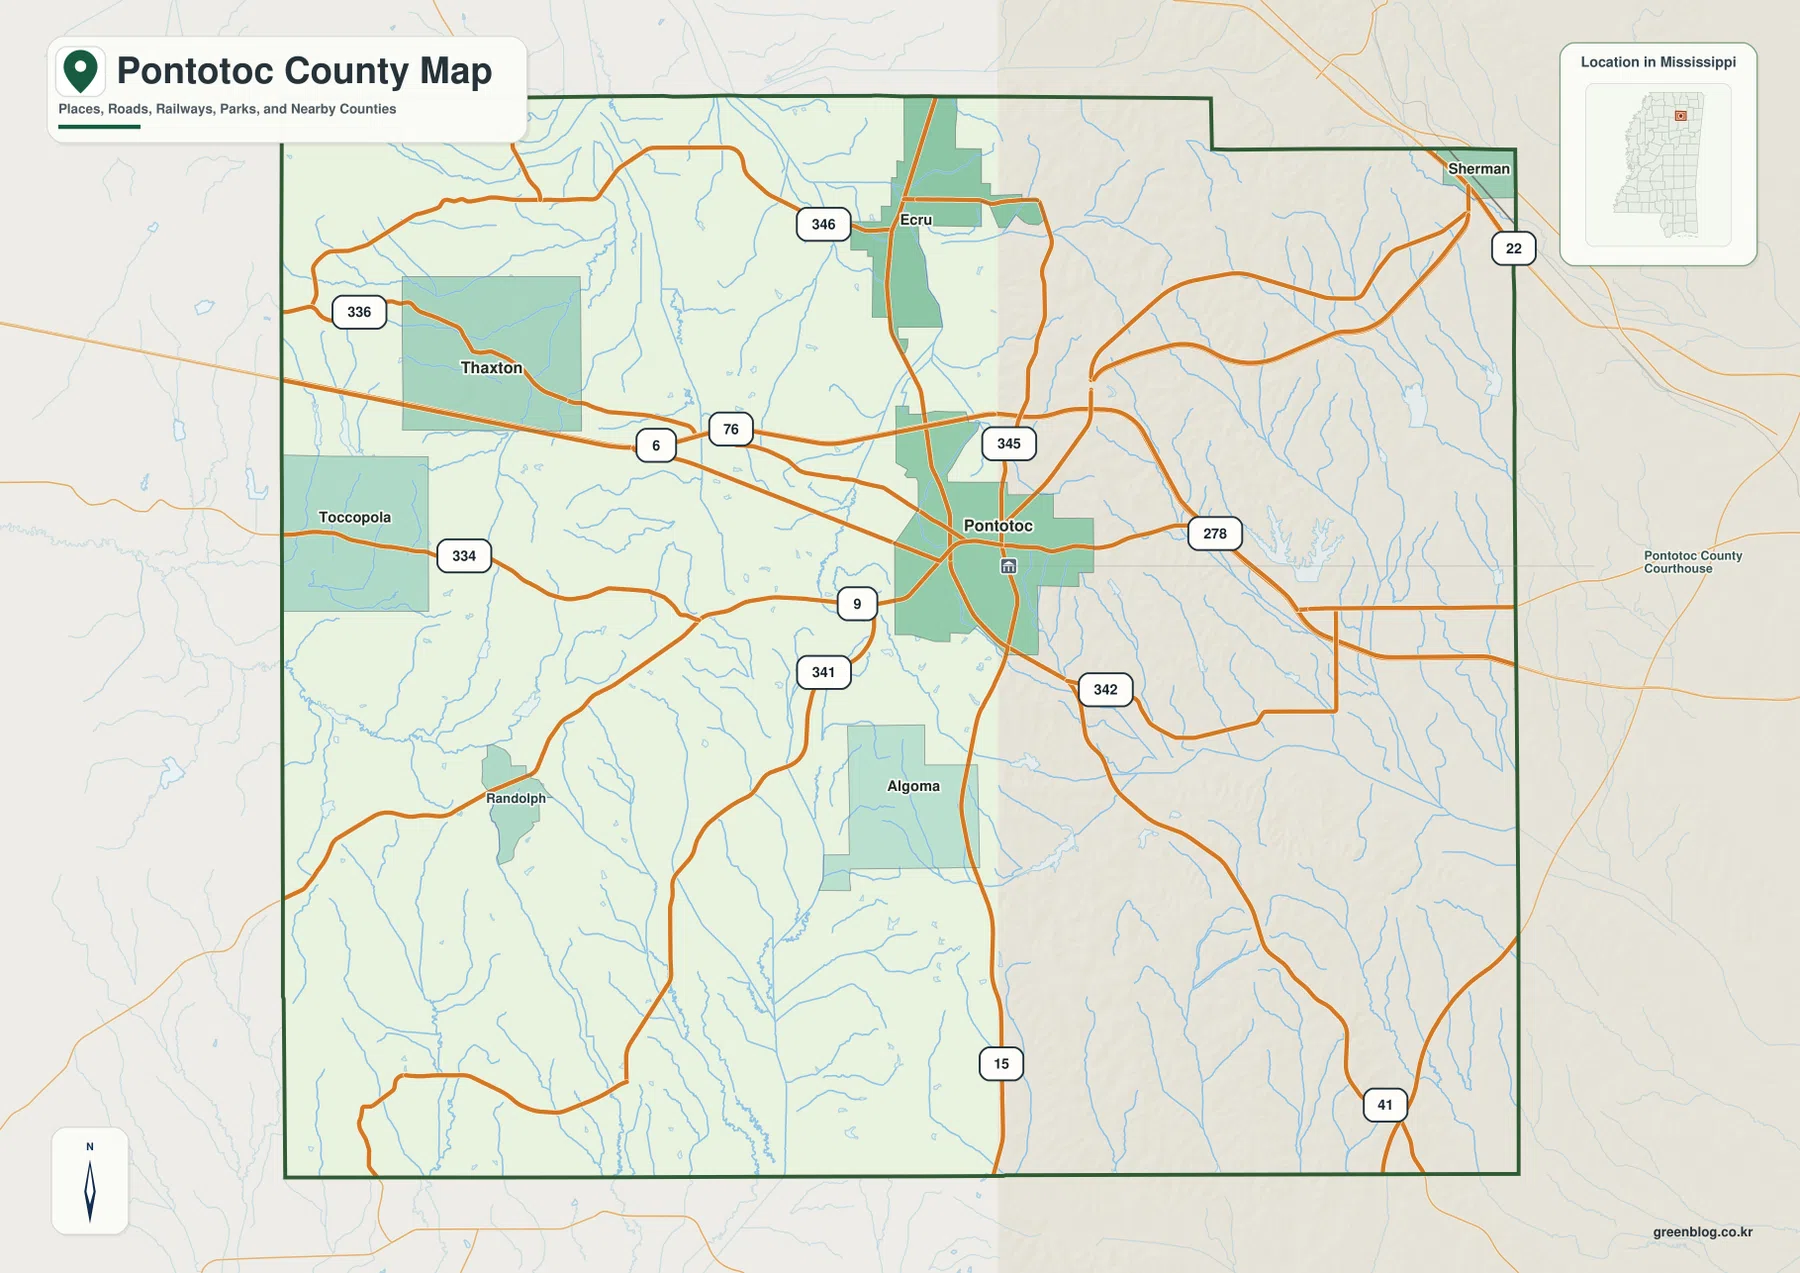
The general county map makes Pontotoc the most useful starting point for orientation. US 278 and MS 6 cross the county from west to east through the Pontotoc area, while MS 15 runs north through Ecru and continues south past Pontotoc toward Algoma. On the western side, MS 334 and MS 336 serve the Toccopola and Thaxton area. MS 9 and MS 341 branch southwest of Pontotoc, MS 342 appears southeast of the city, and MS 22 reaches the Sherman area near the northeastern county edge.
This arrangement explains why Pontotoc functions as the central reference point on the map even though the county contains many rural roads and scattered settlements. A trip from Ecru to Algoma follows a clear north-south relationship, while Toccopola and Thaxton provide useful western reference points. The surrounding county labels also help with regional orientation: Union County is to the north, Lee County is to the east, Lafayette County is to the west, and Calhoun and Chickasaw counties lie toward the southwest side.
Six mapped communities and their relative positions
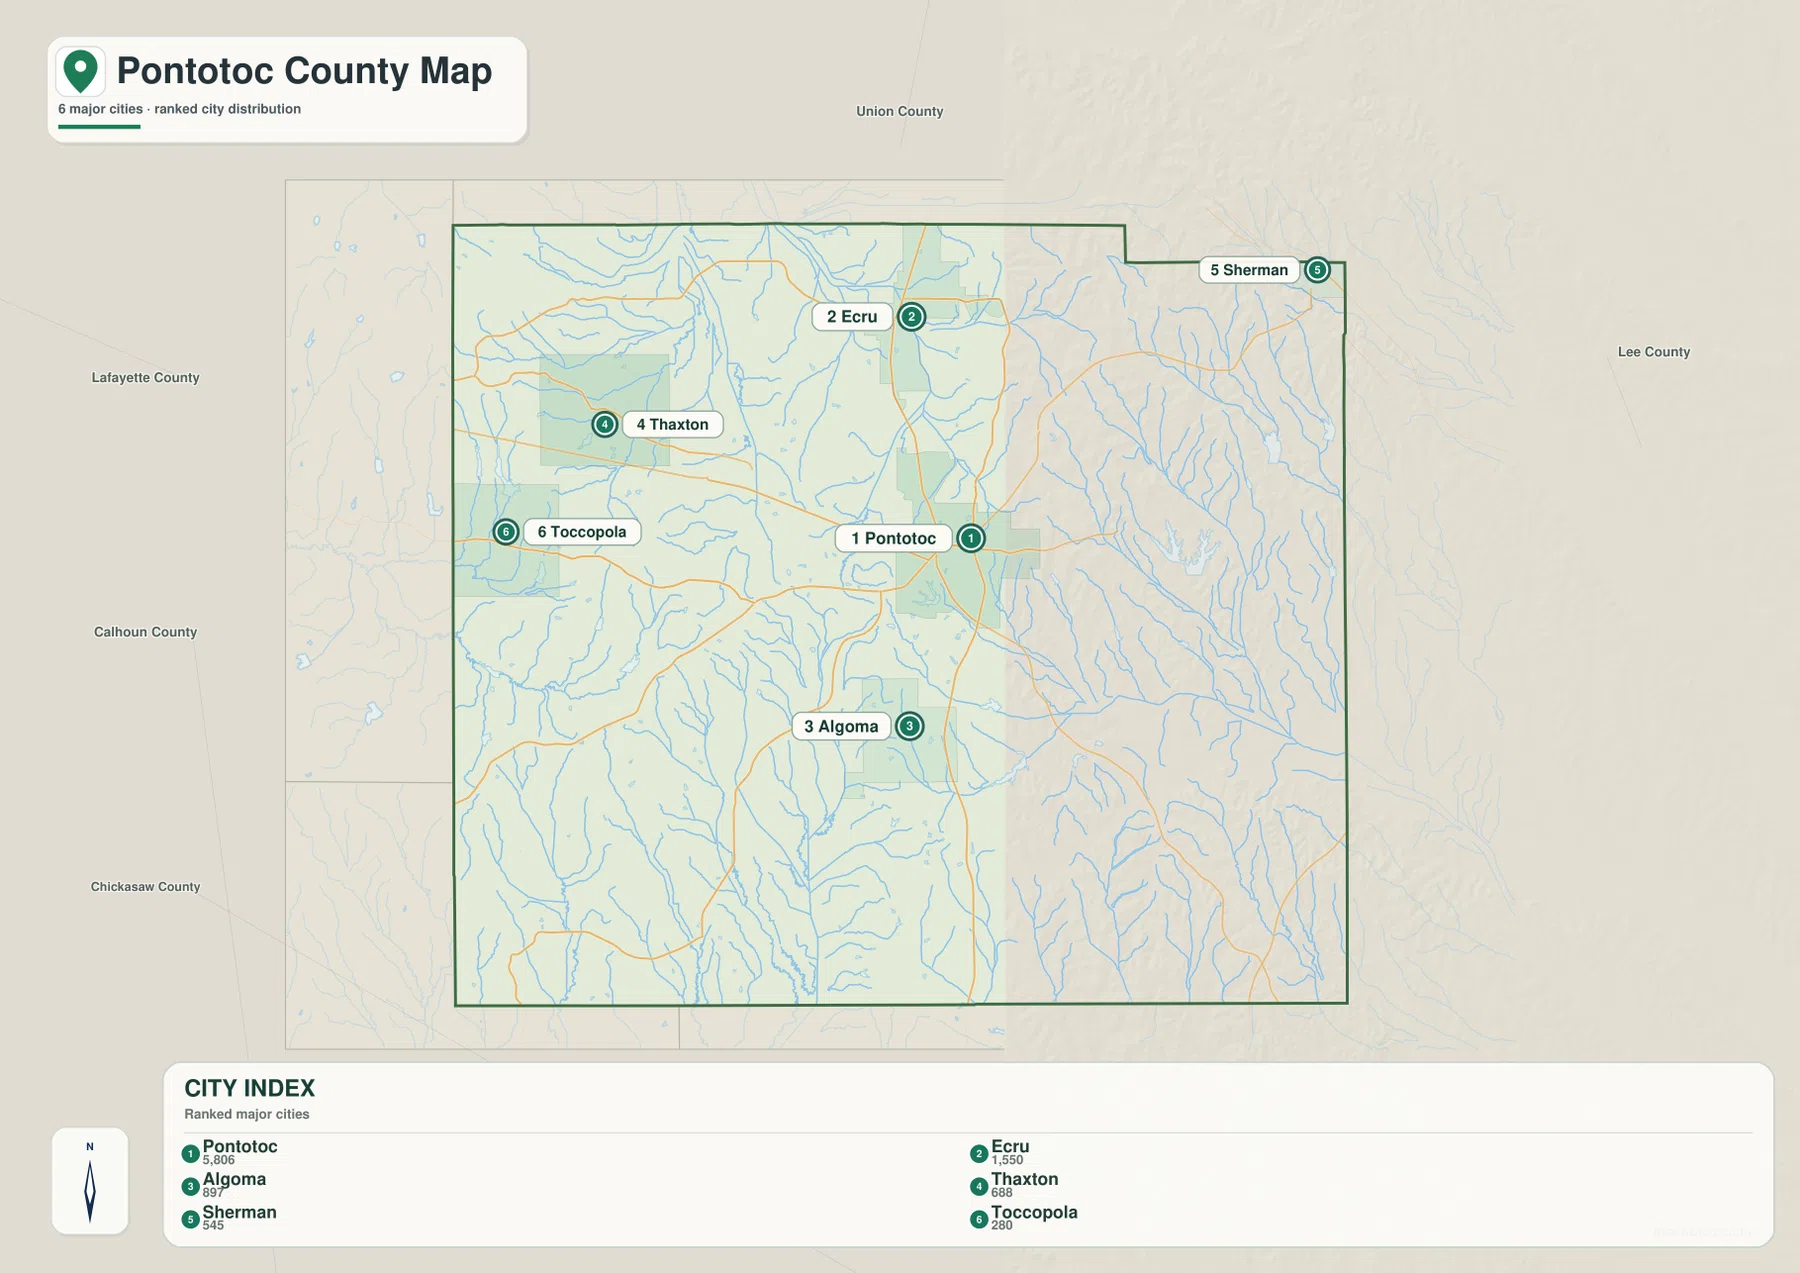
The city map reduces visual clutter and focuses on six ranked communities. Pontotoc is marked first near the center, Ecru is north of it, and Algoma is to the south. Thaxton and Toccopola occupy the western half of the county, while Sherman sits near the northeastern corner. This layout is useful when the goal is not to inspect every local road but to understand how the main settlements are spaced across the county.
The index on the map lists Pontotoc at 5,806 residents, followed by Ecru at 1,550. Algoma is shown at 897, Thaxton at 688, Sherman at 545, and Toccopola at 280. These figures belong to the city index shown on the supplied map and should not be confused with the countywide population. Their main value here is comparative: they show why Pontotoc receives the strongest emphasis while the other communities appear as smaller reference points around it.
Skuna River, Yocona River, and the creek network
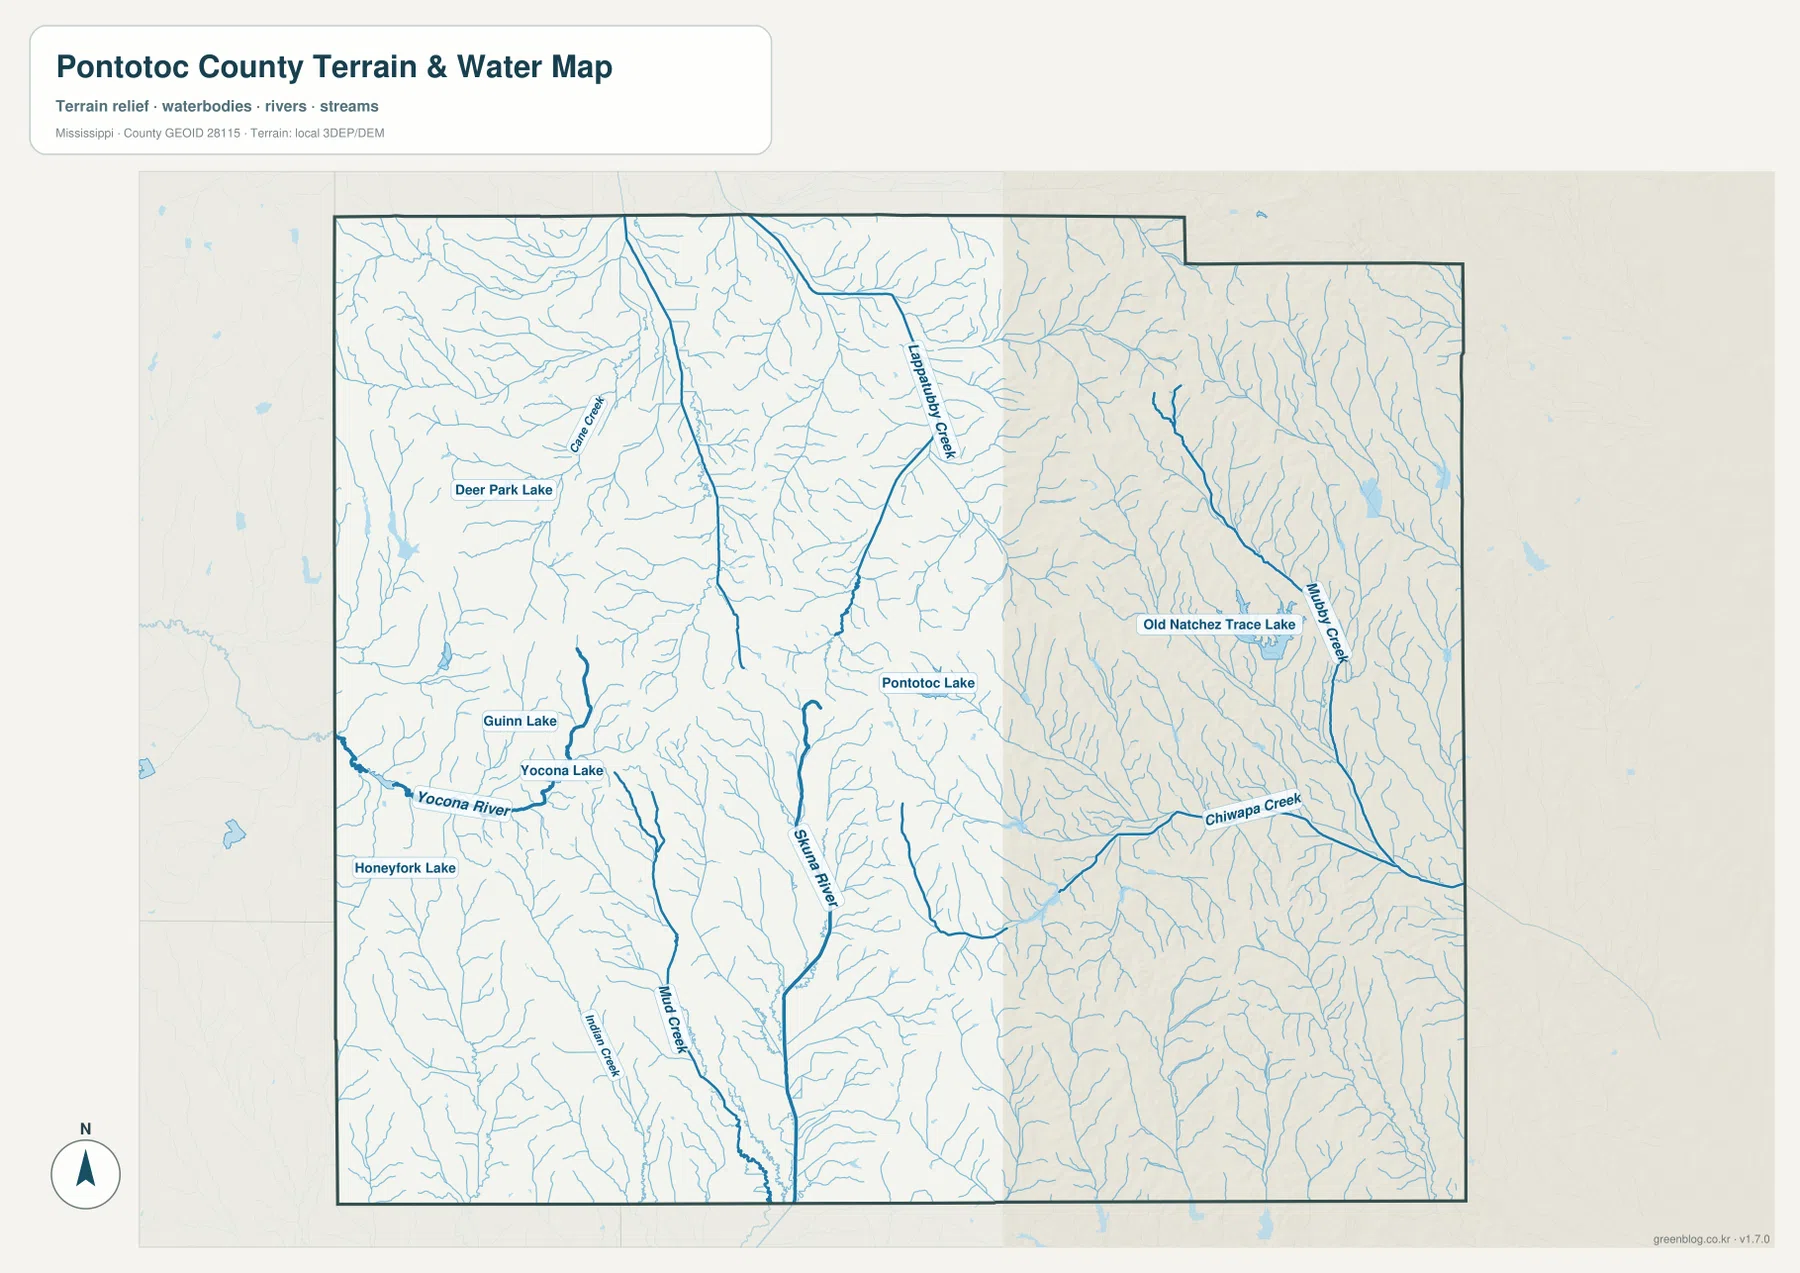
The terrain-and-water map shows a county crossed by many narrow streams rather than dominated by one large lake. Skuna River is the strongest named channel in the center and southern part of the map. Tappanubby Creek descends through the northern interior, while Muddy Creek and Chiwapa Creek are prominent on the eastern side. Yocona River appears along the west, and smaller named streams such as Cane Creek and Mud Creek add to the branching drainage network.
Several small lakes are scattered among these channels. Pontotoc Lake lies near the central part of the county, Guinn Lake and Yocona Lake appear farther west, and Honeyfork Lake is close to the western edge. Deer Park Lake is in the northwest, while Old Natchez Trace Lake stands out in the east. The map is best used to locate these water features and understand how creeks divide the terrain; it is not a flood map, navigation chart, parcel map, or legal description of waterfront property.
Higher hill country separated by lower stream valleys
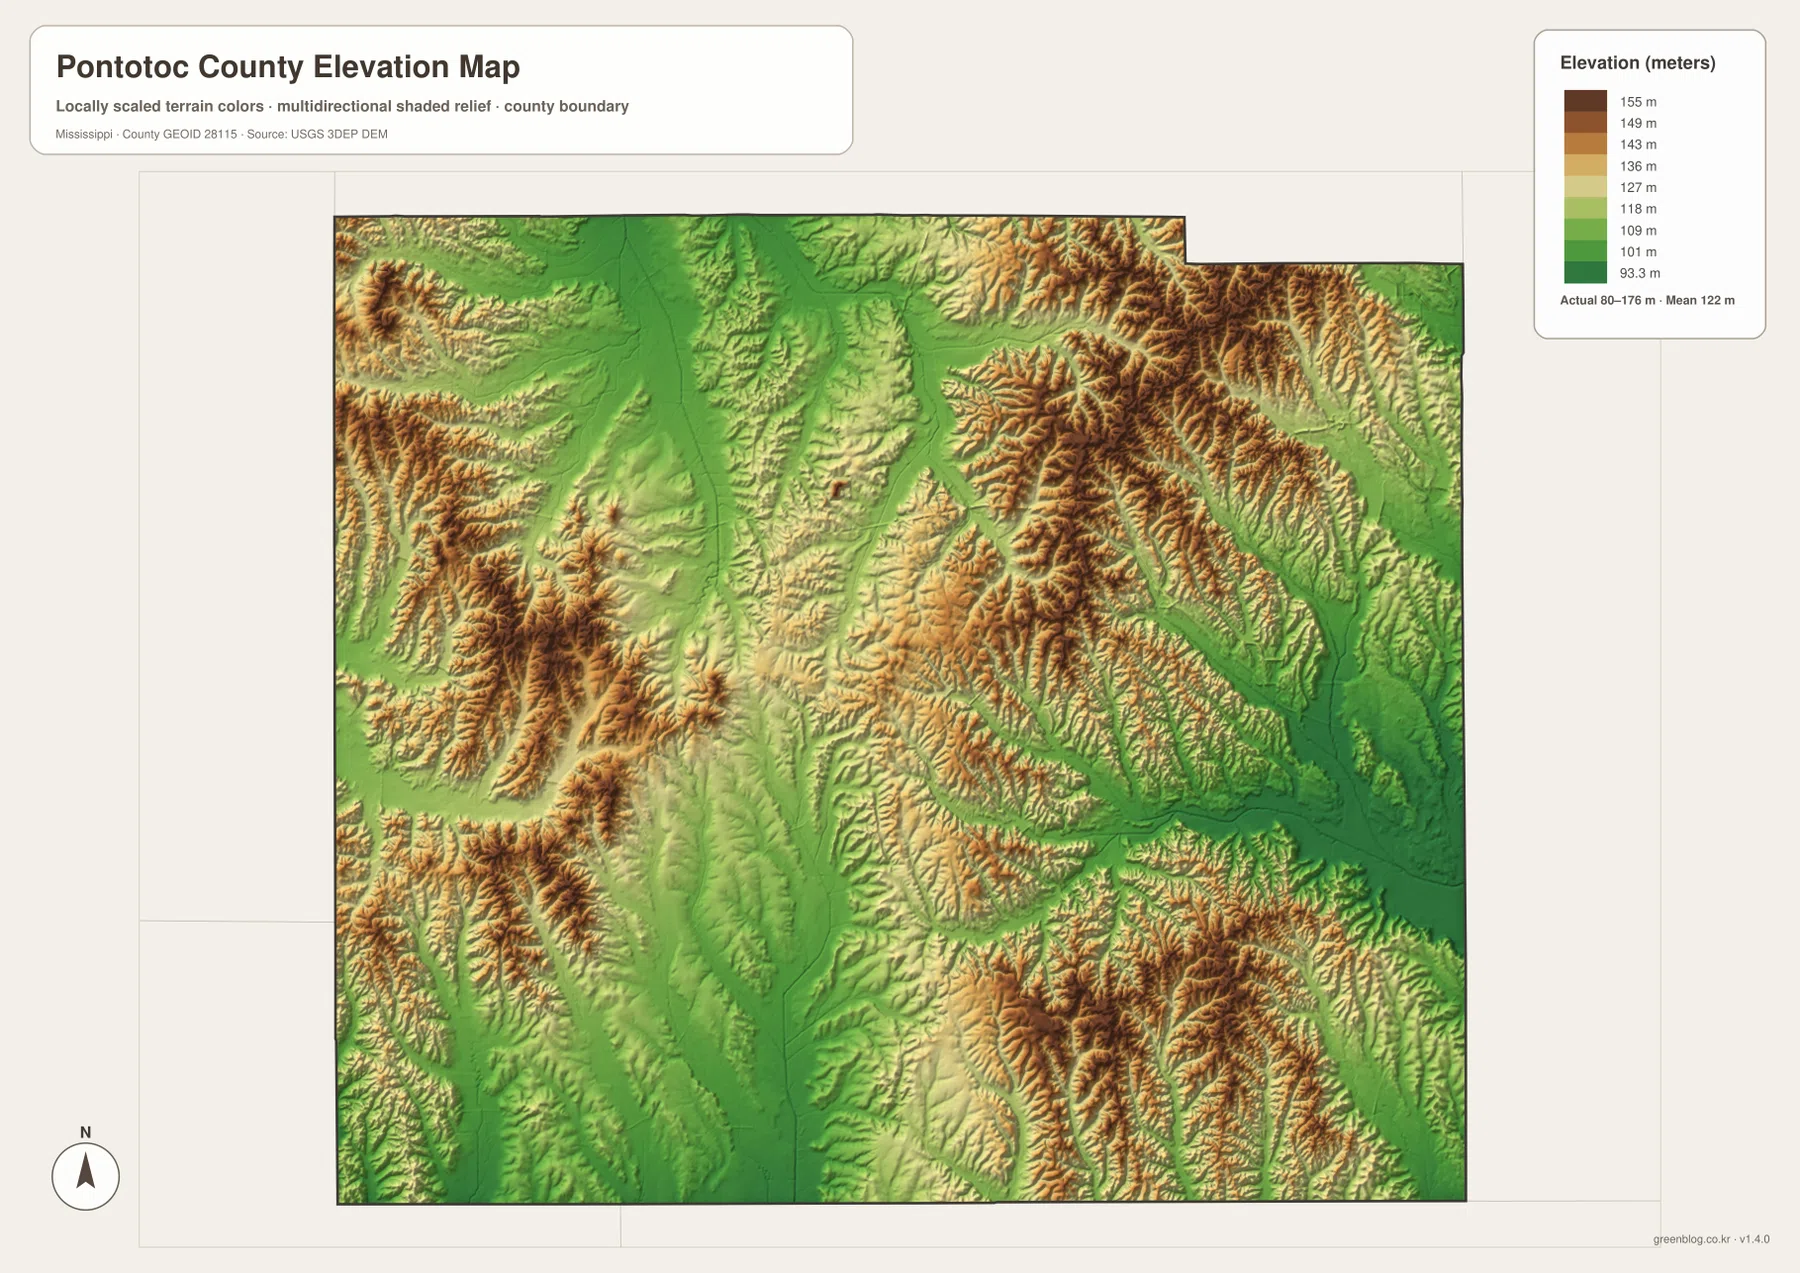
The elevation map covers an actual range of about 80 to 176 meters, with a mean elevation of 122 meters. Darker green bands follow lower valleys, while tan and brown areas mark higher ridges and hills. The eastern side contains many closely spaced ridges, and the western side also has pronounced high ground broken by narrow valleys. Lower terrain runs through the central and southern drainage paths and along several of the larger creeks.
That relief helps explain the branching appearance of the water map. Streams occupy the lower corridors between ridges, and those valleys create repeated north-south and diagonal breaks in the hill country. When this view is compared with the road map, some routes can be seen crossing or following gentler terrain between higher areas. The elevation surface is generalized for county-scale reference, so it should not be treated as survey-grade elevation for a house lot, road design, drainage engineering, or construction work.
Population and area put the map scale in context
Pontotoc County recorded 31,184 residents in the 2020 census, and the July 2025 estimate listed in the supplied material is 32,096. Because a decennial census count and a later population estimate use different dates and methods, they are best read as reference points rather than as identical measurements. The 2025 Gazetteer values in the package list 497.813 square miles of land and 3.208 square miles of water, which fits what the water map shows: streams are widespread, but large open-water areas occupy only a small part of the county.
The scale also helps explain the city map. Pontotoc is the largest labeled community, yet broad rural areas extend between Pontotoc, Ecru, Thaxton, Toccopola, Algoma, and Sherman. Countywide population density therefore summarizes a large landscape that includes towns, farmland, wooded ridges, and creek valleys. It should not be read as if people were evenly distributed across every square mile.
Choosing the best map for the task
Use the general county map when road direction, county edges, and the placement of several communities matter most. The city map is cleaner for comparing Pontotoc with Ecru, Algoma, Thaxton, Sherman, and Toccopola. For a stream, lake, or creek name, the water map carries far more detail, while the elevation map is the best choice for seeing the difference between ridge country and lower valleys. Combining two views can be especially useful in a presentation—for example, pairing the road map with the elevation map explains both where a route goes and the terrain it crosses.
Frequently Asked Questions
Which waterway stands out most on the Pontotoc County maps?
Skuna River is the most prominent named river running through the central and southern portion of the supplied water map. Yocona River is important on the western side, and Tappanubby, Muddy, and Chiwapa creeks show how heavily the rest of the county is divided by smaller drainage valleys.
Where is the lower terrain shown on the elevation map?
The lower green bands generally follow the larger stream valleys, including the central and southern drainage corridors. Higher brown ridges are more common across the east and in parts of the west. The map’s actual elevation range is about 80 to 176 meters, but it is intended for county-scale comparison rather than property-level measurement.
Which towns help orient the county besides Pontotoc?
Ecru is the clearest northern reference, Algoma lies south of Pontotoc, and Thaxton and Toccopola mark the western half of the county. Sherman sits close to the northeastern edge, making it useful for understanding the direction toward Union and Lee counties. Together, those places provide a quick framework for reading the broader road map.
Map File Information
The download ZIP contains the county, city, water, and elevation maps as high-resolution A3 JPG files. They are larger than the page previews and can be used for printing, editing, classroom materials, or location-reference graphics.
- File Type: four high-resolution JPG files in one ZIP
Related Maps
Sources and References
- U.S. Census Bureau QuickFacts for Pontotoc County — population and county statistics
- U.S. Census Bureau Gazetteer Files — land and water area reference
- Mississippi Department of Transportation Official Highway Map — major route reference
- USGS National Hydrography — rivers, creeks, and water features
- USGS 3D Elevation Program — elevation and terrain reference
Green Map creates custom-edited map images using open geographic data sources such as geoBoundaries, Natural Earth, OpenStreetMap, and government open data. These maps are edited visual materials, not raw data files, and are provided for education, documents, presentations, and graphic reference.