Schuyler County in west-central Illinois has a land-cover pattern that is easy to recognize once agriculture and forest are viewed together. Agriculture is the largest 2025 class at 57.01%, but forest still covers 33.46% and forms long, branching bands through the county. Rushville appears as the strongest developed cluster near the center, while water and wetlands become more visible toward the eastern edge. This page compares four views of that same county landscape.
The four original JPG maps are available together in one download. Use the general land-cover map for the broad county pattern, the forest-and-farmland view for the contrast between fields and wooded corridors, the impervious map for hard surfaces around Rushville and roads, and the 1985–2025 map for places where broad classes differ between the two dates.
Table of Contents
A county where farms dominate, but woodland still shapes the map
Schuyler County’s official website identifies Rushville as the county seat. On the supplied maps, the central built cluster that corresponds with Rushville is much larger than the smaller developed marks scattered elsewhere. Outside that center, the county is mostly a mixture of agricultural ground and forest. The west contains especially broad farm areas, while the middle, east, and south show a denser network of wooded bands cutting between fields.
The 2025 summary gives agriculture 57.01%, forest 33.46%, developed land 5.52%, wetlands 2.61%, and water 1.12%. Grassland is 0.12% and shrubland is 0.04% in the forest-and-farmland summary. Those numbers matter because Schuyler County is not a case where one class overwhelms nearly everything else. Farms occupy the majority, yet one acre in three falls within the mapped forest class, creating a much more textured county pattern.
A state greenways and trails plan for Schuyler County discusses both the Illinois River and the La Moine River as local waterways. The supplied land-cover map shows a notable water-and-wetland edge on the eastern side and many narrow wooded corridors farther inland. Because the map itself does not label rivers, it is best to use the state plan as geographic context rather than assign a name to every blue or teal feature visible on the image.
Reading the 2025 map from broad farm blocks to the eastern water edge
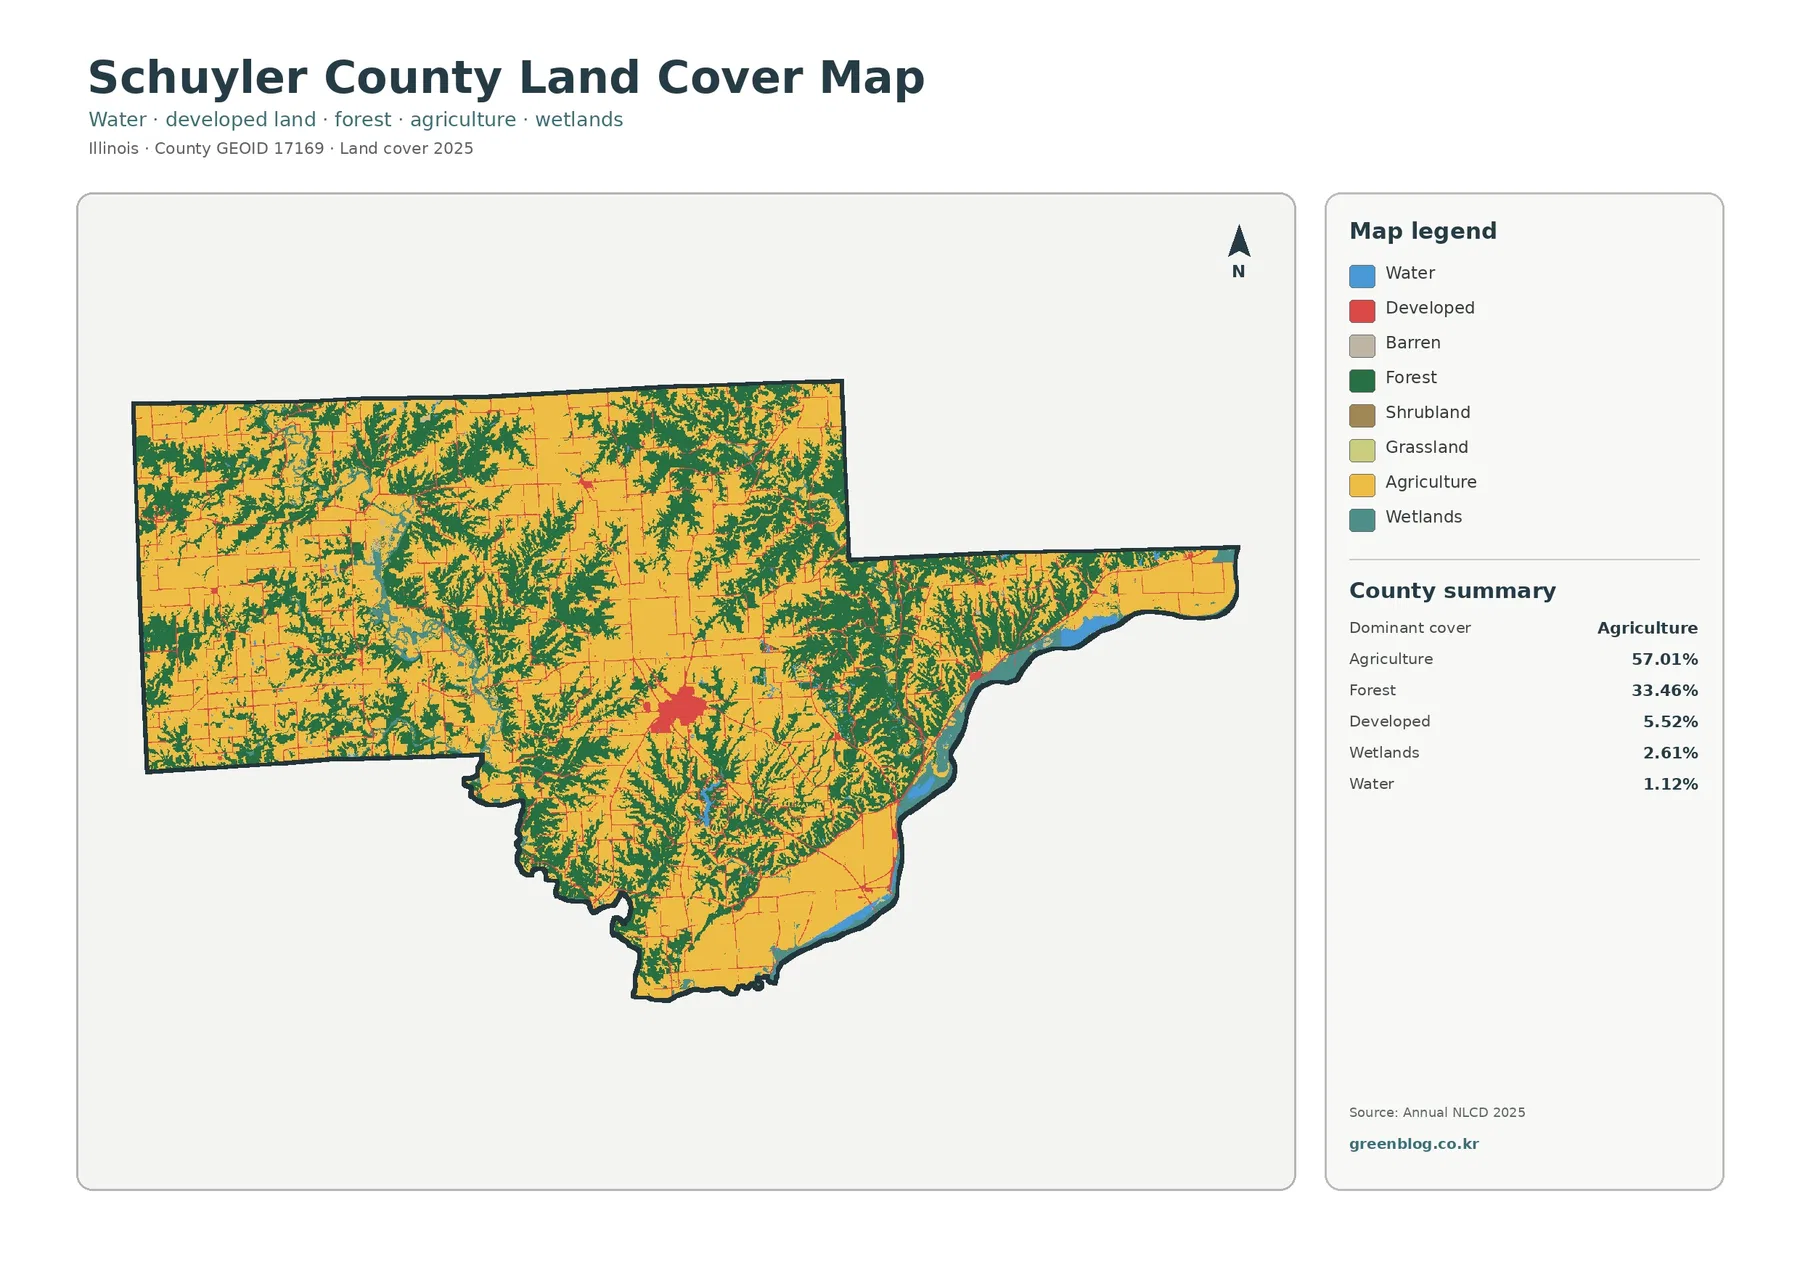
The general map works best when it is read in three pieces. First, yellow agricultural cover fills many of the widest uninterrupted areas, particularly across much of the west and northwest. Second, dark green forest repeatedly cuts into those fields in branching shapes. Third, the eastern edge introduces blue water and teal wetlands beside forest, making that part of the county look different from the broad agricultural interior.
Rushville provides a useful landmark near the center. Developed land is colored red, and the central cluster is clearly larger than other developed patches. Thin red lines and small marks extend away through the county along roads and smaller settled areas, but most rural cells remain agricultural or forested. Comparing this map with the impervious view later helps separate a broad developed class from the actual fraction of pavement and rooftops.
Wetlands account for 2.61% and water for 1.12%, so neither class is large in county-wide percentage terms. Their location makes them more important visually than those percentages alone suggest. Teal and blue appear in narrow corridors and along the eastern boundary, often next to forest. For a watershed lesson, that arrangement is more informative than a simple table because it shows where natural cover, farmland, and water meet.
Land cover should not be confused with zoning or legal land use. A developed class does not identify whether a parcel is residential, commercial, industrial, or public, and an agricultural class does not establish ownership or farmland-protection status. The map classifies the surface visible to the remote-sensing system. Parcel boundaries, permits, zoning districts, and regulated wetlands require separate local or state records.
Why the forest-and-farmland view changes the way Schuyler County looks
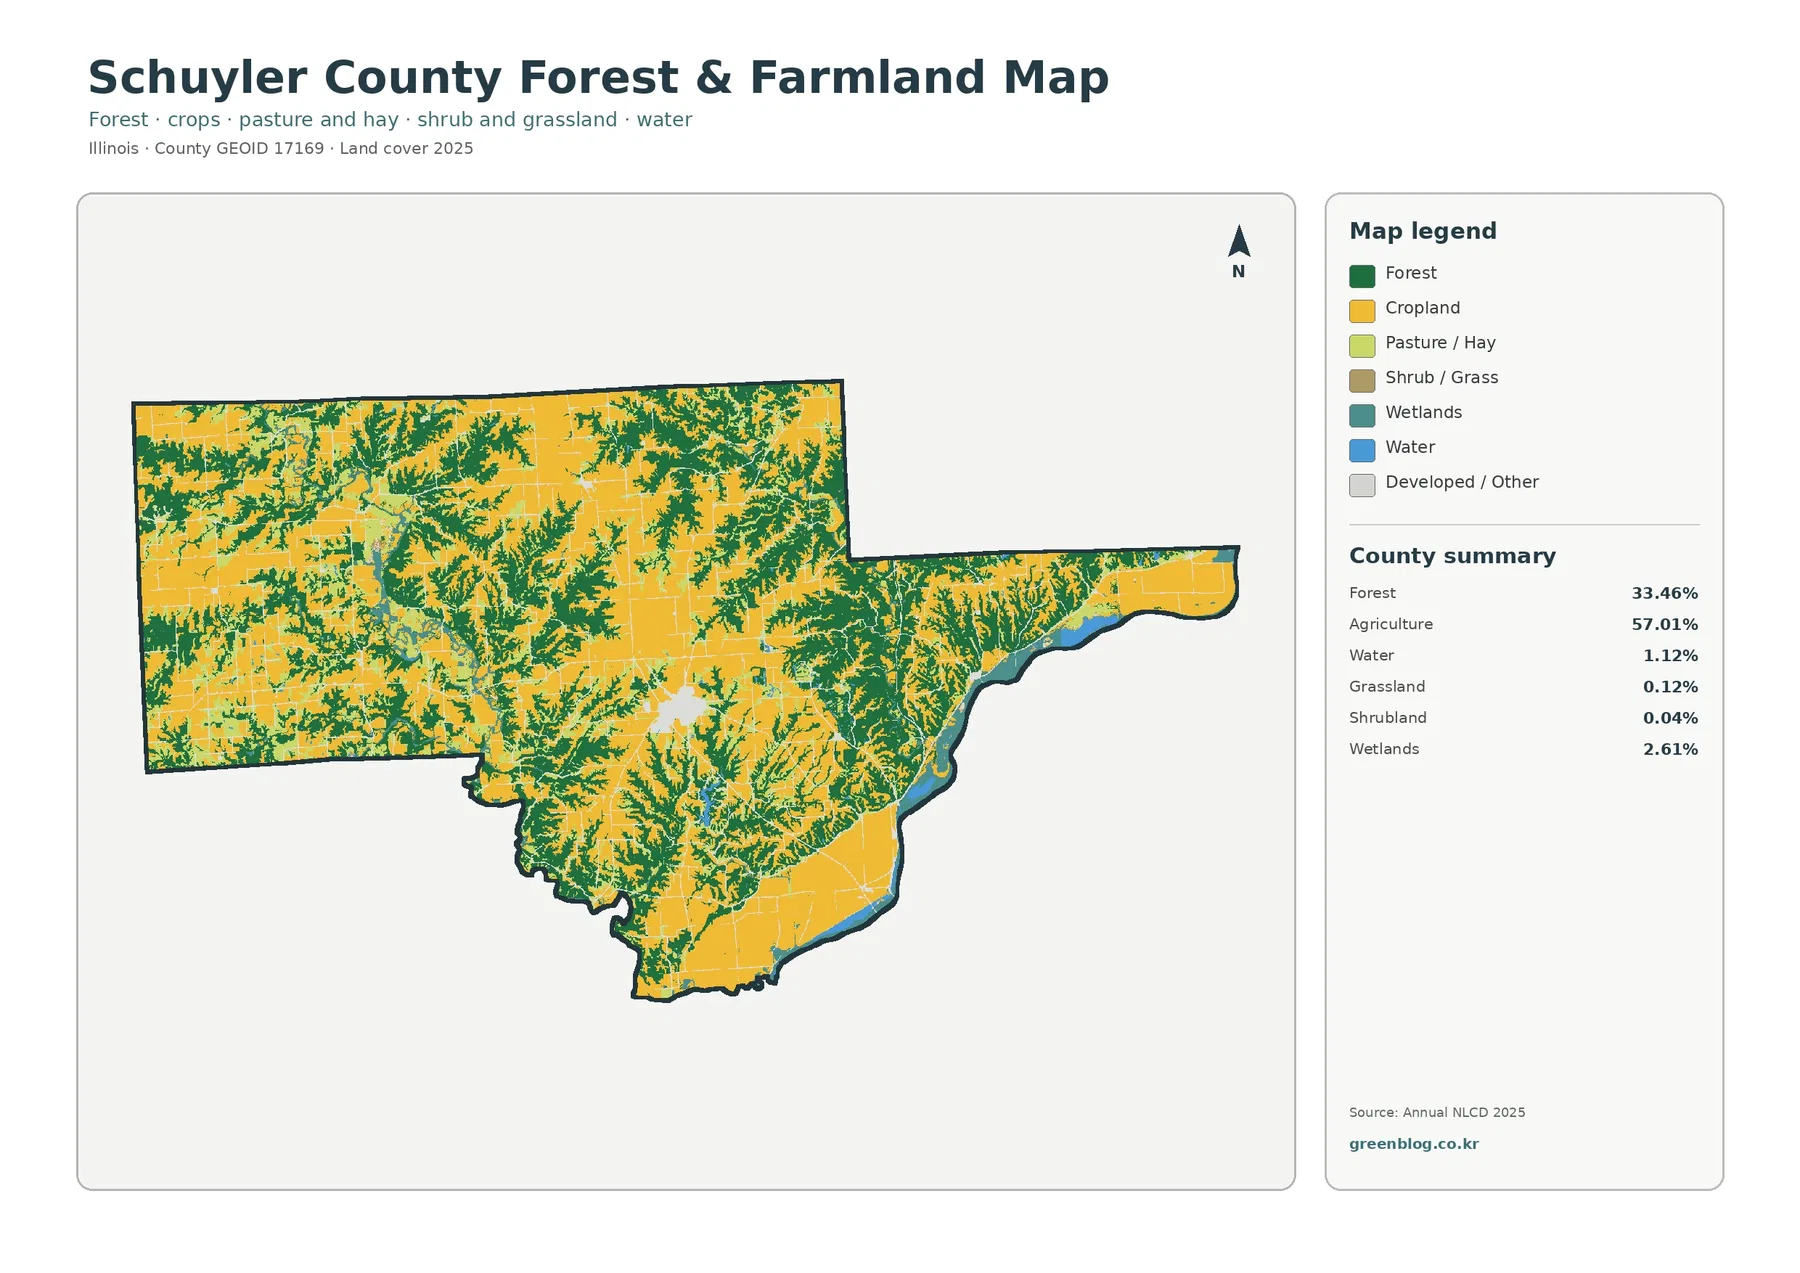
Removing much of the visual detail from developed and minor classes makes the relationship between farms and woods much clearer. Agriculture still covers 57.01%, but forest at 33.46% is too extensive to read as an occasional fringe. In the west, fields form broader blocks. Moving through the central and eastern portions, wooded strips become more frequent, split into many arms, and surround smaller agricultural openings.
The southern projection of the county shows the same interlocking pattern at a different scale. Broad agricultural areas remain important, yet forest reaches through them in narrow bands before meeting water and wetland cover near the edge. This makes the forest-and-farmland map useful for explaining that county percentages do not reveal whether two classes are segregated into separate regions or woven closely together. Schuyler County is clearly the latter.
Grassland is listed at 0.12% and shrubland at 0.04%. Those minor classes are real parts of the legend, but they do not drive the county-wide pattern. A reader will learn more by first understanding the relationship among agriculture, forest, wetlands, and water. Small grass or shrub patches can then be treated as local details rather than enlarged into a major regional story.
The Illinois Department of Natural Resources plan for Schuyler County provides useful local context by discussing access to the Illinois River, the La Moine River, public lands, and natural areas. The green and teal corridors visible on this map can therefore be read as part of a landscape where waterways and natural cover matter alongside agriculture. The image does not, however, measure habitat quality, tree age, forest ownership, or conservation status.
Rushville stands out on an otherwise low-impervious county map
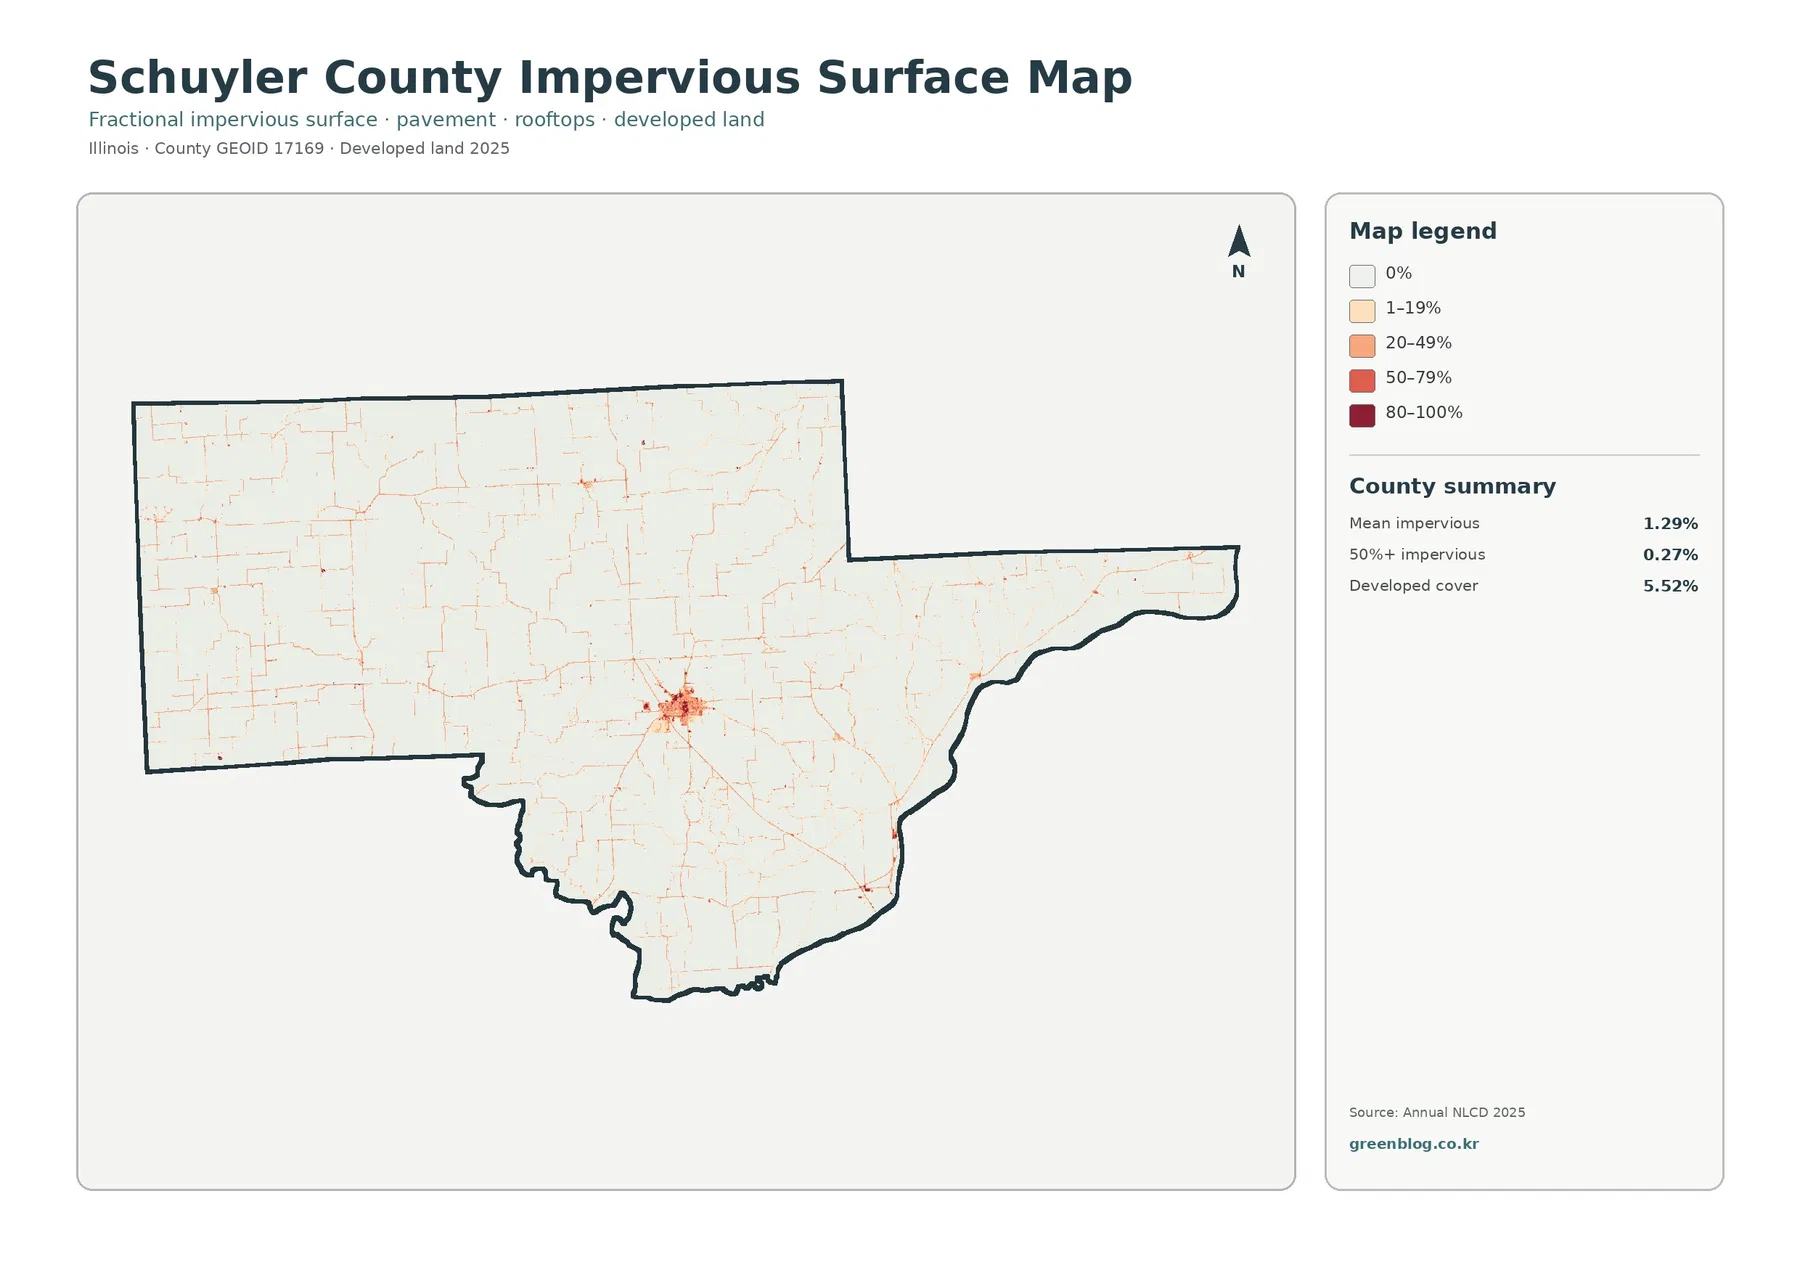
Impervious surface means hard cover such as pavement, parking areas, and rooftops where water does not readily soak into the soil. The county-wide mean is 1.29%, and cells with at least 50% impervious cover account for 0.27% of the county. Developed land is 5.52% in the general land-cover summary. Those values are consistent with a rural county where one main town is visually prominent but most land is not densely built.
Rushville is the clear focal point. Darker orange and red cells form a compact cluster near the middle of the county. Beyond that cluster, the map becomes much lighter, with narrow lines tracing roads and a few small groups marking other settled places. The contrast is useful in presentations because it shows how a single administrative center can be obvious on the map while the county-wide mean impervious percentage remains low.
The developed class and the impervious percentage are related but not identical. A low-density developed cell may include lawns, trees, and other permeable surfaces in addition to streets and buildings. The impervious map reports the fraction of hard surface within each cell, so it separates dense built areas from places that are classified as developed but still contain substantial open ground.
USGS describes Annual NLCD as a Landsat-based raster product at 30-meter spatial resolution. A 30-meter cell can contain several real-world features at once, so a narrow road, house, tree line, and grass strip may be generalized into one value. The map is therefore strong for county-scale comparison but should not be used as a parcel survey or as a direct measurement of individual streets, roofs, or lots.
Most of the 10.26% mapped difference is not classified as new development
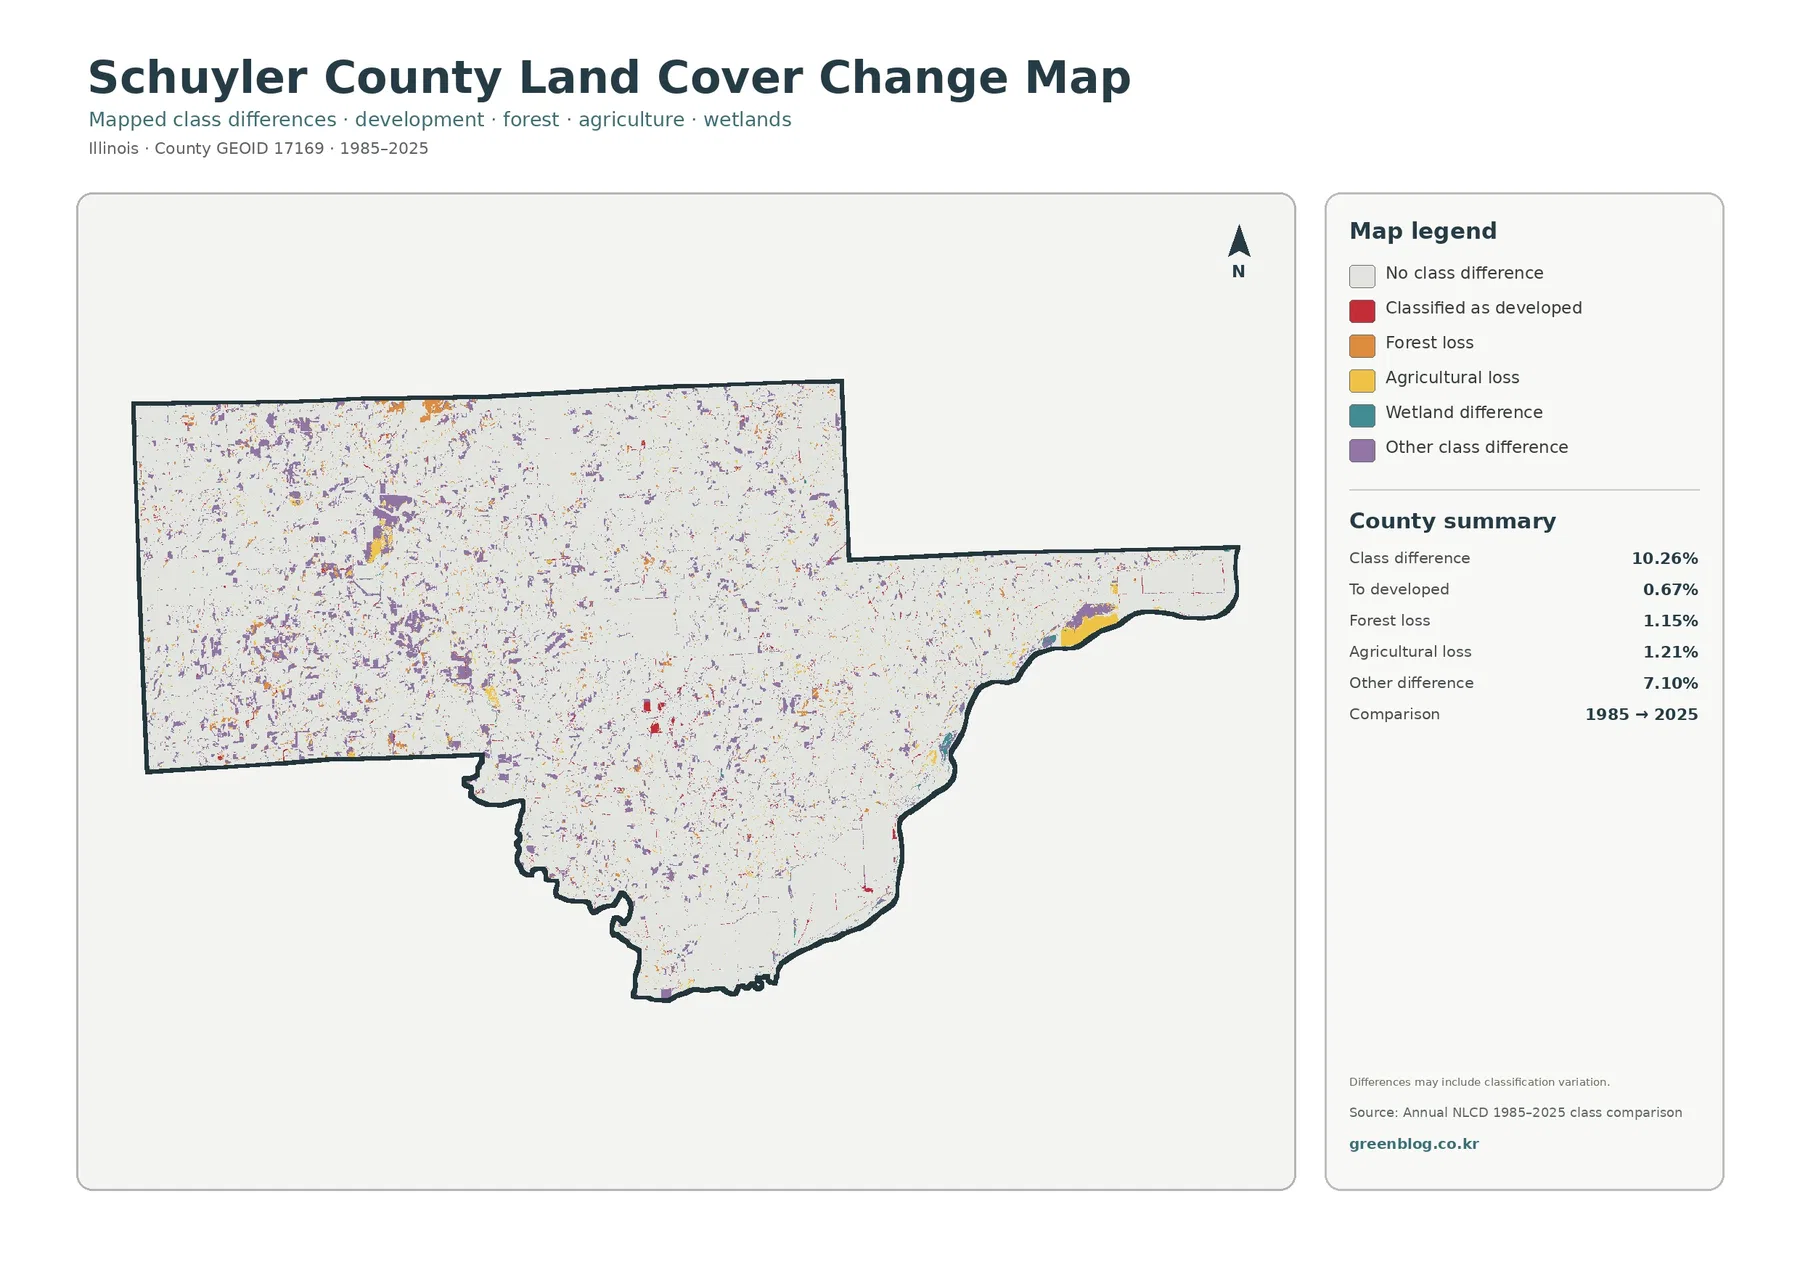
The comparison map reports class differences across 10.26% of the county. Cells classified as developed account for 0.67%, forest loss for 1.15%, agricultural loss for 1.21%, and other class differences for 7.10%. Wetland difference is shown as a separate legend category, but the summary panel does not provide a separate percentage for it. The total difference should not be read as a development-growth rate.
Other class difference is by far the largest named component. That matters because a change in broad classification can reflect a real surface transition, but it can also be affected by mixed pixels, classification boundaries, and differences in how similar cover was assigned in the two years. The map itself warns that differences may include classification variation. Purple cells are therefore signals to investigate, not proof that one specific land-use event occurred.
Red developed-change cells appear around Rushville and in smaller scattered locations, yet their 0.67% share is much smaller than the full 10.26% difference. Forest loss and agricultural loss are also limited in percentage terms. Larger colored patches can be seen in parts of the northwest and along the eastern edge, but the map alone cannot establish when the transition occurred or why. Intermediate annual imagery and local records would be needed for that level of explanation.
The change map also does not record every event that happened during the forty-year period. If a cell changed class in an intermediate year and later returned to the same broad class by 2025, a two-endpoint comparison may not capture the full sequence. For long-term research, the Annual NLCD time series is more useful than treating this one 1985–2025 summary as a complete history.
A simple comparison route: Rushville, farm blocks, then the river side
Start with Rushville on the general map. Note the size of the developed cluster and where surrounding agriculture begins. Then switch to the impervious map. The single red developed area becomes more detailed because dense hard surfaces, lower-density edges, and road traces separate into different shades. This is the clearest place in the county to explain the difference between a land-cover class and an impervious fraction.
Next choose a broad agricultural area in the west. The general map may appear mostly yellow, but the forest-and-farmland view reveals narrow green corridors crossing those fields. On the impervious map the same area is mostly pale, with roads left as thin lines. The change map adds scattered colored cells, which should be treated as locations for closer review rather than assumed to represent large-scale land conversion.
Finish at the eastern edge where water, wetlands, and forest sit close together. That comparison shows why the general map is valuable for environmental context: several cover types can meet within a short distance. The forest-and-farmland map simplifies the relationship, while the change map highlights cells that differ between the two comparison years. Using the four maps in that order keeps the most complicated interpretation until the reader already understands the present-day setting.
Useful for county context, not a substitute for parcel or regulatory data
For a general county introduction, the 2025 land-cover map is the strongest single image because it shows farms, branching forest, Rushville, wetlands, and water together. The forest-and-farmland view works better when the subject is agriculture, wooded corridors, or watershed context. The impervious map is the best choice for built surface, and the change map is useful for identifying places where a longer time series may be worth checking.
Watershed lessons can use the eastern edge and inland wooded corridors as starting points. The state greenways plan confirms that the Illinois River and La Moine River are part of the county’s water-resource context. The maps can show the land cover surrounding those broader water features, but they do not report stream flow, water quality, flood depth, levee conditions, or legal wetland boundaries.
Because Annual NLCD is a 30-meter raster classification, edge cells deserve extra caution. Forest next to cropland, a narrow stream beside a road, or a small developed lot inside a rural area may be simplified. A mixed cell can receive one dominant class even though several surfaces are present on the ground. That generalization is appropriate for regional mapping, but it limits use for site-specific decisions.
The observation year also matters. The 2025 map cannot show construction or vegetation changes that happened after the mapped period. The 1985–2025 comparison compresses forty years into a two-date view and does not identify the exact year of a transition. Current zoning, ownership, permits, drainage design, flood hazards, forest management, and parcel boundaries all require the appropriate local or state source.
Within those limits, the collection offers a detailed county-scale picture. Agriculture and forest can be compared as the two dominant covers, Rushville can be evaluated against the rural background, the eastern water-and-wetland edge can be placed in context, and mapped class differences can be screened without overstating them. The four views work best as a set because each one answers a different part of the same geographic question.
Which JPG should you use first?
Choose the general 2025 map for the broadest overview. Use the forest-and-farmland map when the contrast between 57.01% agriculture and 33.46% forest is the main story. Pick the impervious map for Rushville and road-related hard surfaces. Select the 1985–2025 map when the goal is to locate broad classification differences that deserve further research. The ZIP includes one original JPG for each view.
Frequently Asked Questions
What is the dominant land cover in Schuyler County?
Agriculture is the largest 2025 class at 57.01%, followed by forest at 33.46%. Developed land is 5.52%, wetlands are 2.61%, and water is 1.12%. The important point is that farming leads county-wide while woodland still occupies roughly one-third of the mapped area and forms a highly visible branching network.
Why does Rushville stand out so strongly on the impervious map?
Rushville is the county seat and the largest concentrated built cluster visible on the supplied maps. Mean impervious cover for the whole county is only 1.29%, and cells with at least 50% impervious surface account for 0.27%. Roads and smaller settled areas appear as thin or scattered marks, while Rushville forms the clearest compact concentration.
Does the 10.26% 1985–2025 difference mean 10.26% of the county was developed?
No. It is the share of cells with a different broad class in the two-date comparison. Cells classified as developed account for 0.67%, forest loss for 1.15%, agricultural loss for 1.21%, and other class differences for 7.10%. The map notes that classification variation may contribute to the differences, so the total should not be treated as a development-growth rate.
Map File Information
Download four original JPG maps for Schuyler County, Illinois: 2025 land cover, forest and farmland, impervious surface and developed land, and 1985–2025 land-cover class differences.
- Included Files: Use only the versions confirmed in the article and supplied images
- File Type: Use the confirmed download contents
- Intended Use: Printing, education, presentations, and map-based projects
Related Maps
- Adams County Illinois Land Cover Map
- Alexander County Illinois Land Cover Map
- Bond County Illinois Land Cover Map
Sources and References
- MRLC Annual NLCD Data — annual land-cover and related products
- USGS Annual NLCD Land Cover Classification — land-cover classes and classification background
- USGS Annual NLCD Spatial Resolution — 30-meter raster resolution
- U.S. Census Bureau TIGER/Line Shapefiles — county boundary data
- Schuyler County, Illinois official website — county-seat and local government context
- Illinois DNR Schuyler County Greenways and Trails Plan — Illinois River, La Moine River, and local natural-resource context
Green Map creates custom-edited map images using open geographic data sources such as geoBoundaries, Natural Earth, OpenStreetMap, and government open data.
These maps are edited visual materials, not raw data files, and are provided for education, documents, presentations, and graphic reference.