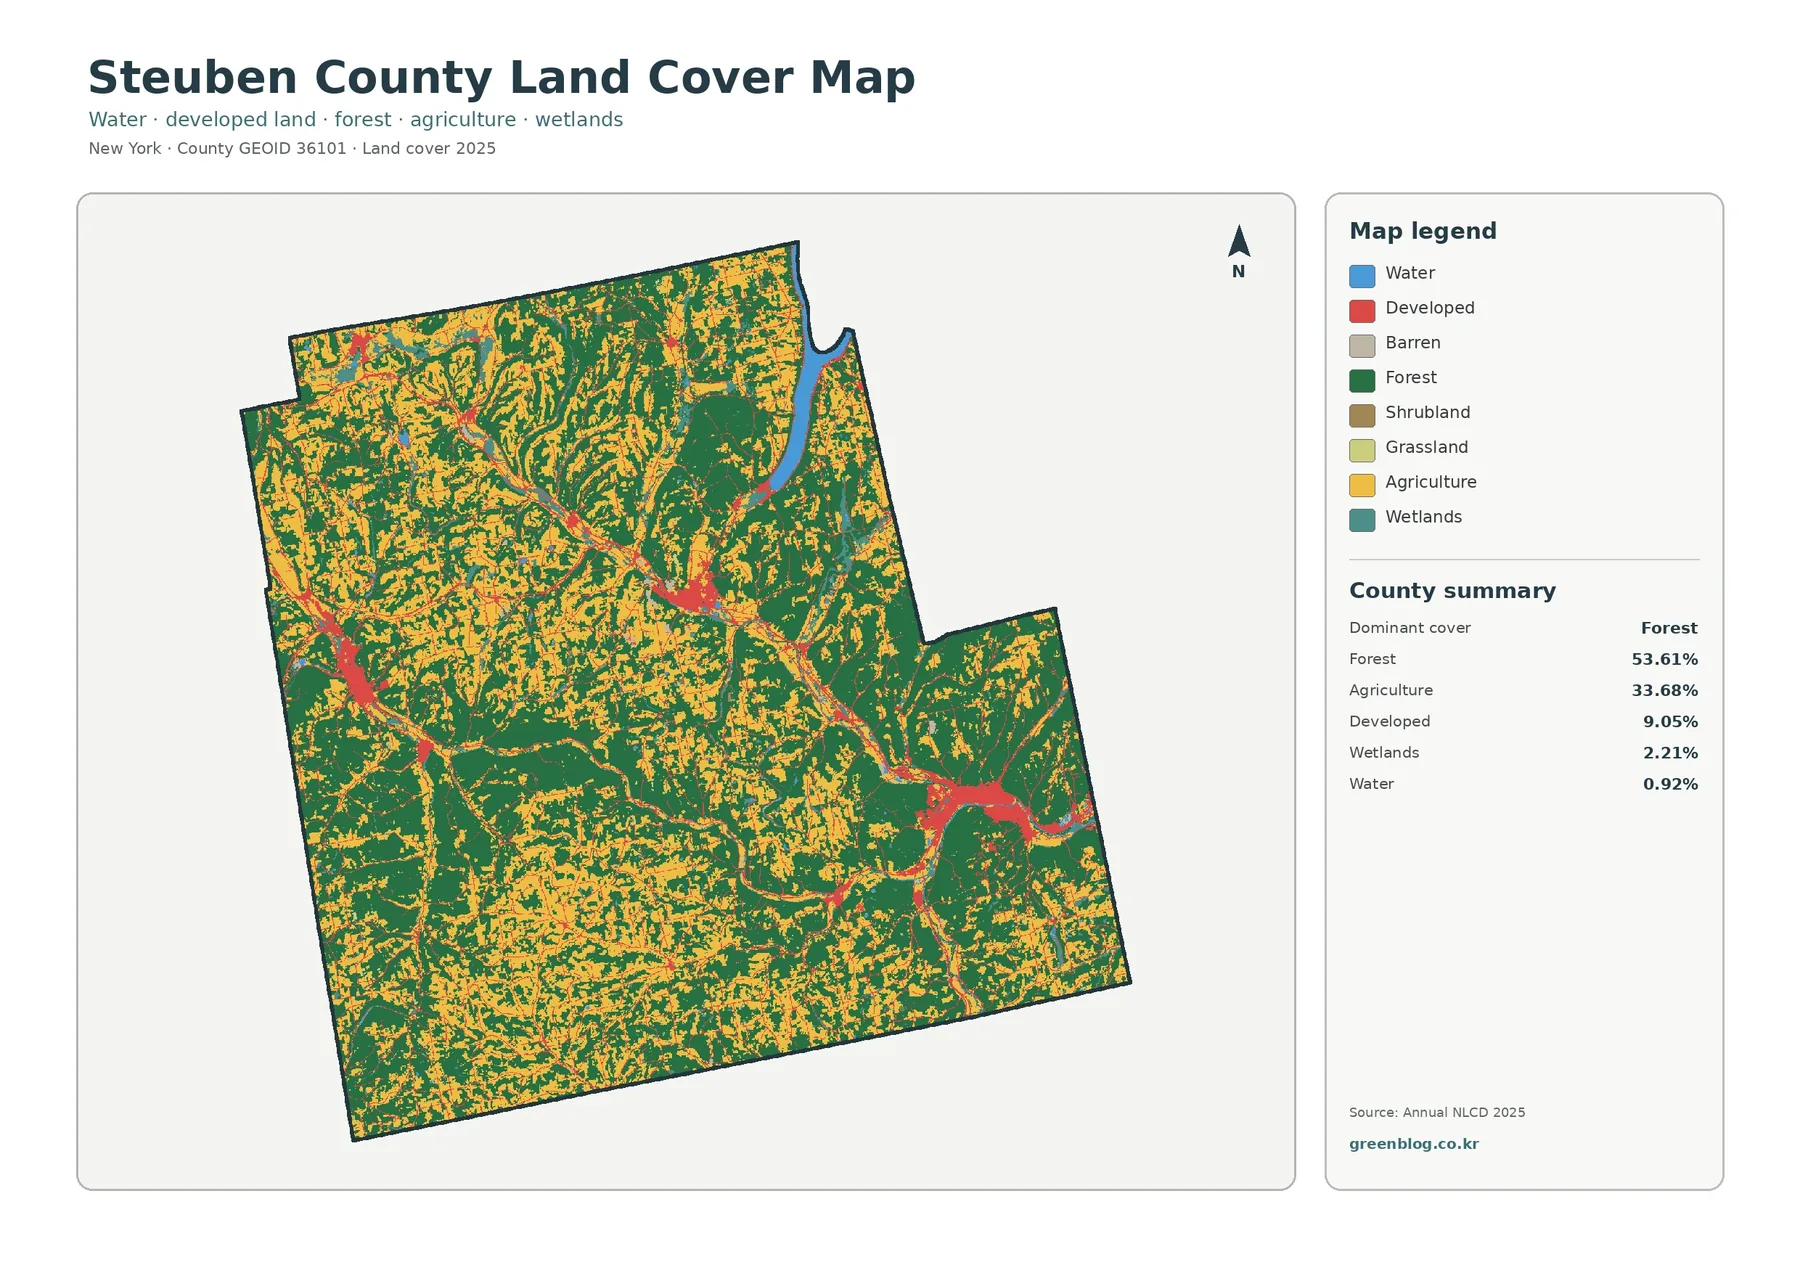
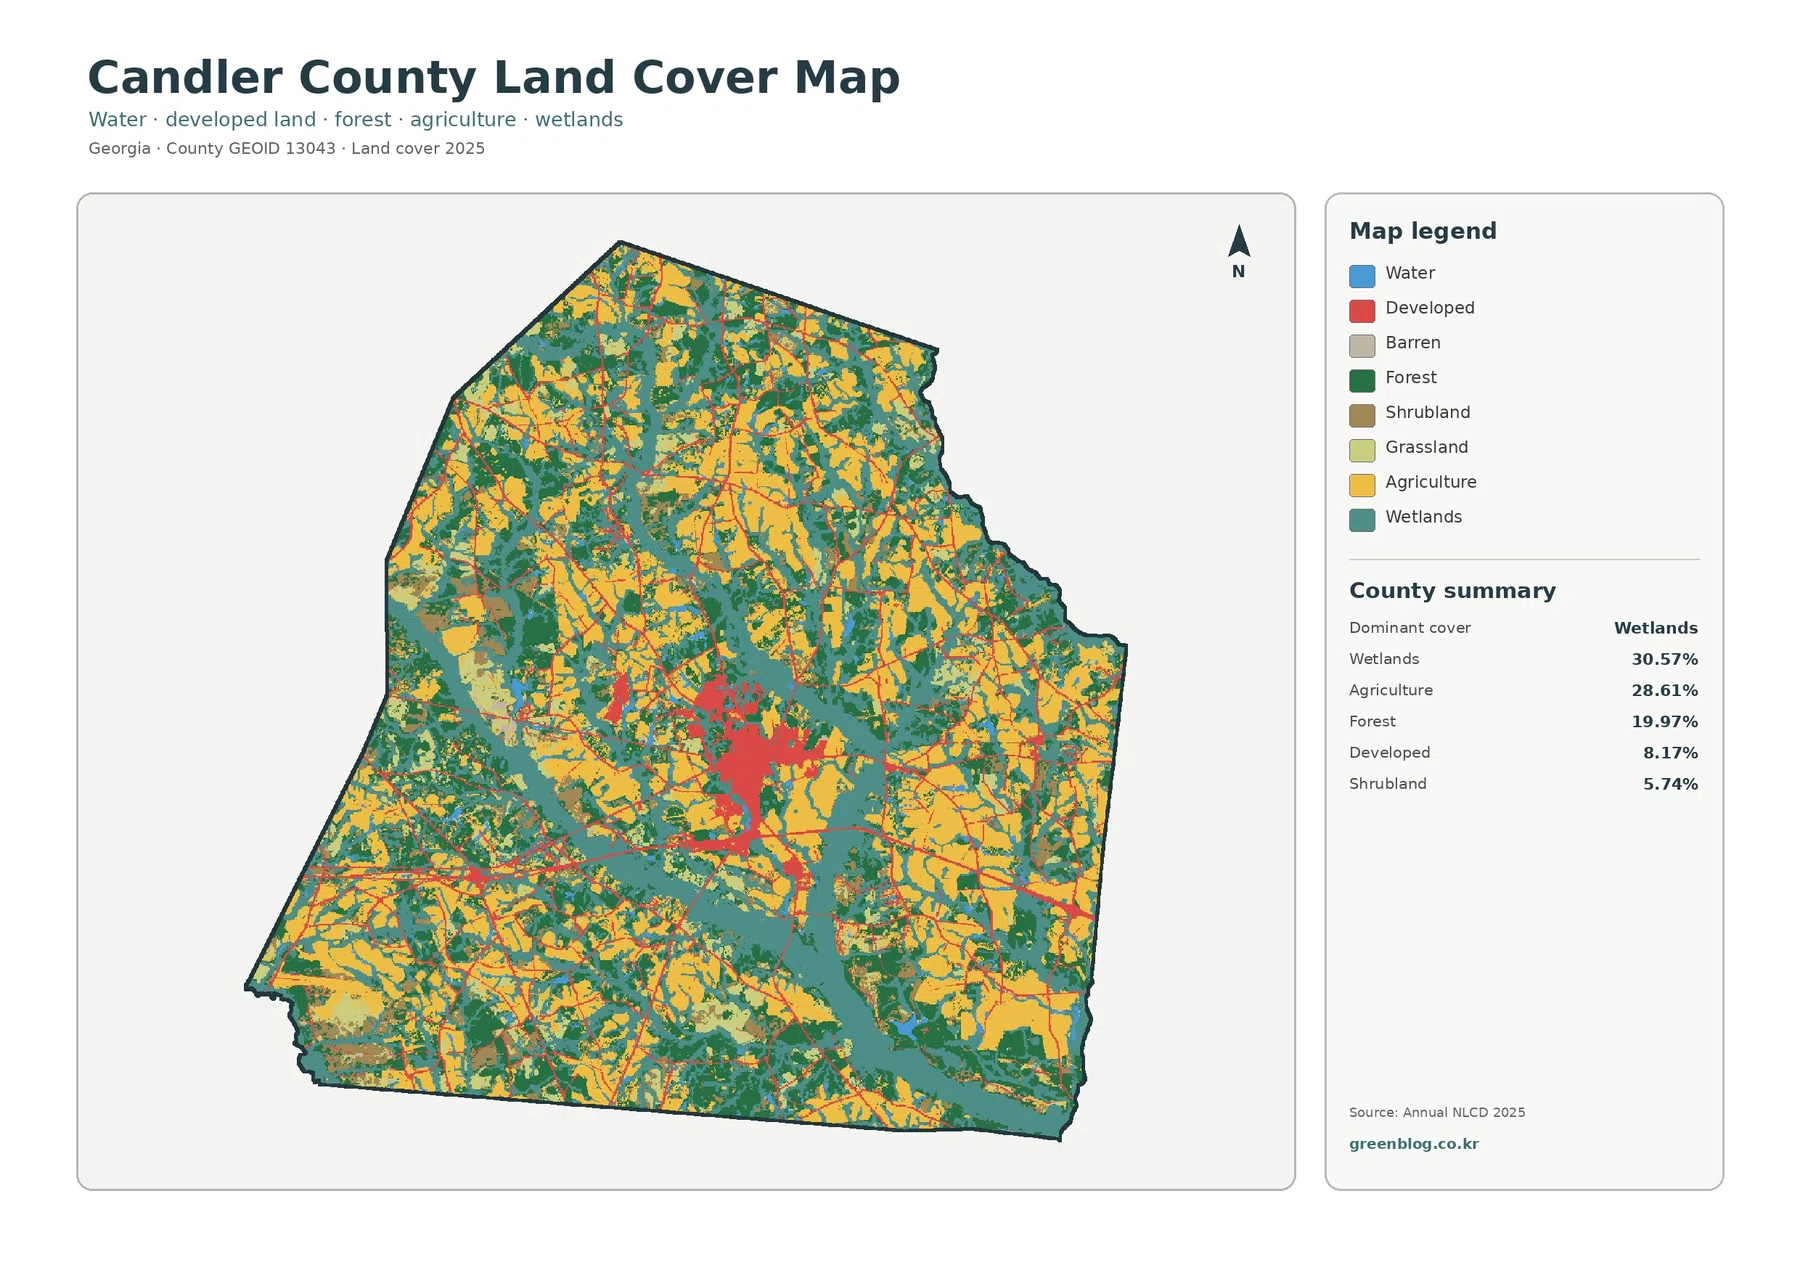
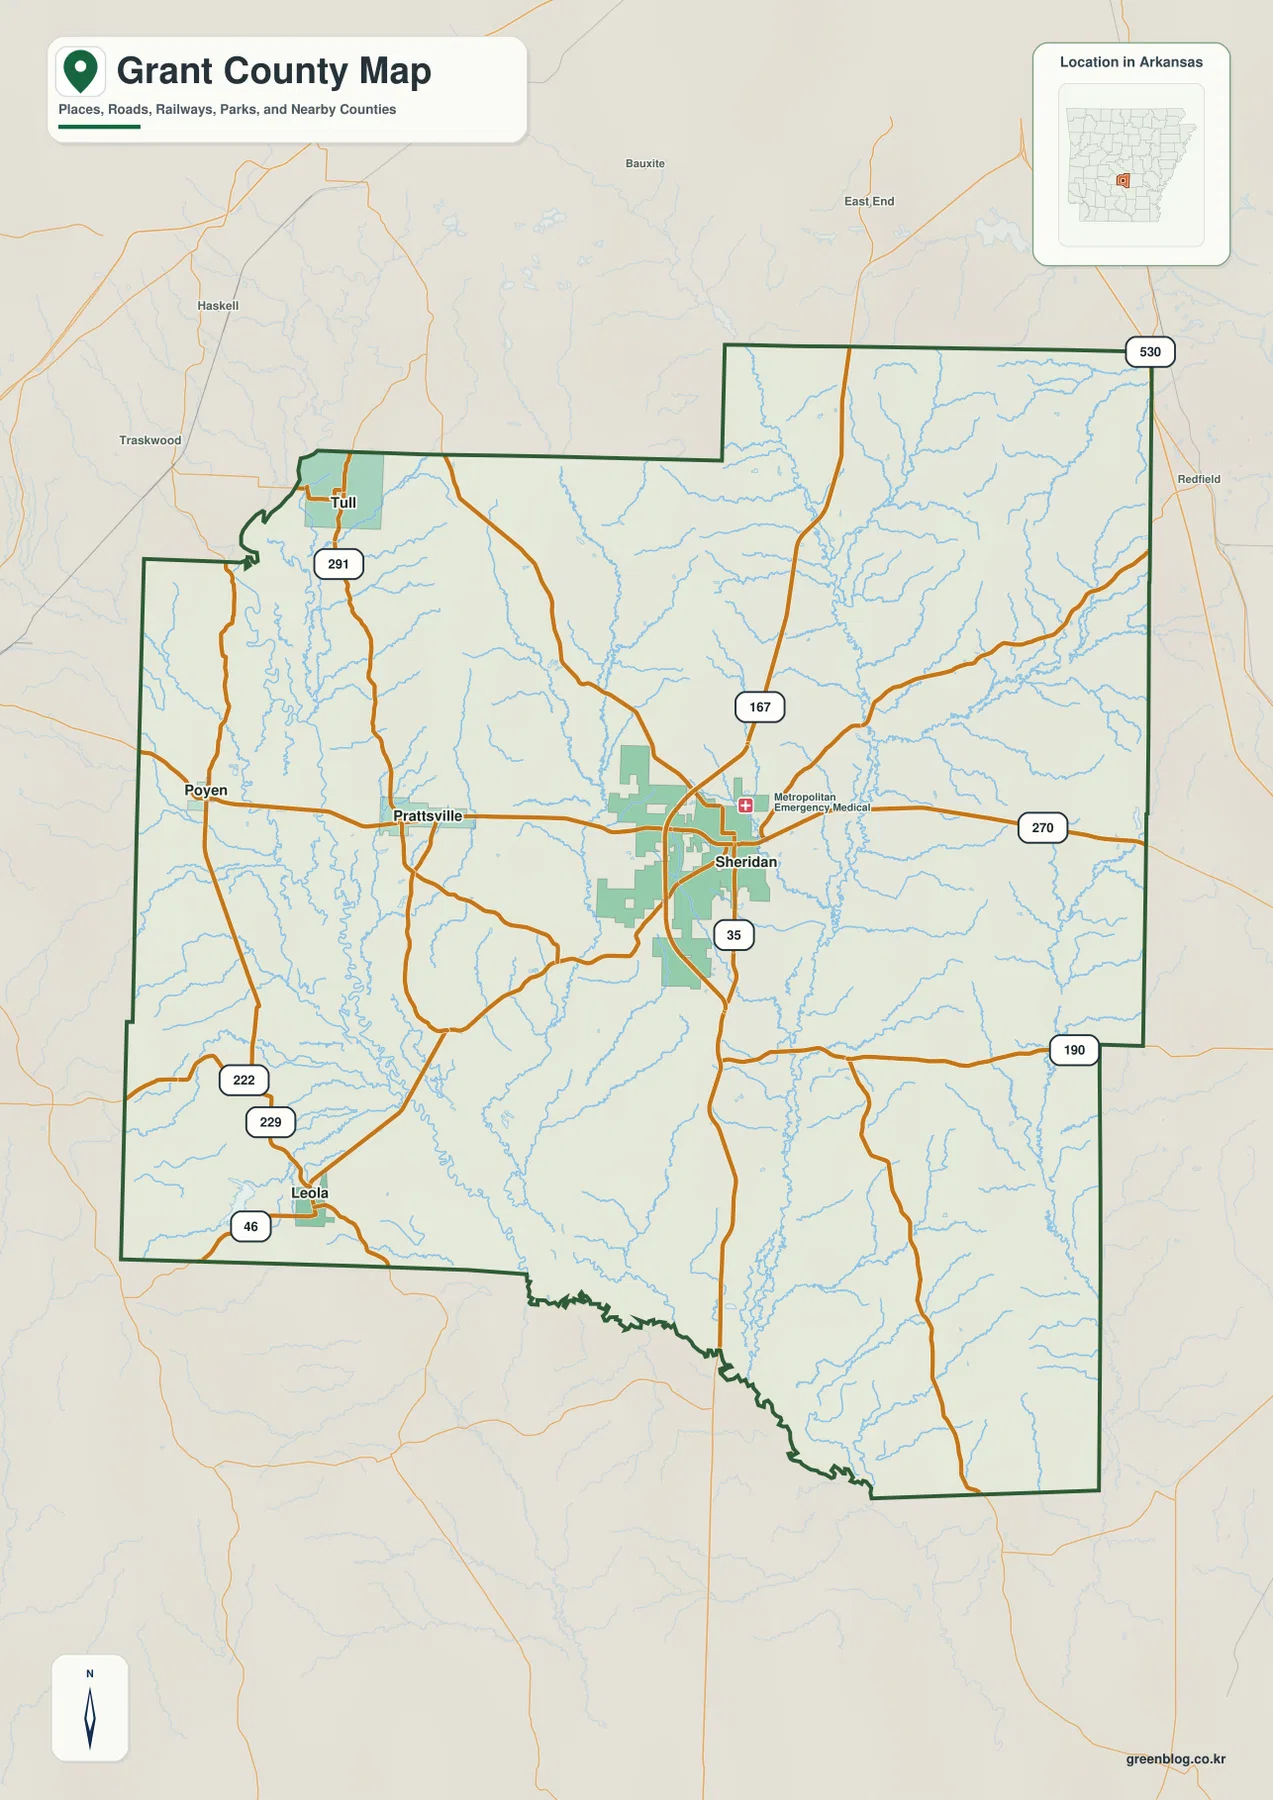
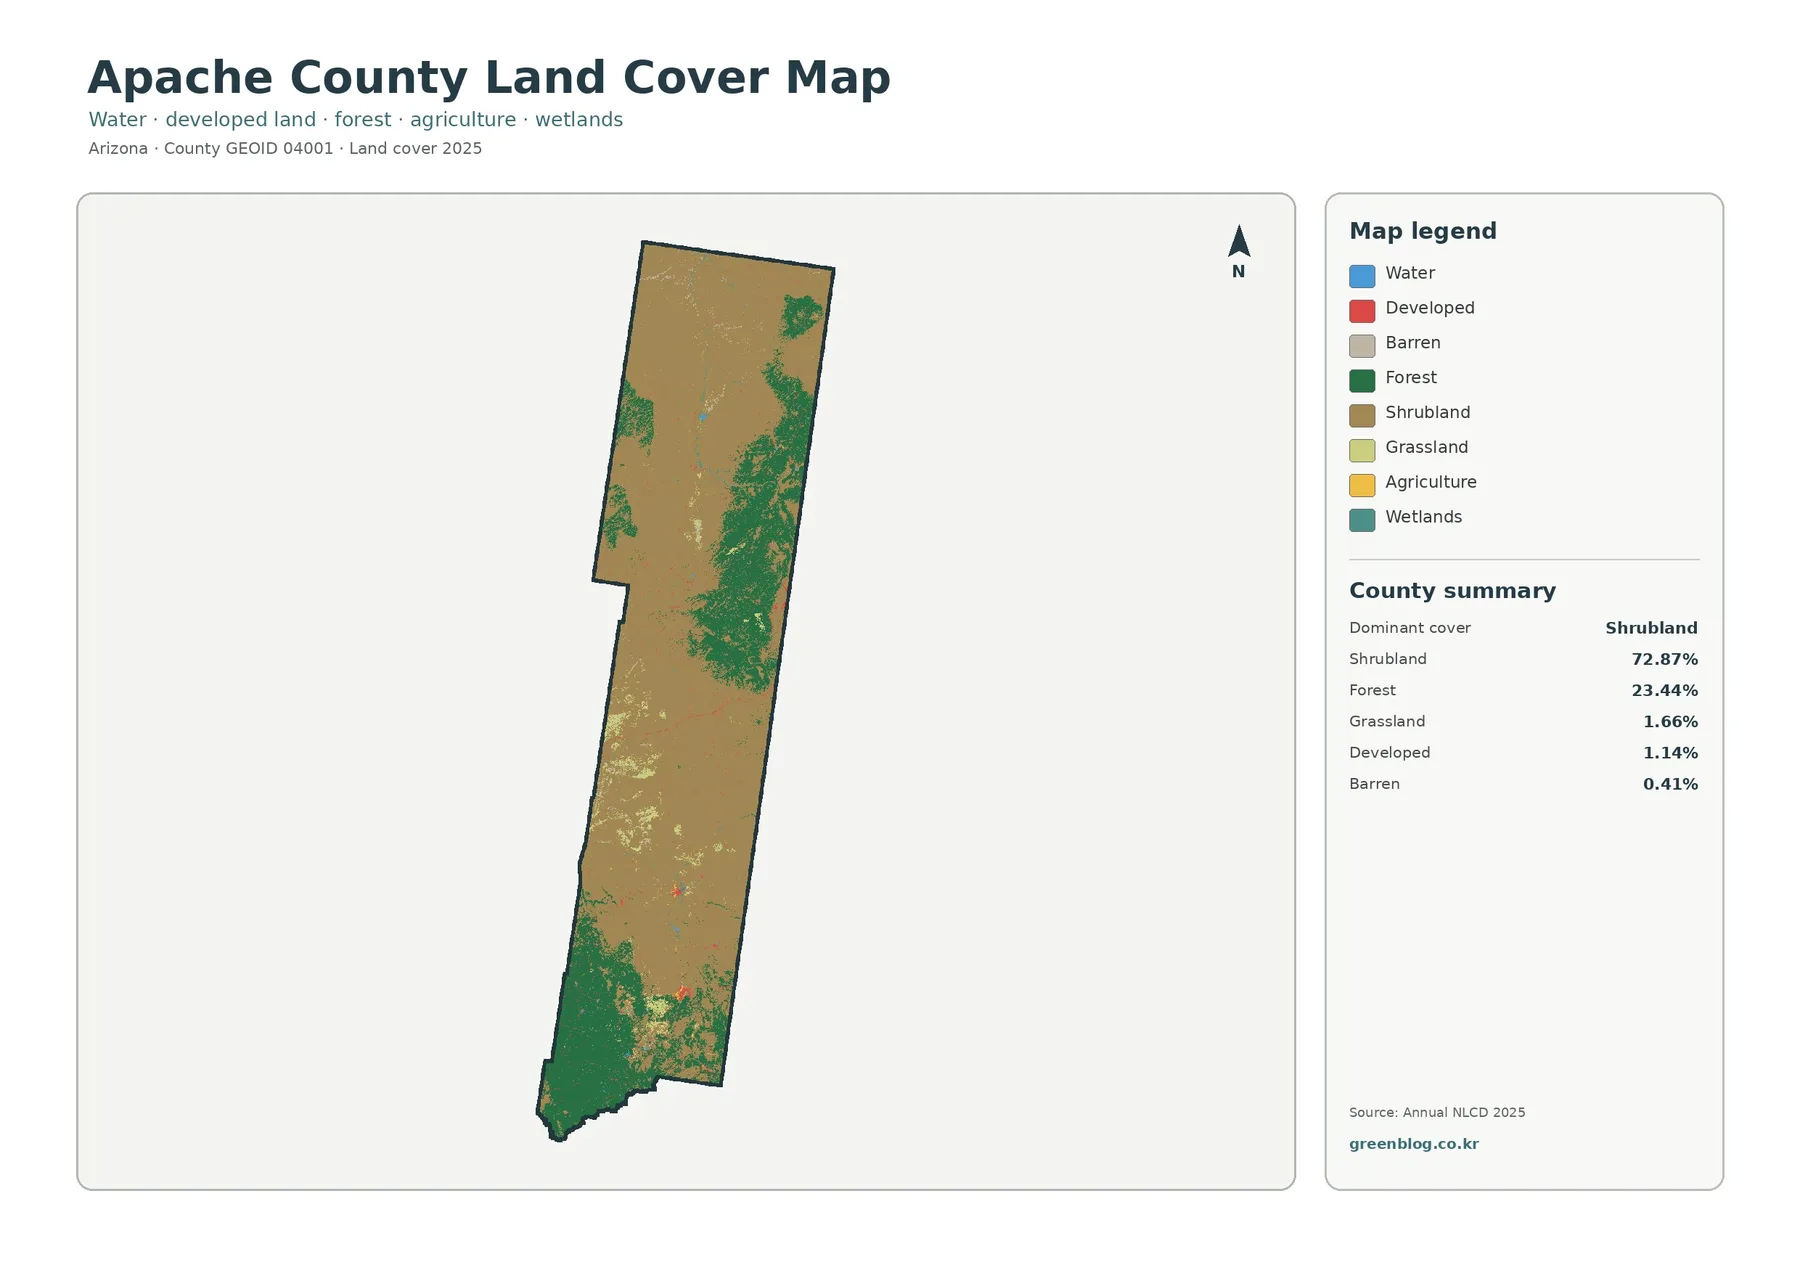
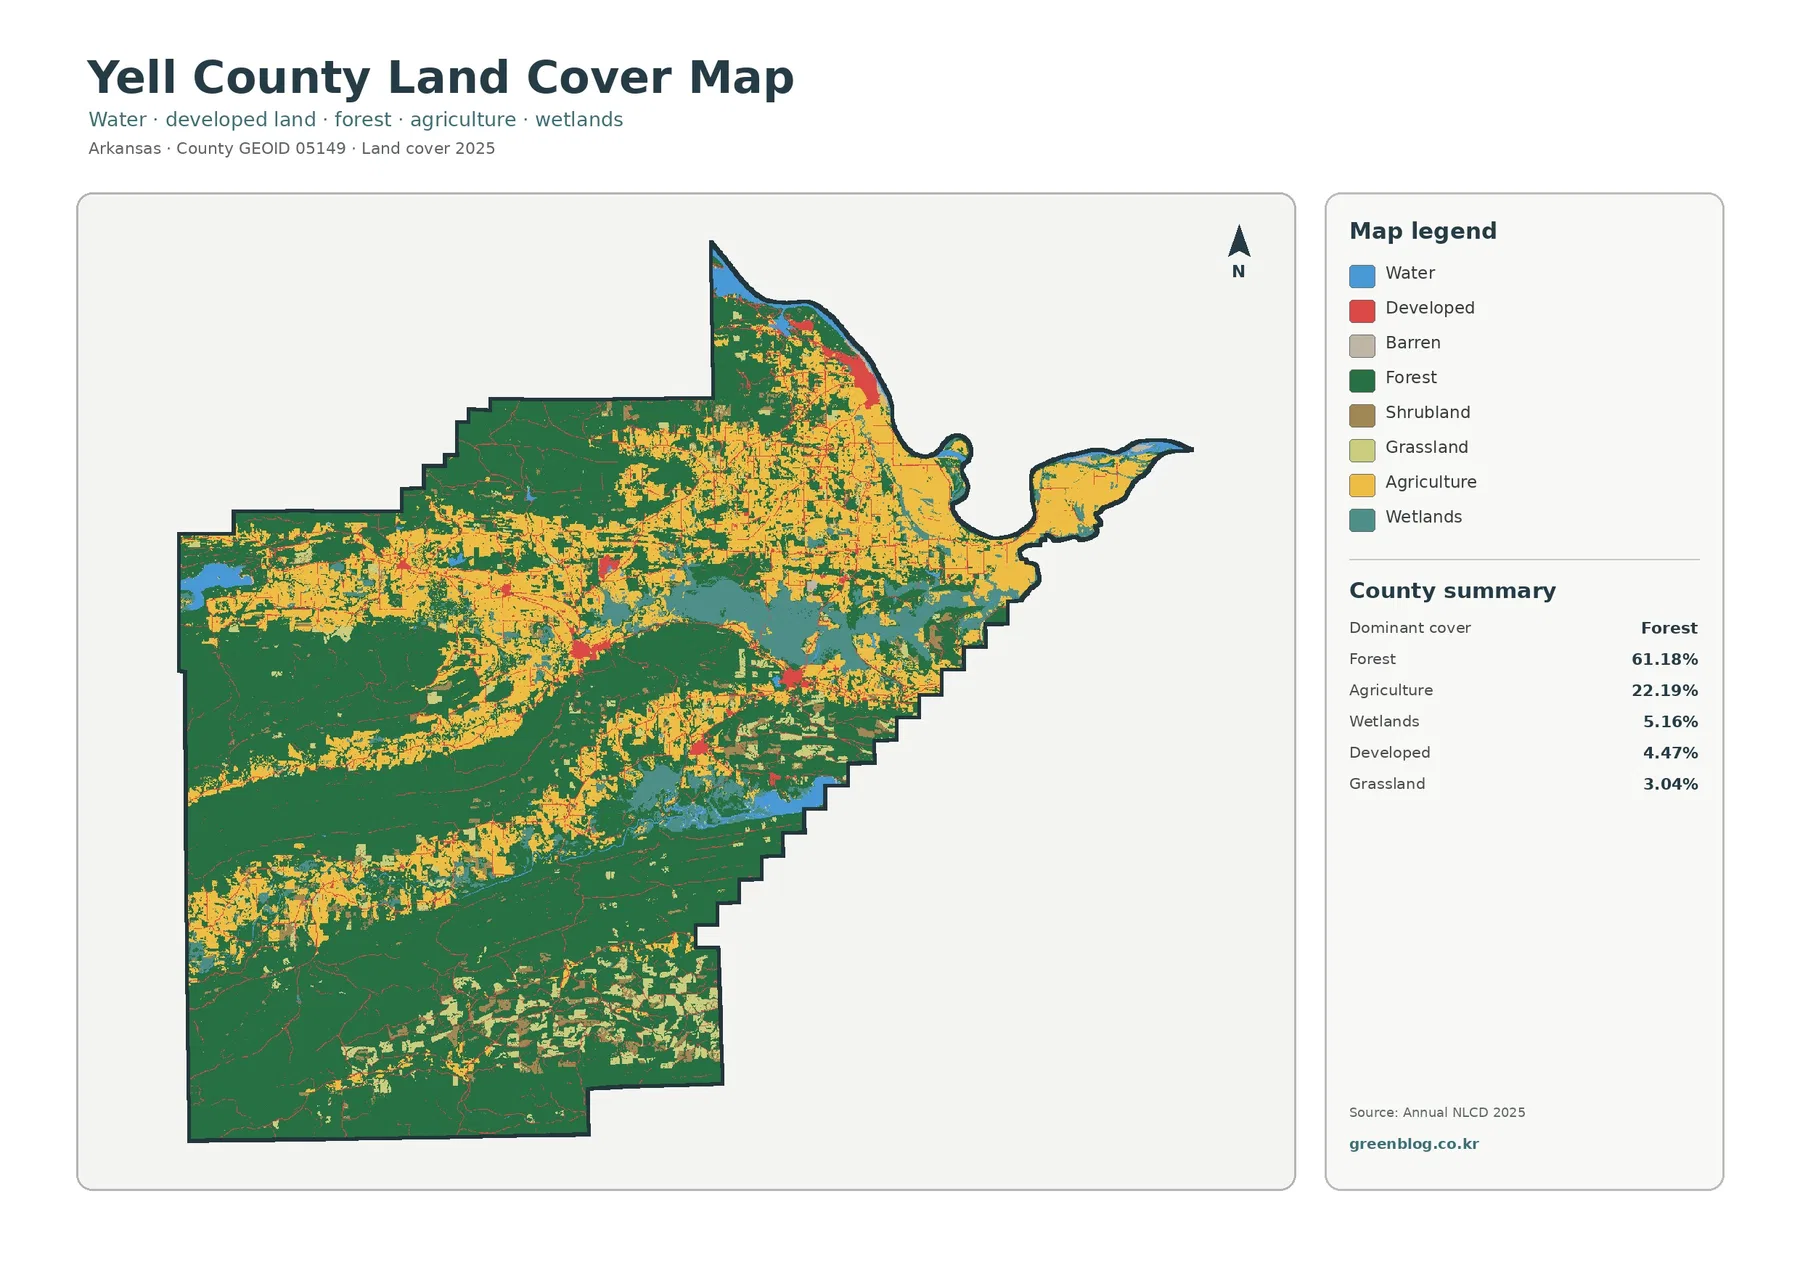
Yell County’s 2025 land-cover pattern is defined by a strong forest majority, but the county is not uniformly wooded. Forest accounts for 61.18% of the mapped area, while agriculture contributes another 22.19%. Broad forest blocks dominate much of the south and west, whereas the north and east contain more farm openings, wetlands, water, and small developed clusters. That contrast is more useful than treating the county as a single landscape type.
Four views are provided here: current land cover, forest and farmland, impervious surfaces and developed land, and mapped class differences from 1985 to 2025. The WebP images are intended for quick viewing on the page, and the four original JPG maps are available together in one ZIP. Reading the set side by side makes it easier to separate a large land-cover class from the smaller places where roads, buildings, shorelines, or class changes are concentrated.
Table of Contents
A 61.18% forest majority is strongest across the south and west, with more open land toward the north and east
The general land-cover map places the darkest forest tones across large, connected parts of southern and western Yell County. Forest also reaches into the northwest, while the middle of the county contains a more broken mixture of woods and open land. Yellow agricultural areas become more common through the northern and eastern portions, and teal wetland patches appear among them. Water is most noticeable along several edge and interior features rather than as one countywide band.
The county summary lists forest at 61.18%, agriculture at 22.19%, wetlands at 5.16%, developed land at 4.47%, and grassland at 3.04%. The forest-and-farmland view separately reports water at 1.79% and shrubland at 2.03%. Those smaller shares still matter because their locations can form visible corridors or shoreline zones. A wetland strip occupying only a few percent of the county can be more important to the appearance of one valley or lake edge than its countywide percentage suggests.
Yell County’s own local information identifies Dardanelle and Danville as its two county seats. The Association of Arkansas Counties also describes a landscape of rolling farmland, forested ridges, rugged terrain, and several lakes. Those descriptions fit the broad map pattern without turning the map into a topographic or administrative product. The land-cover layer tells us what is covering the ground; it does not draw municipal limits, property boundaries, or elevation contours.
Dardanelle and Danville stand out more clearly on the impervious map than on the countywide percentages
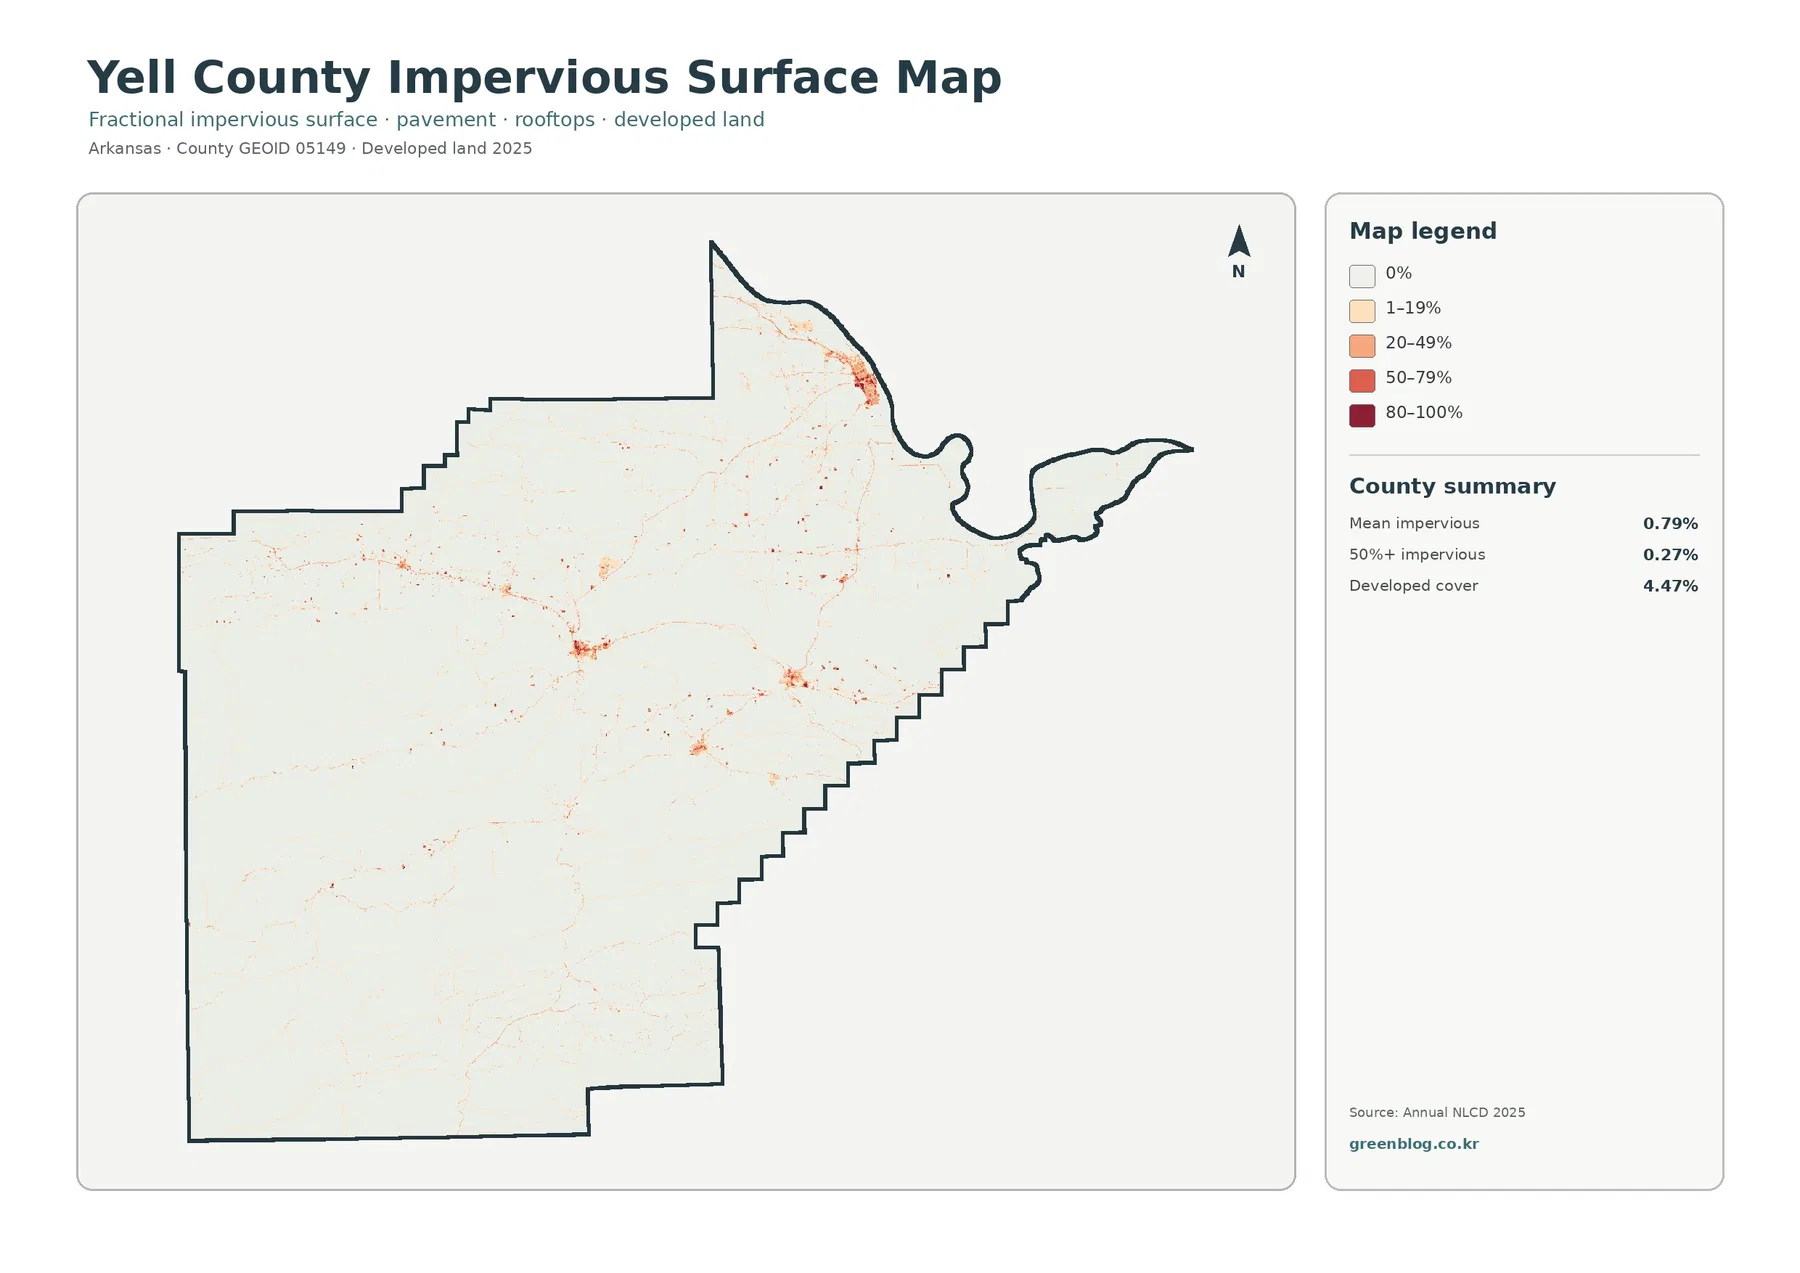
Developed land makes up 4.47% of the current land-cover summary, yet the mean impervious value is only 0.79%. Impervious surface means hard cover such as rooftops, paved roads, and parking areas where water does not readily soak into the ground. A developed land-cover class can include lawns, trees, soil, and other permeable surfaces, so it should not be expected to match the impervious percentage.
Dark impervious colors remain limited to a few small concentrations and narrow connecting lines. The larger cluster near the northern edge is consistent with the Dardanelle area, while a smaller interior concentration corresponds to the Danville area and nearby roads. Most of the county remains very light on this map. Only 0.27% is shown as 50% or more impervious, emphasizing how small the hardest-surfaced areas are relative to the surrounding forest and agricultural land.
This layer is useful for locating concentrations of roofs and pavement, but it should not be treated as a city-boundary map. A road can appear as a thin high-impervious line while the neighboring raster cells remain mostly forest or farmland. Likewise, a developed classification can extend beyond the darkest impervious pixels because it represents a broader land-cover category rather than a parcel-by-parcel inventory.
Farm openings and wet areas become easier to follow when the forest-and-farmland classes are separated
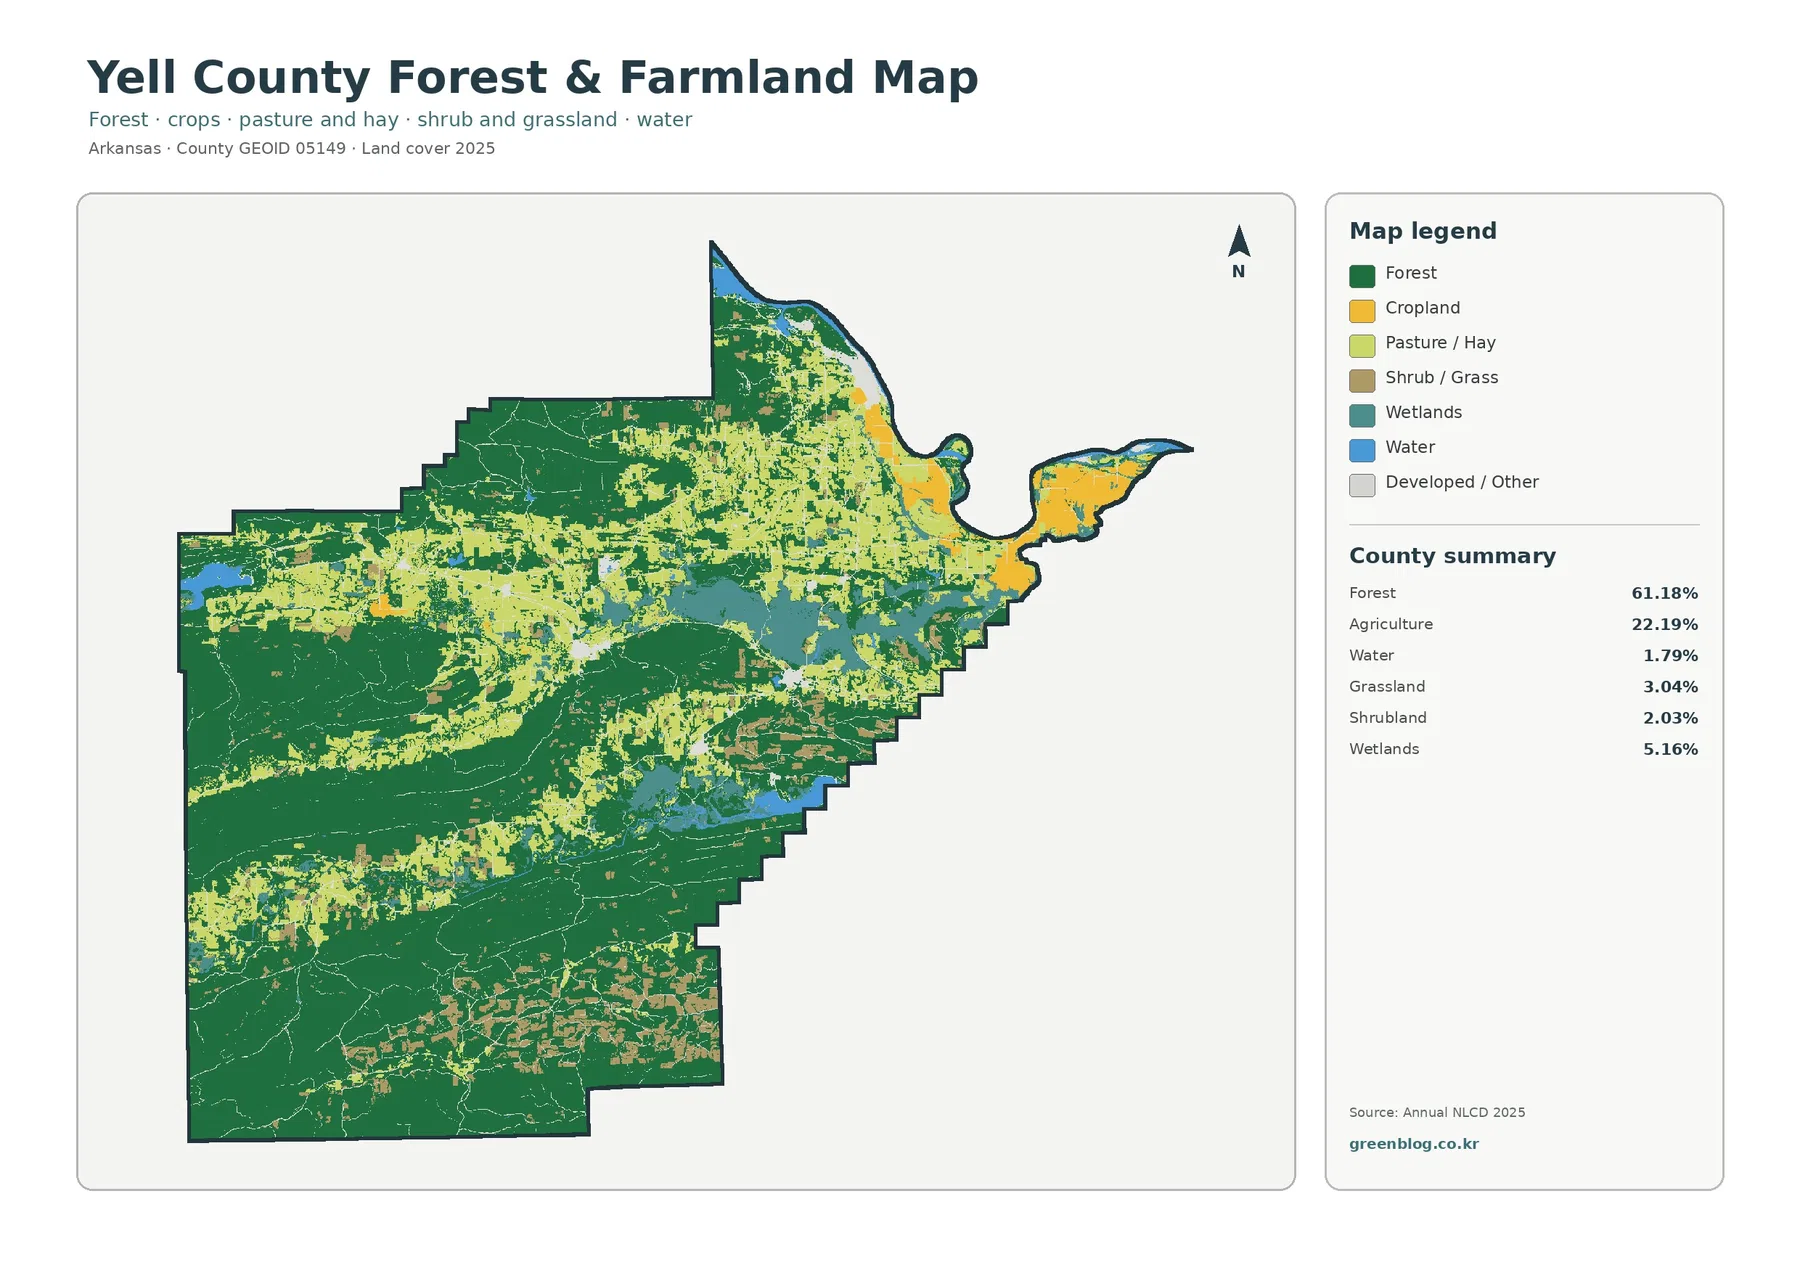
The forest-and-farmland map reduces the number of categories and makes the boundary between wooded and open ground easier to follow. Forest remains the dominant class across the broad southern and western blocks. Cropland and pasture or hay appear more often through the northern and eastern parts of the county, with smaller open patches threaded through the middle. The result is not a clean straight division: wooded slopes, agricultural openings, and wet areas interlock in many places.
Agriculture totals 22.19%, but the map does not identify a crop on each field. The University of Arkansas Cooperative Extension maintains a Yell County office for agriculture and community education, which is a useful local source when more specific agricultural information is needed. The land-cover map itself stays at a broader level. It can show where agricultural cover is mapped, but not farm ownership, field boundaries, planting schedules, or the crop grown on a particular parcel.
Water is listed at 1.79% and wetlands at 5.16%. Regional county information names the Arkansas River, Lake Dardanelle, Nimrod Lake, and Blue Mountain Lake among Yell County’s important water features. On the map, blue water and teal wetland areas occupy several distinct settings, including northern and interior edges of open land. Looking at water and wetlands together is especially helpful because a shoreline can contain both open water and adjacent wet or vegetated cover.
Grassland at 3.04% and shrubland at 2.03% provide another reminder that not every non-forest patch is farmland. These classes can occupy small openings near woods or agricultural areas. Keeping them separate prevents an oversimplified forest-versus-farm reading and makes the transition zones around larger forest blocks easier to understand.
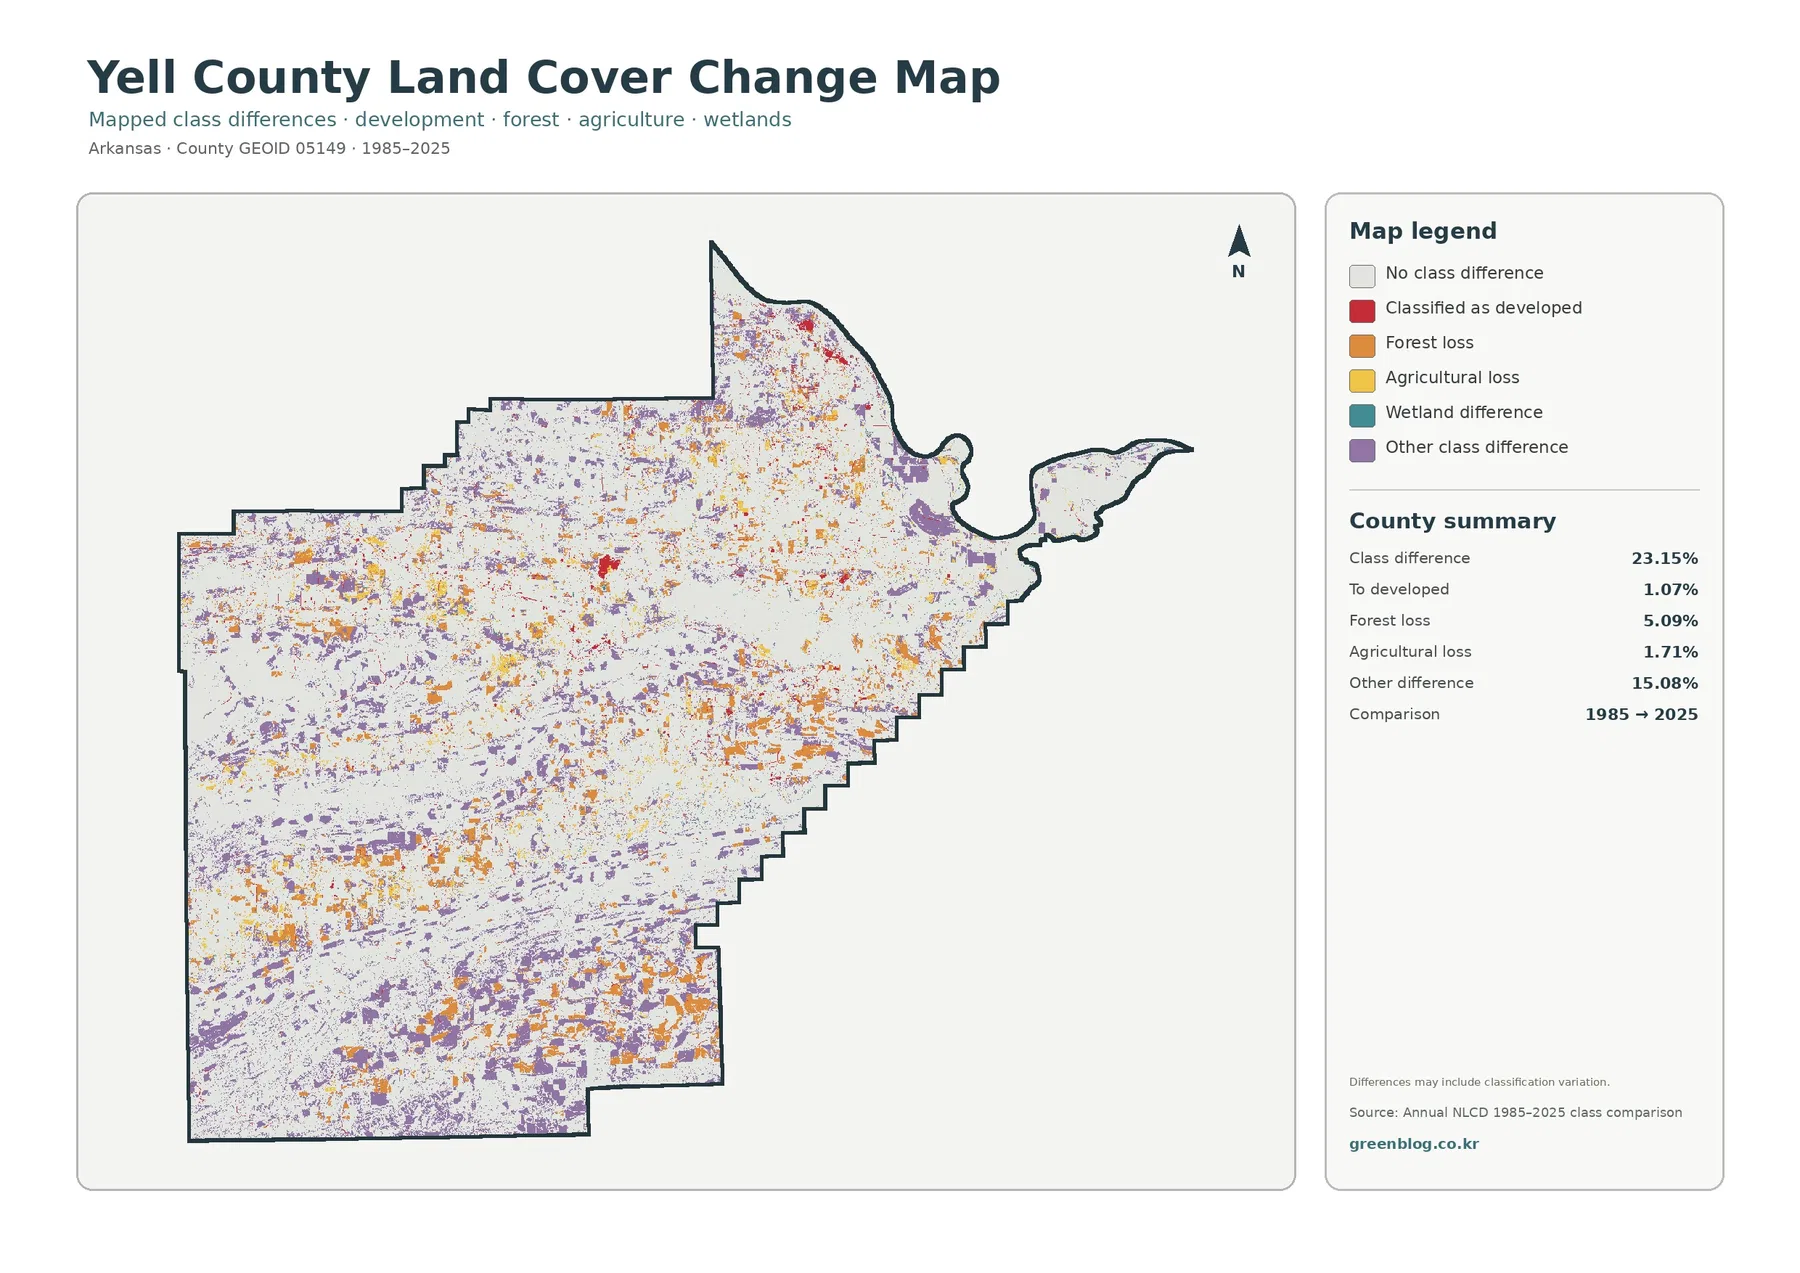
The 1985–2025 map marks class differences across 23.15%, but most of that total is not mapped as development
The change map needs a different reading from the three current-condition maps. Its county summary reports a class difference across 23.15% of the comparison area between 1985 and 2025. Colored cells are scattered across much of Yell County rather than being confined to one growth center. The broad distribution means the map is showing many kinds of classification difference, not simply the outward expansion of towns.
Only 1.07% is labeled as a change to developed land. Forest loss is reported at 5.09%, agricultural loss at 1.71%, and other class difference at 15.08%. The large ‘other difference’ value is essential context: most of the total class difference falls outside the three specifically labeled loss or development categories. A reader should therefore avoid describing 23.15% as urbanization, deforestation, or agricultural abandonment.
The map itself warns that differences may include classification variation. Satellite observation dates, changing classification methods, and mixed pixels can all affect the category assigned to a raster cell. Where forest, pasture, wetlands, and agricultural openings meet in small pieces, a cell near a boundary may be assigned differently in two years even when the real-world change is subtle. For exact acreage of clearing, development, or land-use conversion, this comparison should be paired with field, parcel, or program-specific records.
Lake and river settings help explain why small water and wetland percentages can be visually important
Yell County is associated with several large water features even though open water occupies only 1.79% in the county summary. Lake Dardanelle and the Arkansas River are part of the northern landscape, while Nimrod Lake and Blue Mountain Lake are also identified in county information. The land-cover maps do not label every shoreline, but blue and teal areas around these settings make it clear that water-related cover is concentrated rather than evenly spread.
That concentration matters when comparing neighboring land-cover classes. Agricultural cover may approach a shoreline in one area, while forest or wetland cover forms the edge in another. The map can show those broad juxtapositions without proving why they occur. Terrain, water management, soils, land ownership, and land-use history may all matter, but a color pattern by itself is evidence of location and association, not of a single cause.
For a classroom or watershed discussion, begin with the blue water features and trace the adjoining wetland color. Then note whether forest or agricultural cover becomes dominant farther from the shoreline. Repeating that sequence at more than one lake or river segment reveals how variable the surrounding landscape can be within the same county.
Using all four maps together avoids common mistakes that come from reading one layer by itself
The general map is the best starting point for overall composition because it keeps developed land, forest, agriculture, wetlands, water, and other classes in one view. The forest-and-farmland map is better when the main question is how wooded ground relates to agricultural and open cover. The impervious map isolates roofs and pavement, and the change map identifies cells whose classification differs between the two comparison years.
These maps can support county-scale reference work, environmental education, presentations, and preliminary landscape comparisons. A student comparing forest and agriculture can use the simplified map, while someone discussing settlement patterns may find the impervious layer clearer. A watershed-oriented presentation can focus on water and wetland edges, then use the change map to flag places that deserve closer investigation. The set works best as a guide to where to look next, not as a replacement for site-level data.
The four JPG maps in the download have a size of 2480×1754 pixels each. The package marks that size as below its A3 high-resolution reference, so large-format printing should be tested before final use. On-screen WebP previews are convenient for browsing, while the JPG files are preferable when a larger source image is needed for a slide, worksheet, or moderate-size print.
Land cover describes the ground surface; it does not establish zoning, ownership, or development rights
Annual NLCD-style land cover is a raster classification derived from remotely sensed information and supporting data. A raster divides the landscape into grid cells and assigns a representative class. Real places are more complicated: a single cell can contain trees, pavement, grass, soil, and water. That mixed-pixel effect is one reason small edges may look blocky or may switch categories between observation years.
A forest-colored cell does not prove that a parcel is protected forest, and an agricultural cell does not establish a legal farm boundary. Wetland color is not a regulatory wetland determination, while developed color does not define a zoning district or building permit area. Property, zoning, regulatory, and engineering decisions require the current official records and site-specific information from the appropriate agency.
Download the four JPG maps when you need the current views and the long-term comparison in one set
The ZIP contains one JPG for the 2025 land-cover map, one for the forest-and-farmland view, one for impervious surfaces and developed land, and one for the 1985–2025 class-difference map. Keeping all four together makes it easier to compare the same county boundary without switching between unrelated sources or map layouts.
Frequently Asked Questions
What is the dominant land cover in Yell County?
Forest is the largest 2025 class at 61.18%, followed by agriculture at 22.19%. The broadest forest blocks appear across much of the south and west, while more farm openings, wetlands, water, and developed patches occur toward the north and east.
Why is developed land 4.47% when mean impervious surface is only 0.79%?
Developed land can include permeable surfaces such as lawns, trees, and soil as well as buildings and pavement. The impervious layer focuses more directly on hard surfaces such as roofs, paved roads, and parking areas, so its countywide mean can be much lower.
Does the 23.15% 1985–2025 class difference mean that nearly a quarter of Yell County was developed?
No. Only 1.07% is labeled as change to developed land. The map separately reports 5.09% forest loss, 1.71% agricultural loss, and 15.08% other class difference, and it notes that classification variation may be included.
Map File Information
The ZIP contains four original JPG maps for Yell County: 2025 land cover, forest and farmland, impervious surfaces and developed land, and the 1985–2025 land-cover change comparison.
- File Type: ZIP containing four JPG files
Related Maps
- A Craighead County Arkansas Land Cover Map
- Arkansas County Arkansas Land Cover Map
- Ashley County Arkansas Land Cover Map
Sources and References
Percentages and 1985–2025 change values cited above come from the supplied Yell County map package. The links below provide official or trusted context for Annual NLCD classes, county boundaries, local government, agriculture, and the county’s water and landscape setting.
- MRLC Annual NLCD Data — official access point for Annual NLCD land-cover products.
- USGS Annual NLCD Land Cover Classification — explains the land-cover classes used in Annual NLCD products.
- Yell County, Arkansas Official Website — local government information and county background, including Danville and Dardanelle.
- University of Arkansas Cooperative Extension – Yell County — the county Extension office for agriculture and community education.
- Association of Arkansas Counties – Yell County — county overview covering local landscapes and water features such as the Arkansas River, Lake Dardanelle, Nimrod Lake, and Blue Mountain Lake.
- U.S. Census Bureau TIGER/Line Shapefiles — official geographic boundary data used for county mapping.
Green Map creates custom-edited map images using open geographic data sources such as geoBoundaries, Natural Earth, OpenStreetMap, and government open data.
These maps are edited visual materials, not raw data files, and are provided for education, documents, presentations, and graphic reference.