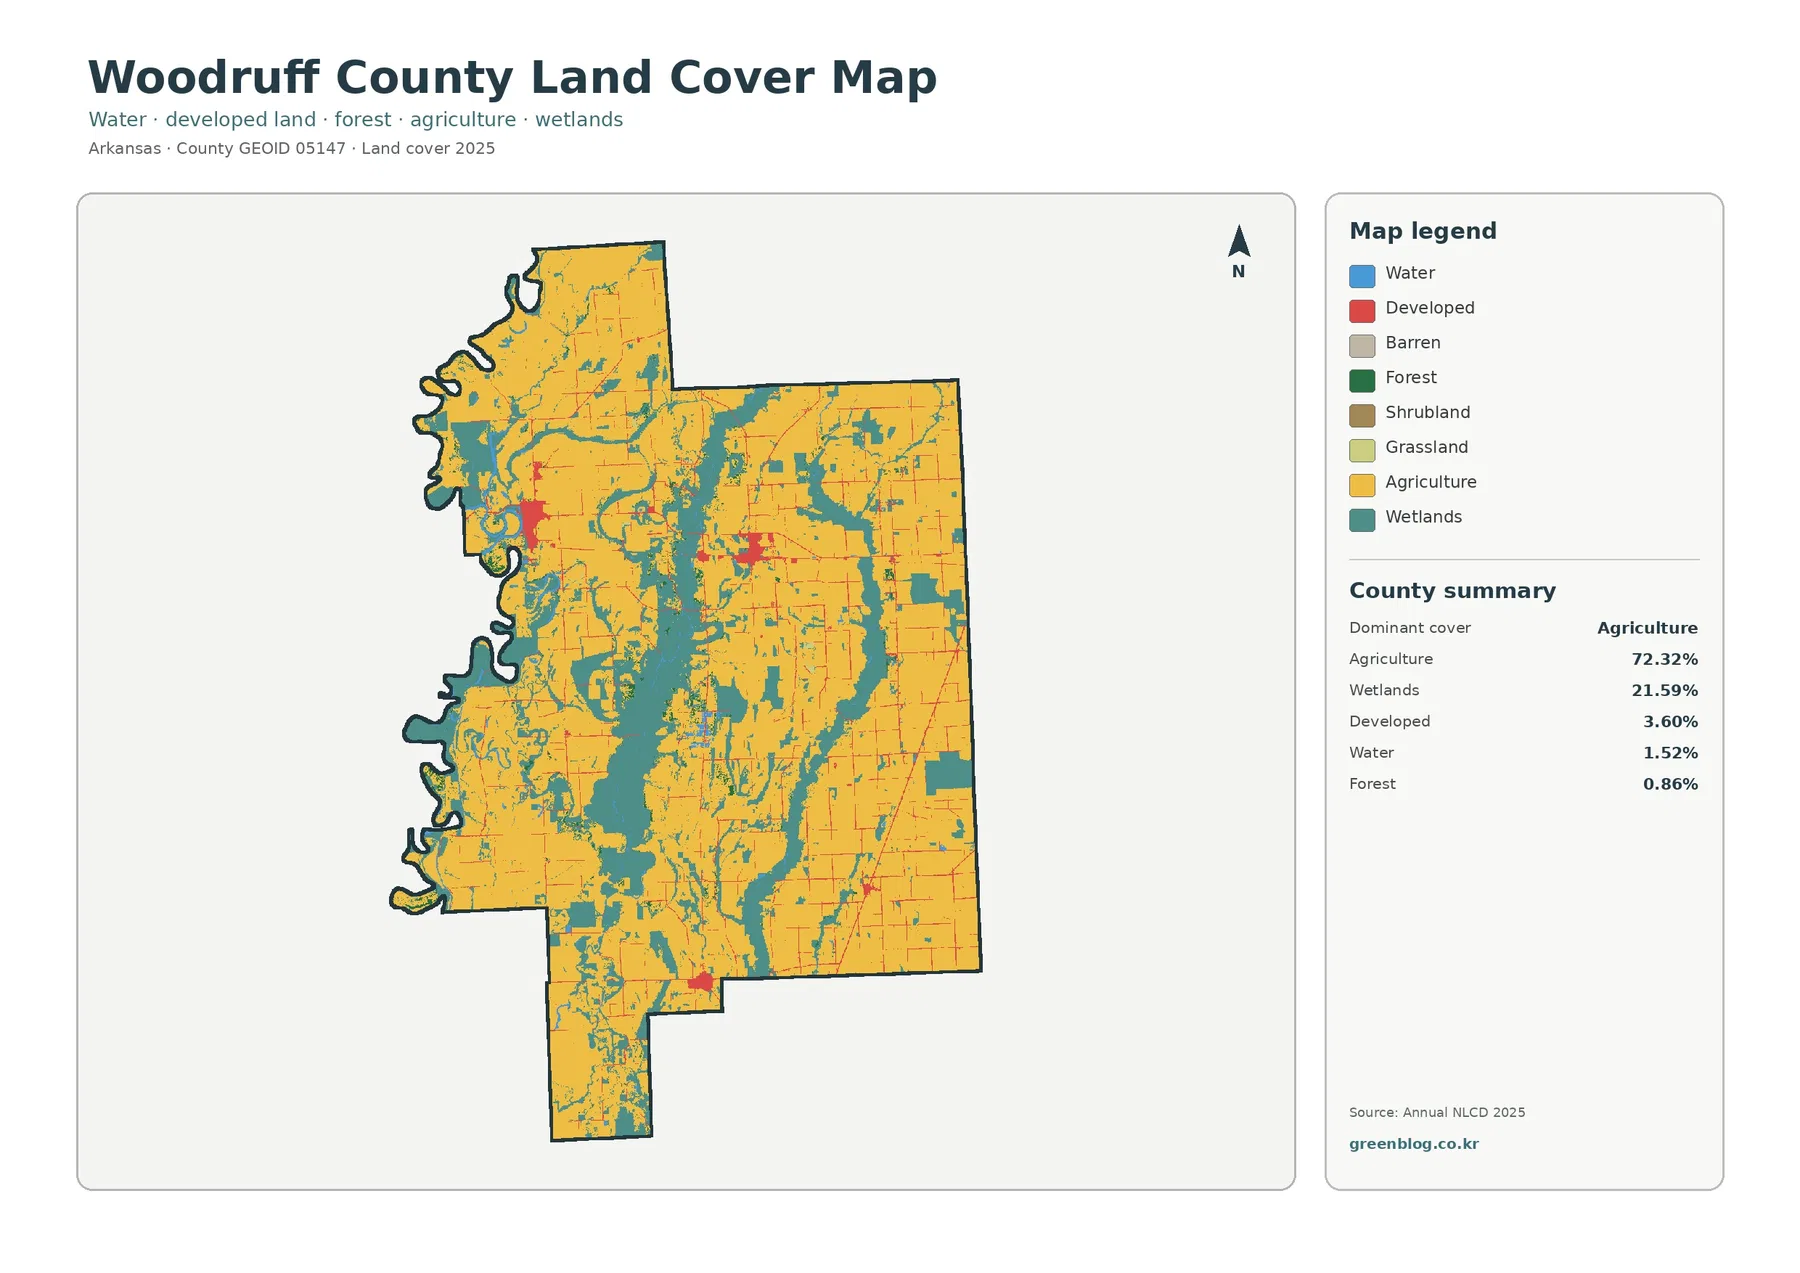
Woodruff County is dominated by two land-cover settings that are easy to recognize on the 2025 map: broad agricultural ground and long wetland corridors. Agriculture accounts for 72.32% of the county, while wetlands make up 21.59%. Instead of appearing as isolated ponds, many wetland areas form irregular bands through the farmed landscape and along the county’s western side.
Four views are provided here to separate those patterns: current land cover, forest and farmland, impervious surface, and mapped class differences from 1985 to 2025. The WebP images are intended for quick viewing on the page. A single download contains the four original JPG maps for printing, classroom comparison, presentations, or closer reference away from the website.
Table of Contents
Wetland corridors break up an otherwise strongly agricultural county
The current land-cover map is mostly agricultural yellow, but the county does not read as one uninterrupted farm block. Teal wetland areas cut through the center in long, branching shapes and recur along the irregular western boundary. The contrast is especially useful because agriculture and wetlands together account for well over nine-tenths of the county. The map therefore says more about the relationship between cultivated ground and low, wet corridors than it does about a balance among many equally large cover types.
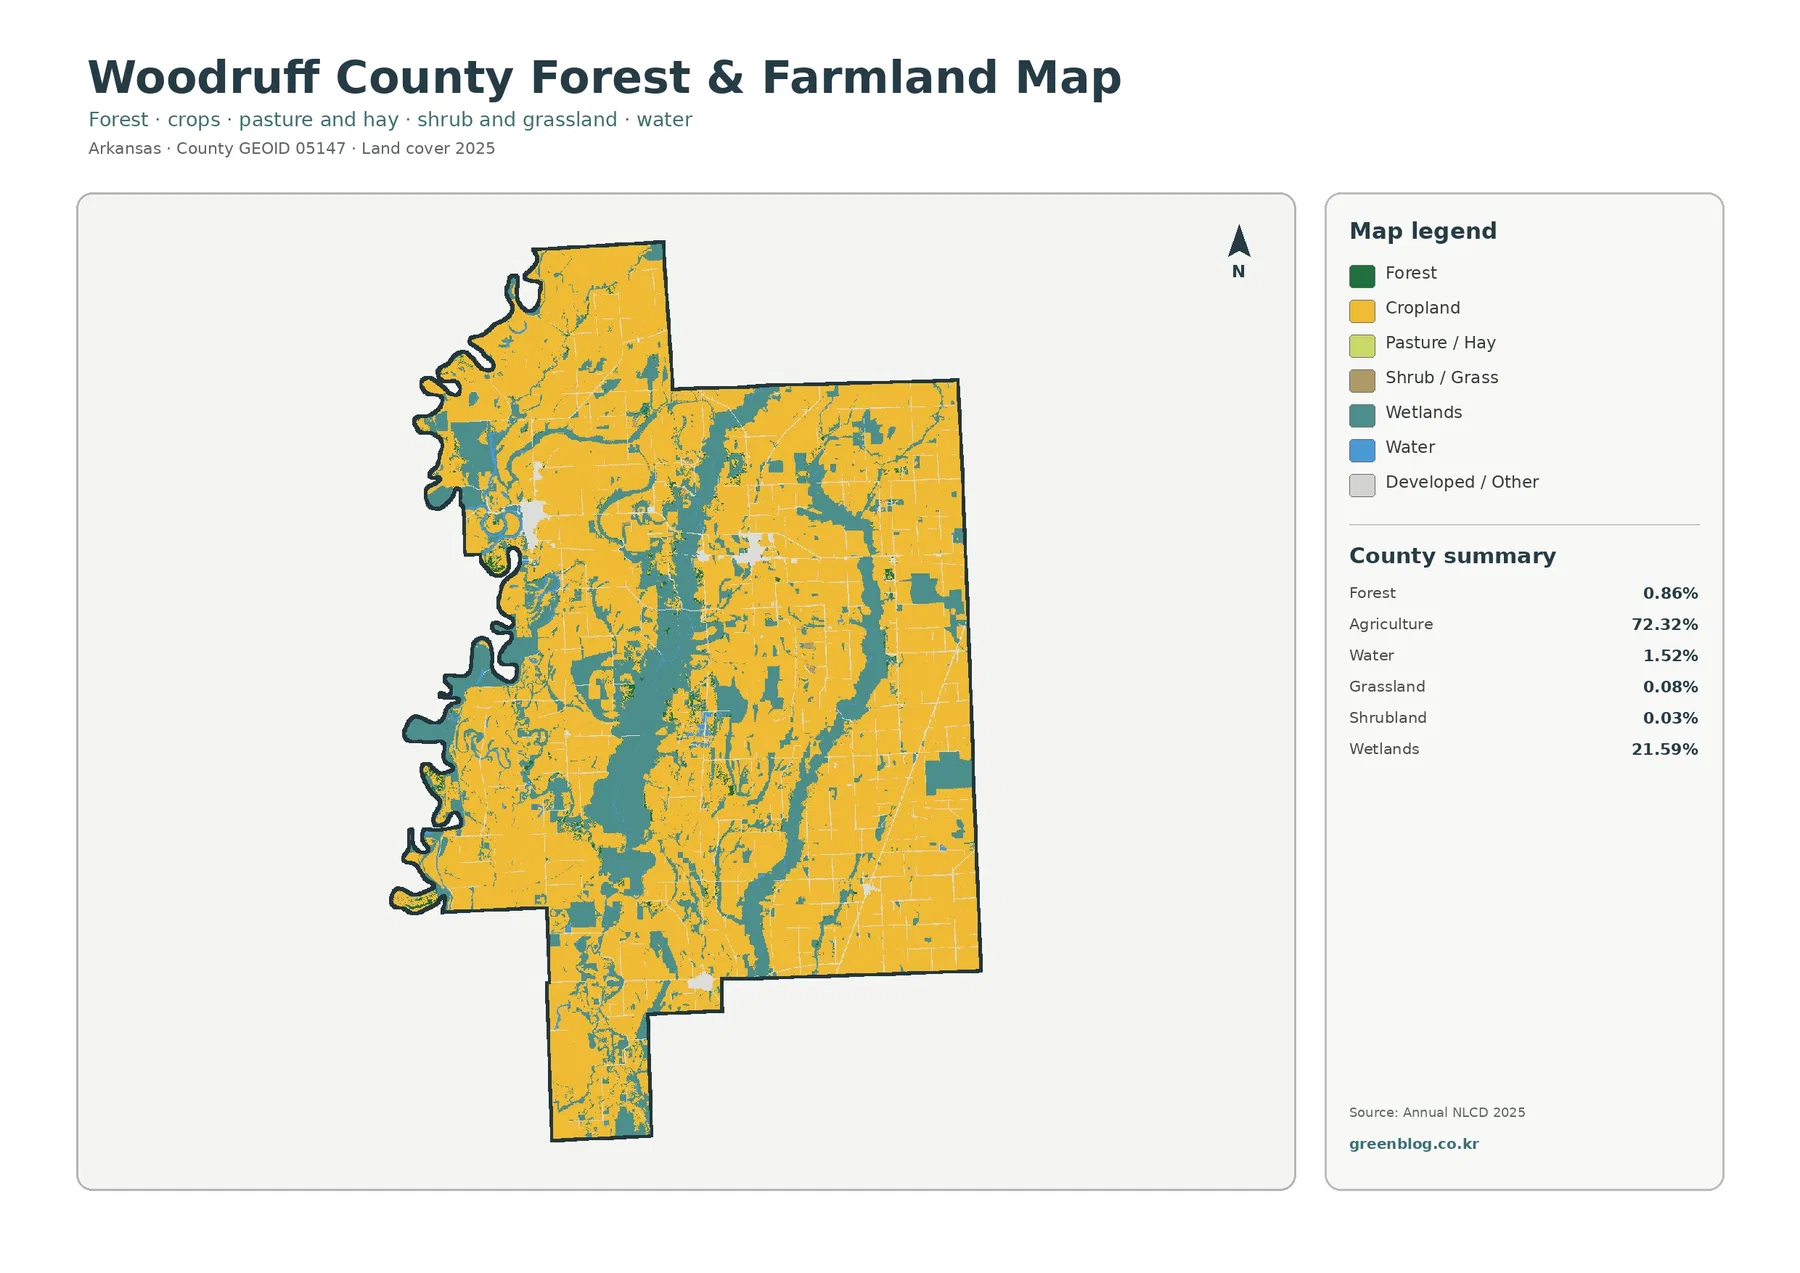
The remaining classes are much smaller at county scale. Developed land is 3.60%, open water 1.52%, and forest 0.86%. On the forest-and-farmland view, grassland is 0.08% and shrubland 0.03%. Those small shares should not be dismissed, because a narrow waterway or compact settlement can matter locally even when it occupies little area overall. The summary table is best for comparing total shares; the map itself is better for seeing where the smaller classes occur.
The White River boundary gives the western side of the map a different texture
Woodruff County’s official website notes that the White River forms most of the county’s western boundary. That helps explain why the west edge of the map is deeply curved rather than straight and why wetland colors repeatedly appear beside it. A second broad wetland pattern runs through the interior, where farm fields are interrupted by sinuous, water-linked lowlands. These are the kinds of features that disappear if the map is reduced to a single statement such as “72% agriculture.”
Official U.S. Fish and Wildlife Service material adds useful regional context. Cache River National Wildlife Refuge includes lands along the Cache River, White River, and Bayou DeView in Woodruff and neighboring counties, and it protects extensive wetland habitats and bottomland hardwood communities. The refuge does not account for every wetland cell on this county map, but it confirms that Woodruff County lies within a river-and-wetland landscape where floodplain habitats are an important part of the local setting.
A 0.86% forest share needs to be read together with the wetland classes
The forest-and-farmland map can be misleading if the forest number is read in isolation. Annual NLCD separates ordinary forest classes from wetland classes, and wooded lowlands can fall under woody wetlands rather than forest. In a county where wetlands account for 21.59%, the 0.86% forest figure does not mean that nearly all tree-covered habitat is absent. Some wooded floodplain environments may be represented within the wetland category instead.
Agriculture at 72.32% is also a broad land-cover grouping, not a crop inventory. Woodruff County’s government describes its level Delta land as well suited to rice, cotton, soybeans, and grain, but the supplied map does not identify individual crops. A yellow agricultural cell should therefore be read as agricultural cover at the mapped classification level, not as proof that a particular parcel contains a specific crop in 2025.
Hard surfaces are concentrated in a few compact settlement areas
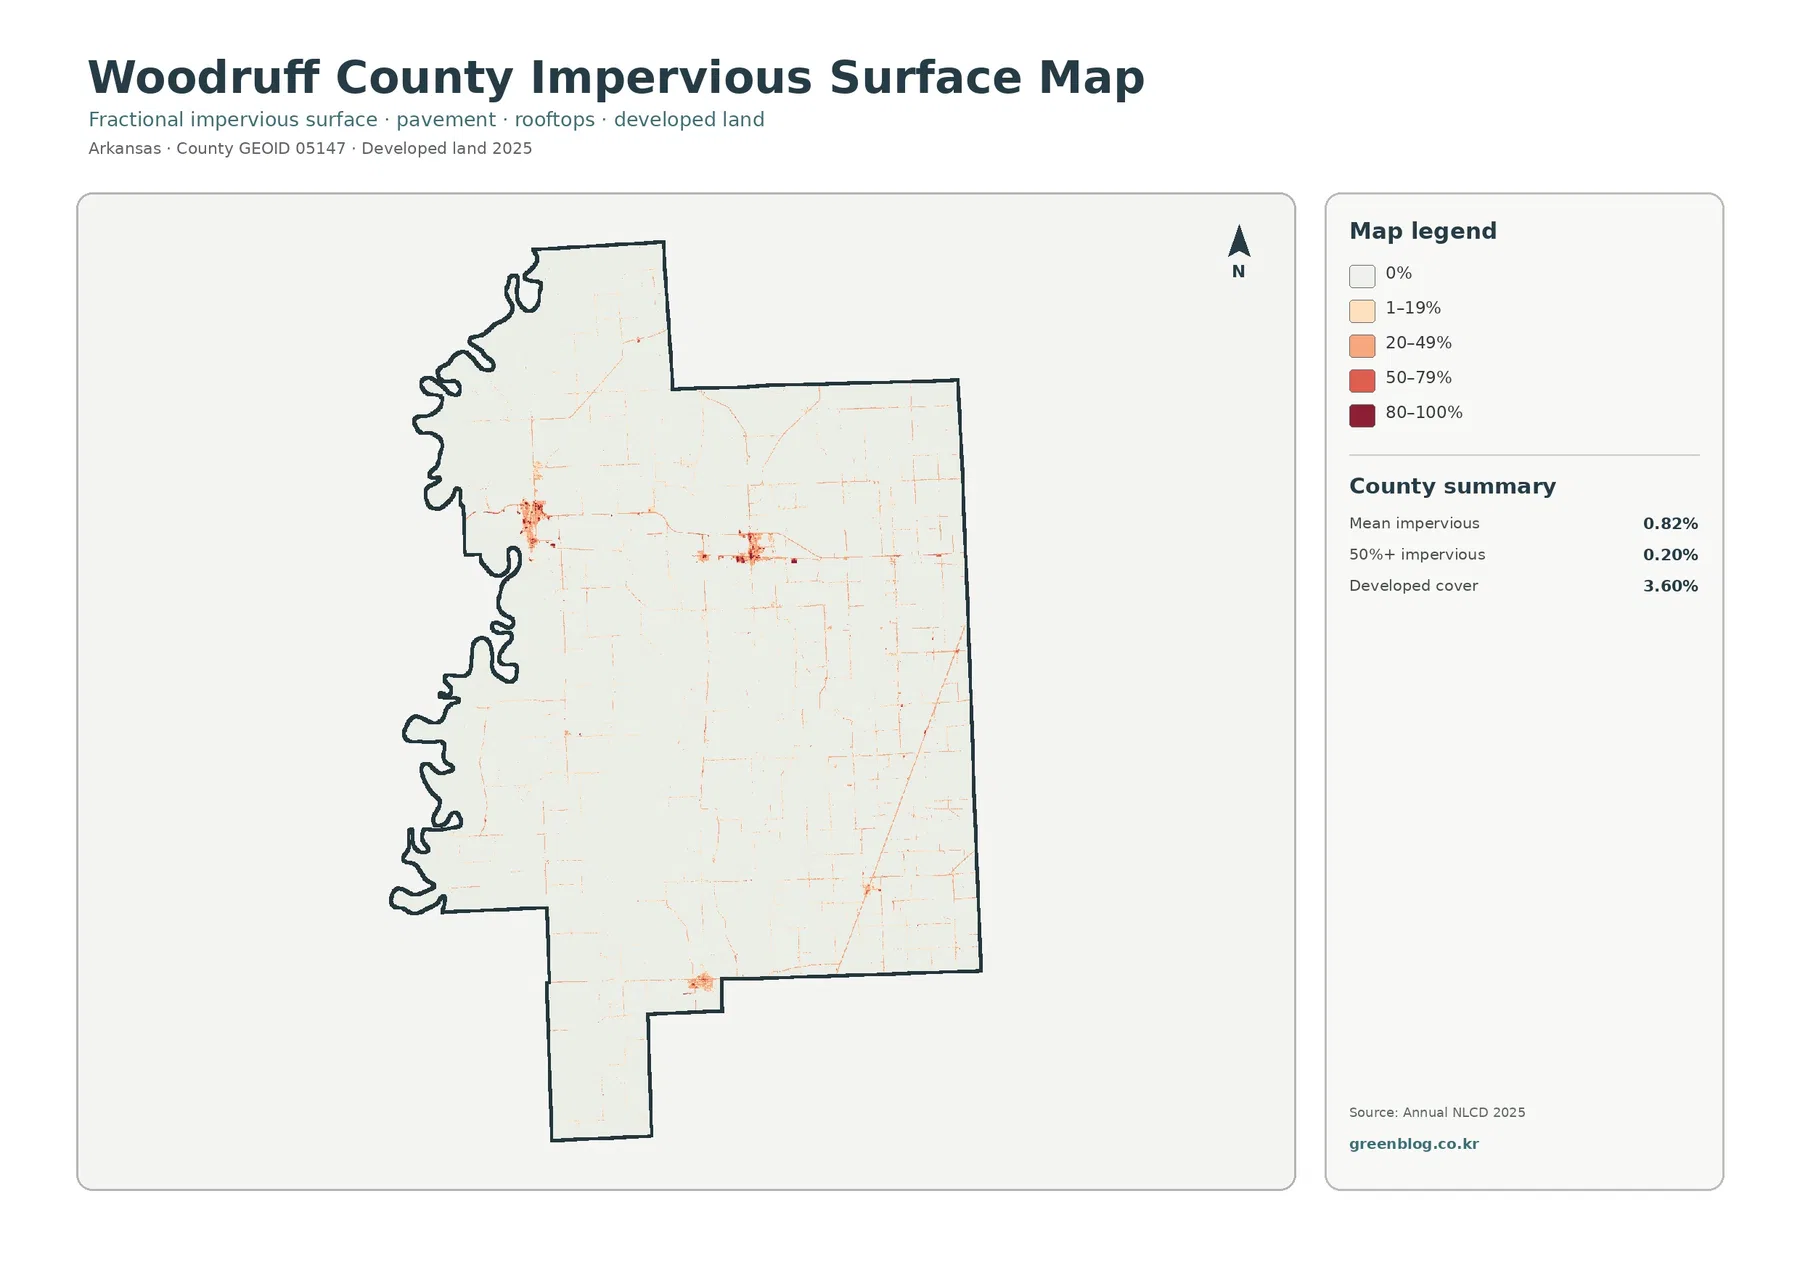
Developed cover occupies 3.60% of Woodruff County, and the impervious map shows why that share does not resemble a broad urban belt. The darkest hard-surface cells are confined to a handful of compact clusters, with thin linear traces connecting them through the agricultural landscape. Most of the county remains very light on the impervious map, which is consistent with the large agricultural share seen in the other views.
The county government lists Augusta, McCrory, Cotton Plant, Hunter, and Patterson as the incorporated communities, with Augusta serving as the county seat. The supplied preview does not label town boundaries, so individual dark patches should not be assigned to a specific neighborhood without another reference map. At county scale, however, the pattern is clear: built surfaces are clustered rather than continuous, and the rural land between settlements remains predominantly permeable.
Mean imperviousness is 0.82%, and only 0.20% of the county is mapped at 50% or greater impervious surface. These values are lower than the 3.60% developed-land share because the two measurements describe different things. A developed land-cover cell may include lawns, trees, soil, or other permeable areas around buildings and roads, whereas imperviousness focuses on rooftops, pavement, parking areas, and similar hard surfaces.
The 1985–2025 comparison shows limited class difference across most of the county
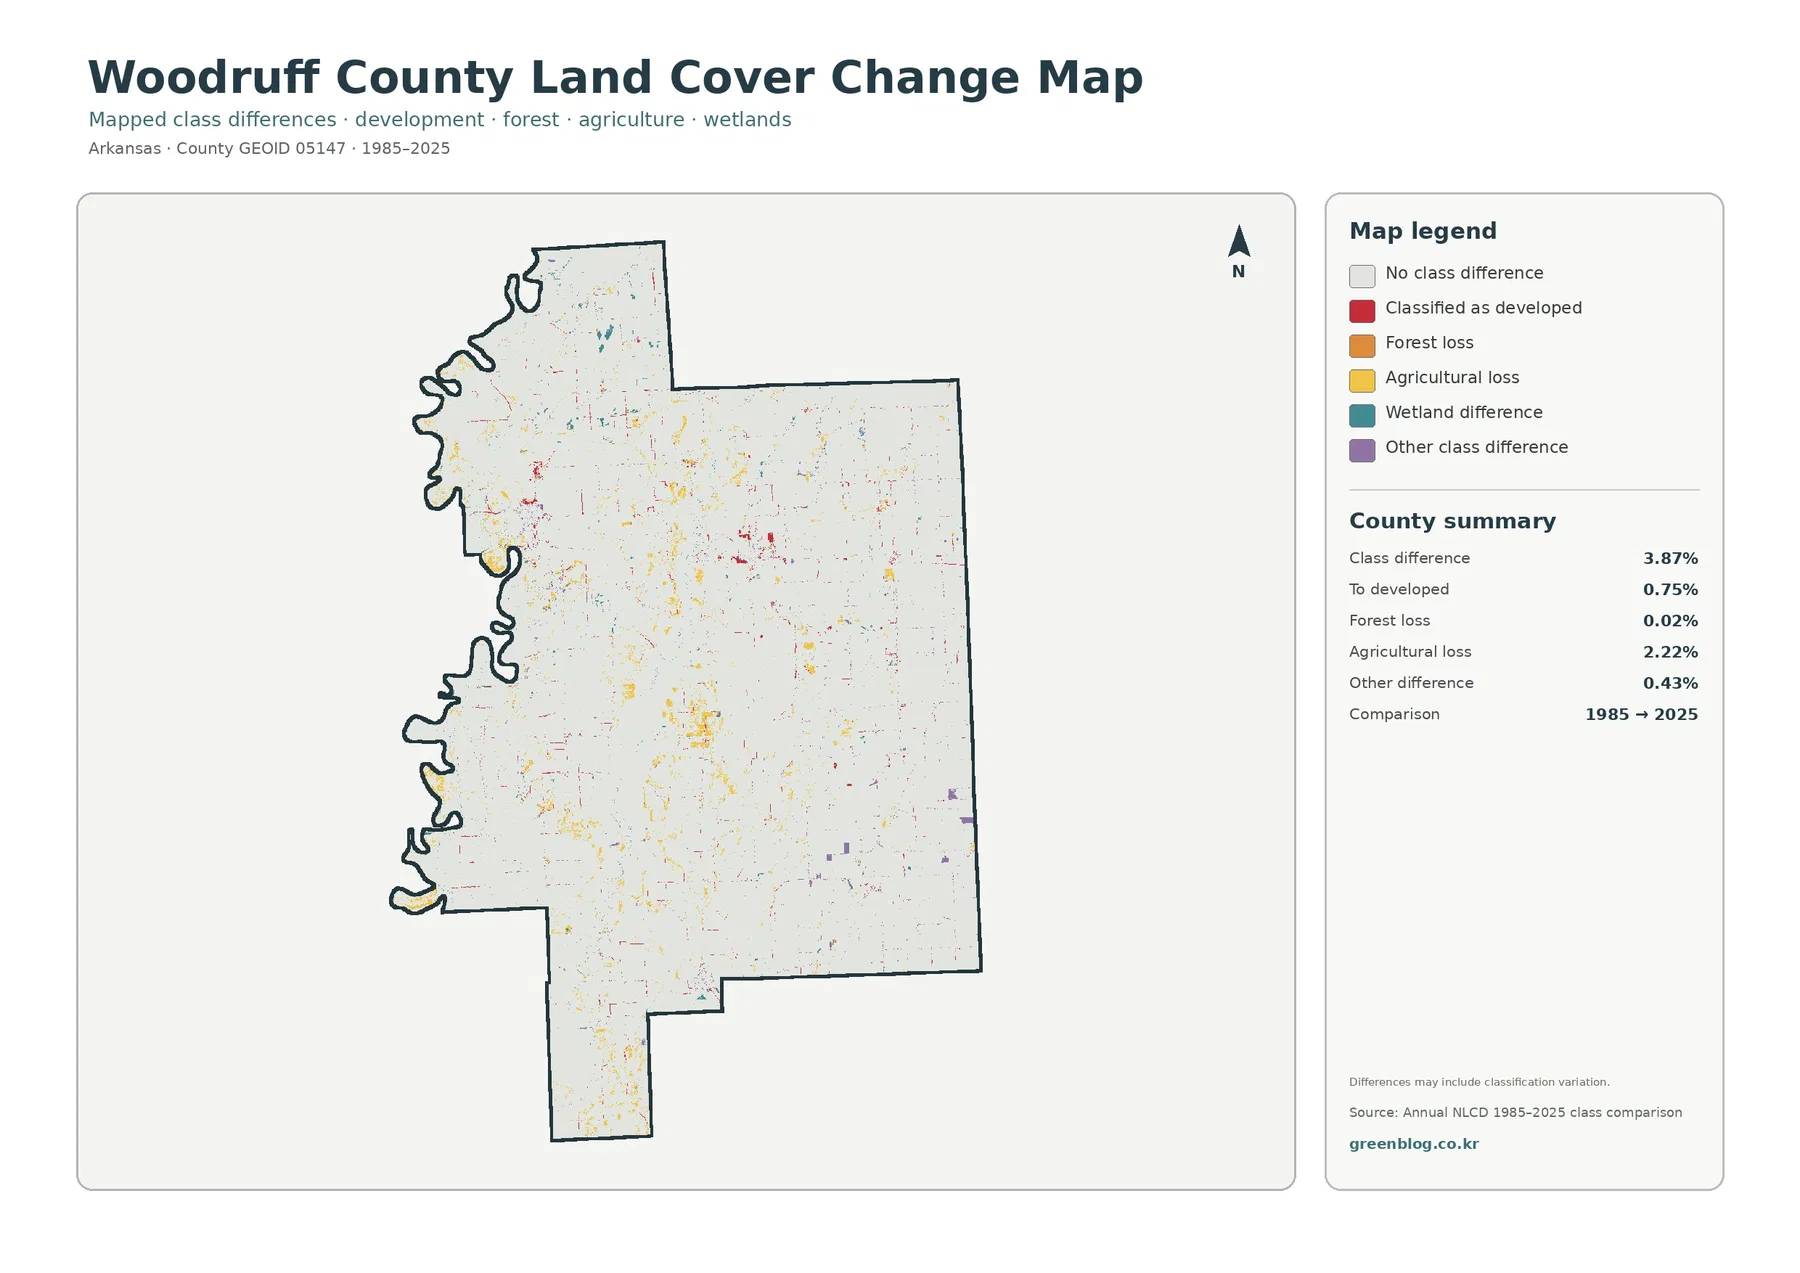
The change map should be read as a comparison of classifications, not as another current land-cover map. Its county summary reports a total class difference of 3.87% between 1985 and 2025. That means roughly 96.13% of the mapped cells do not show a class difference in this particular comparison. Visually, the colored change cells are scattered rather than forming a single countywide conversion front.
Agricultural loss is the largest listed difference category at 2.22%. Cells classified as developed account for 0.75%, forest loss is 0.02%, and other class difference is 0.43%. The agricultural-loss figure should not be equated with urban growth. Only a portion of the mapped differences is specifically labeled as a change to developed land, while other agricultural cells may have shifted to wetland or another class or may reflect classification variation between the two dates.
Use the maps for county-scale patterns, not parcel decisions
Land cover is a classification of what is on the ground surface, not a statement about zoning, ownership, development rights, or legal land use. A field can be agricultural cover without the map identifying the owner or crop. A wetland-colored cell does not by itself establish a regulated wetland boundary. A developed cell can include permeable vegetation as well as buildings and pavement.
The maps are raster products, so real-world edges are generalized into cells. Narrow drainage features, tree lines, small roads, and mixed farm-wetland boundaries can be simplified. This is especially relevant in Woodruff County because the map contains many winding wetland edges within large agricultural areas. The data are useful for regional comparison, environmental education, and presentation graphics, but detailed decisions should be checked against current imagery, field information, and the appropriate official parcel or regulatory source.
The four JPG maps can be downloaded together for printing and comparison
The WebP images on this page are quick previews. The download ZIP contains one JPG for each of the four map themes: current land cover, forest and farmland, impervious/developed land, and 1985–2025 land-cover change. Each supplied original JPG is 2480×1754 pixels. Because that is below a high-resolution A3 reference size, check print sharpness before enlarging the files for a large poster.
Frequently Asked Questions
What is the dominant land cover in Woodruff County?
Agriculture is the dominant 2025 class at 72.32%, followed by wetlands at 21.59%. The wetland areas form long corridors through and along the edge of the otherwise strongly agricultural landscape.
Why is forest only 0.86% when the Cache River area contains wooded habitat?
Annual NLCD separates ordinary forest from wetland classes. Tree-covered floodplain areas can be classified as woody wetlands, so the 0.86% forest share should not be treated as the total amount of all tree-covered habitat.
Does 2.22% agricultural loss mean that all of that land became developed?
No. The change summary lists 0.75% separately as cells classified as developed. Agricultural loss can include changes to other classes and classification variation between 1985 and 2025, so it should not be read as a direct urban-growth figure.
Sources and reference material
Land-cover percentages and 1985–2025 difference values in this article come from the supplied Woodruff County map package. The official resources below provide the classification framework, local agricultural and community context, river-wetland background, and administrative boundary data for further reference.
- MRLC Annual NLCD Data — official access to Annual NLCD land-cover products and supporting data.
- USGS Annual NLCD Land Cover Classification — explains agriculture, developed land, forest, water, woody wetlands, and other mapped classes.
- Woodruff County, Arkansas – About — official county information on its Delta setting, incorporated communities, agriculture, and the White River.
- U.S. Fish & Wildlife Service – Cache River National Wildlife Refuge — background on wetlands and bottomland hardwood habitats along the Cache River, White River, and Bayou DeView.
- University of Arkansas Cooperative Extension – Woodruff County — the county Extension office for research-based agricultural and community programs.
- U.S. Census Bureau TIGER/Line Shapefiles — official administrative boundary data used for county mapping.
Map File Information
The ZIP contains four original JPG maps for Woodruff County: current land cover, forest and farmland, impervious/developed land, and mapped land-cover differences from 1985 to 2025.
- File Type: ZIP containing four JPG files
Related Maps
- A Craighead County Arkansas Land Cover Map
- Arkansas County Arkansas Land Cover Map
- Ashley County Arkansas Land Cover Map
Green Map creates custom-edited map images using open geographic data sources such as geoBoundaries, Natural Earth, OpenStreetMap, and government open data.
These maps are edited visual materials, not raw data files, and are provided for education, documents, presentations, and graphic reference.