The Alexander County Illinois Land Cover Map set shows a county divided among cultivated land, a broad forested interior, and extensive river-edge wetlands. Agriculture leads the 2025 summary at 38.61%, followed by forest at 31.40%, wetlands at 15.83%, water at 7.14%, and developed land at 6.25%. The southern tip contains the strongest built concentration, while large green forest blocks occupy much of the middle and north.
Four related views are included: current land cover, forest and farmland, impervious surface and developed land, and a 1985–2025 class-difference map. The WebP images can be read directly on the page, and the four original 2480 × 1754-pixel JPG maps are available together in one ZIP download for county profiles, lessons, presentations, and land-cover comparison.
Table of Contents
Two major rivers frame the county before any individual land-cover class is considered
Alexander County forms the southern tip of Illinois. The county’s official site states that the Mississippi River bounds it on the west and south, while the Ohio and Cache Rivers lie along the east. That geography is visible in the map outline: blue water follows long exterior edges and enters several bends, while teal wetlands spread beyond the open-water line into low-lying interior areas.
Water represents 7.14% of the 2025 summary, but the river setting affects a much larger portion of the visual landscape because wetlands account for another 15.83%. The two percentages should remain separate. Open water marks exposed water surfaces, whereas wetland classes can include saturated ground and vegetation that does not look like an open river or lake.
Agriculture leads the percentage table, while forest controls much of the interior
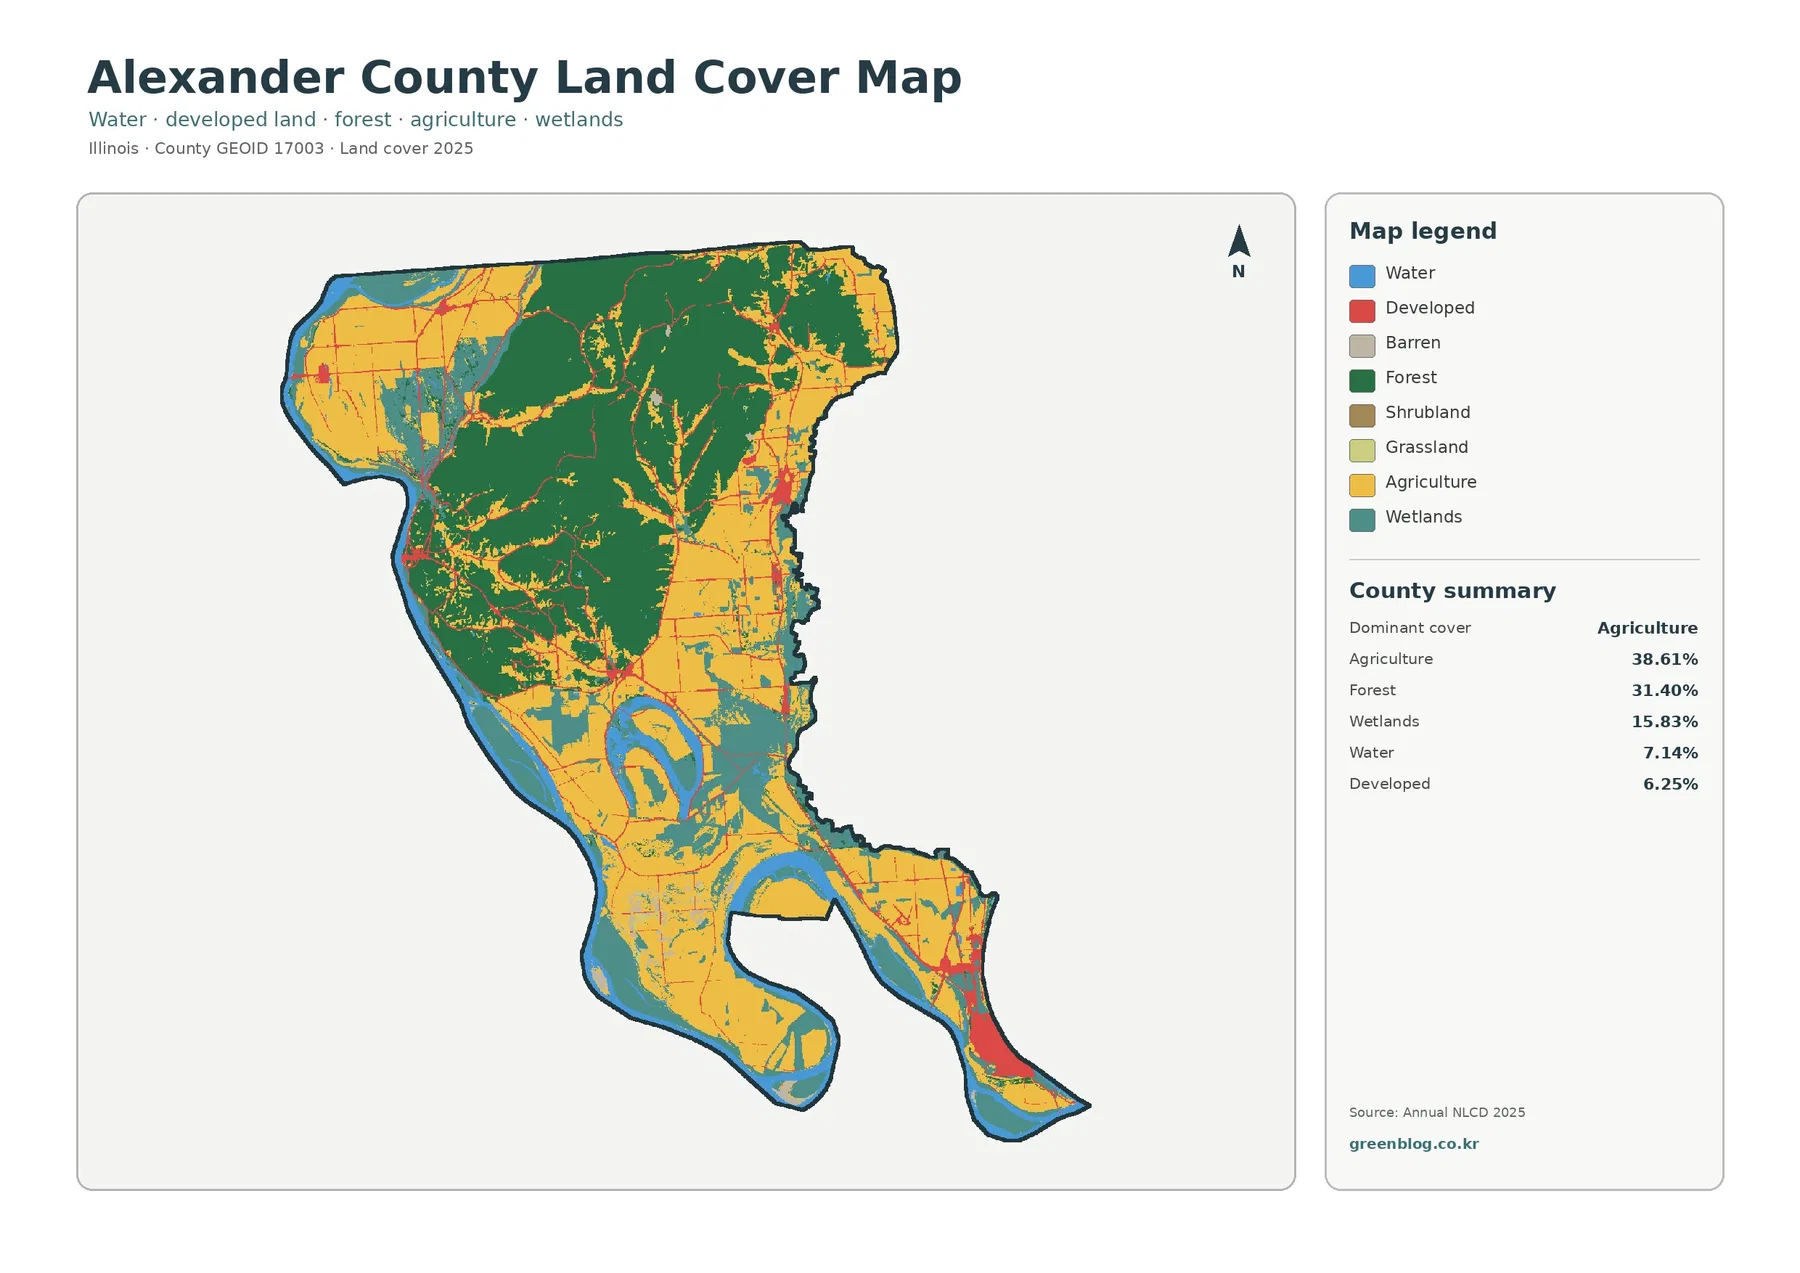
Agriculture is the largest single class at 38.61%. Broad yellow blocks fill much of the northwest, and additional farm areas appear along the eastern side and through the southern half. The cultivated color is not evenly distributed; it forms several distinct zones separated by forest, wetlands, water, and smaller developed traces.
Forest follows at 31.40%. Dark green cover forms a large central and northern mass and also fills smaller areas toward the northeast. The contrast between the northwest farm blocks and the forested interior is one of the clearest features on the map. Moving south, the continuous forest breaks into a more complicated mixture of agriculture, wet ground, open water, and settlement.
Developed land is 6.25%. Beyond the large southern Cairo-area cluster, smaller red patches appear in the northwest and along parts of the eastern side. The county website identifies communities including Cairo, Tamms, Thebes, McClure, and Olive Branch, but the land-cover image does not label them. Small red clusters therefore need a municipal or transportation map before a specific place name is assigned.
Horseshoe Lake helps explain why southern wetlands look different from simple river water
The vegetation-focused map separates farm blocks from the forested core
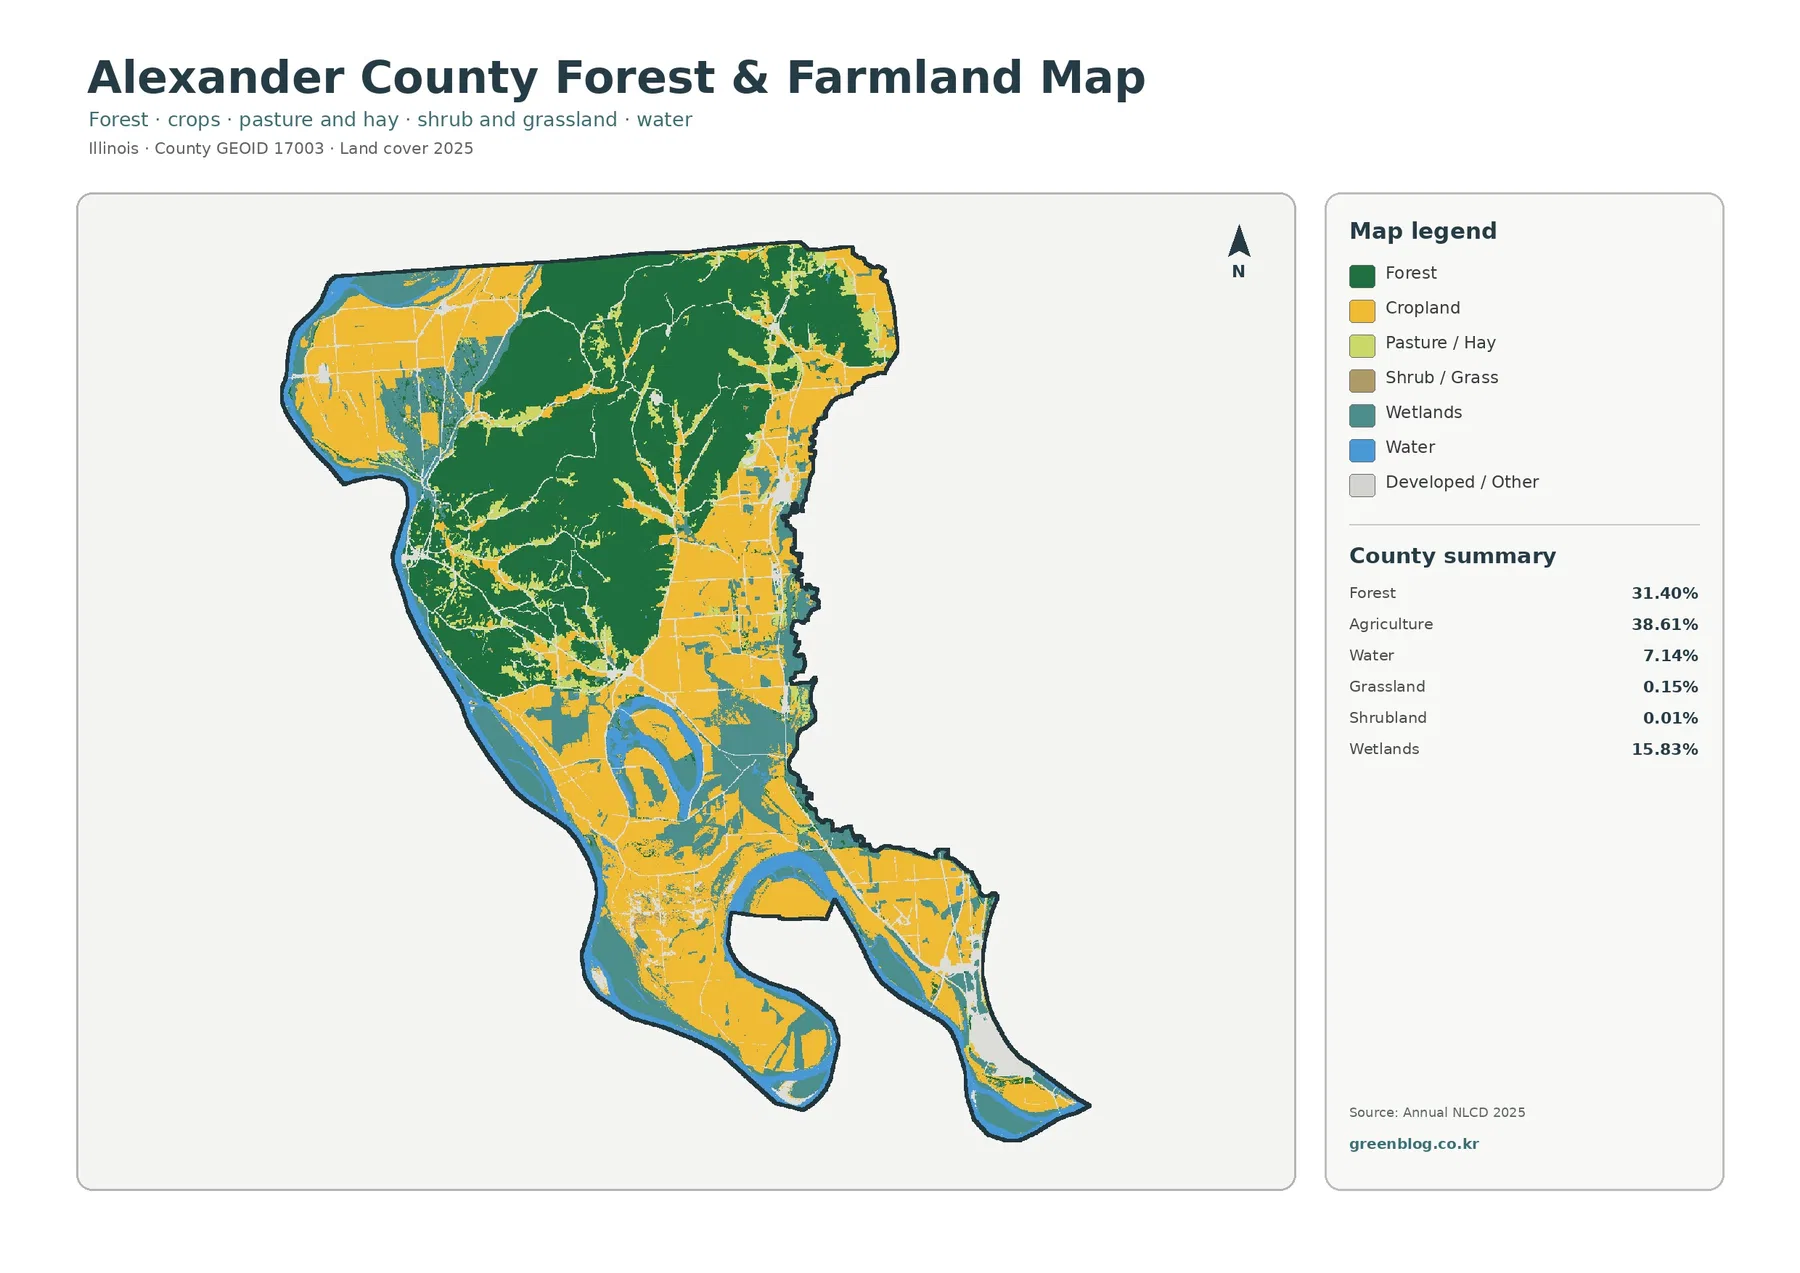
With developed and miscellaneous surfaces faded, the major vegetation contrast becomes easier to follow. The northwest remains a large agricultural block, while the center and north are dominated by forest. On the eastern side, farm color forms another broad zone, and the southern half shows cultivated land broken up by wetland and water features.
Grassland is only 0.15% and shrubland 0.01% in the supplied summary. Those classes are therefore minor components here, unlike many western counties where open grass and shrub cover dominate. For Alexander County, the more useful comparison is among agriculture, forest, wetlands, and open water.
Hard surfaces concentrate around Cairo and remain sparse across most rural areas
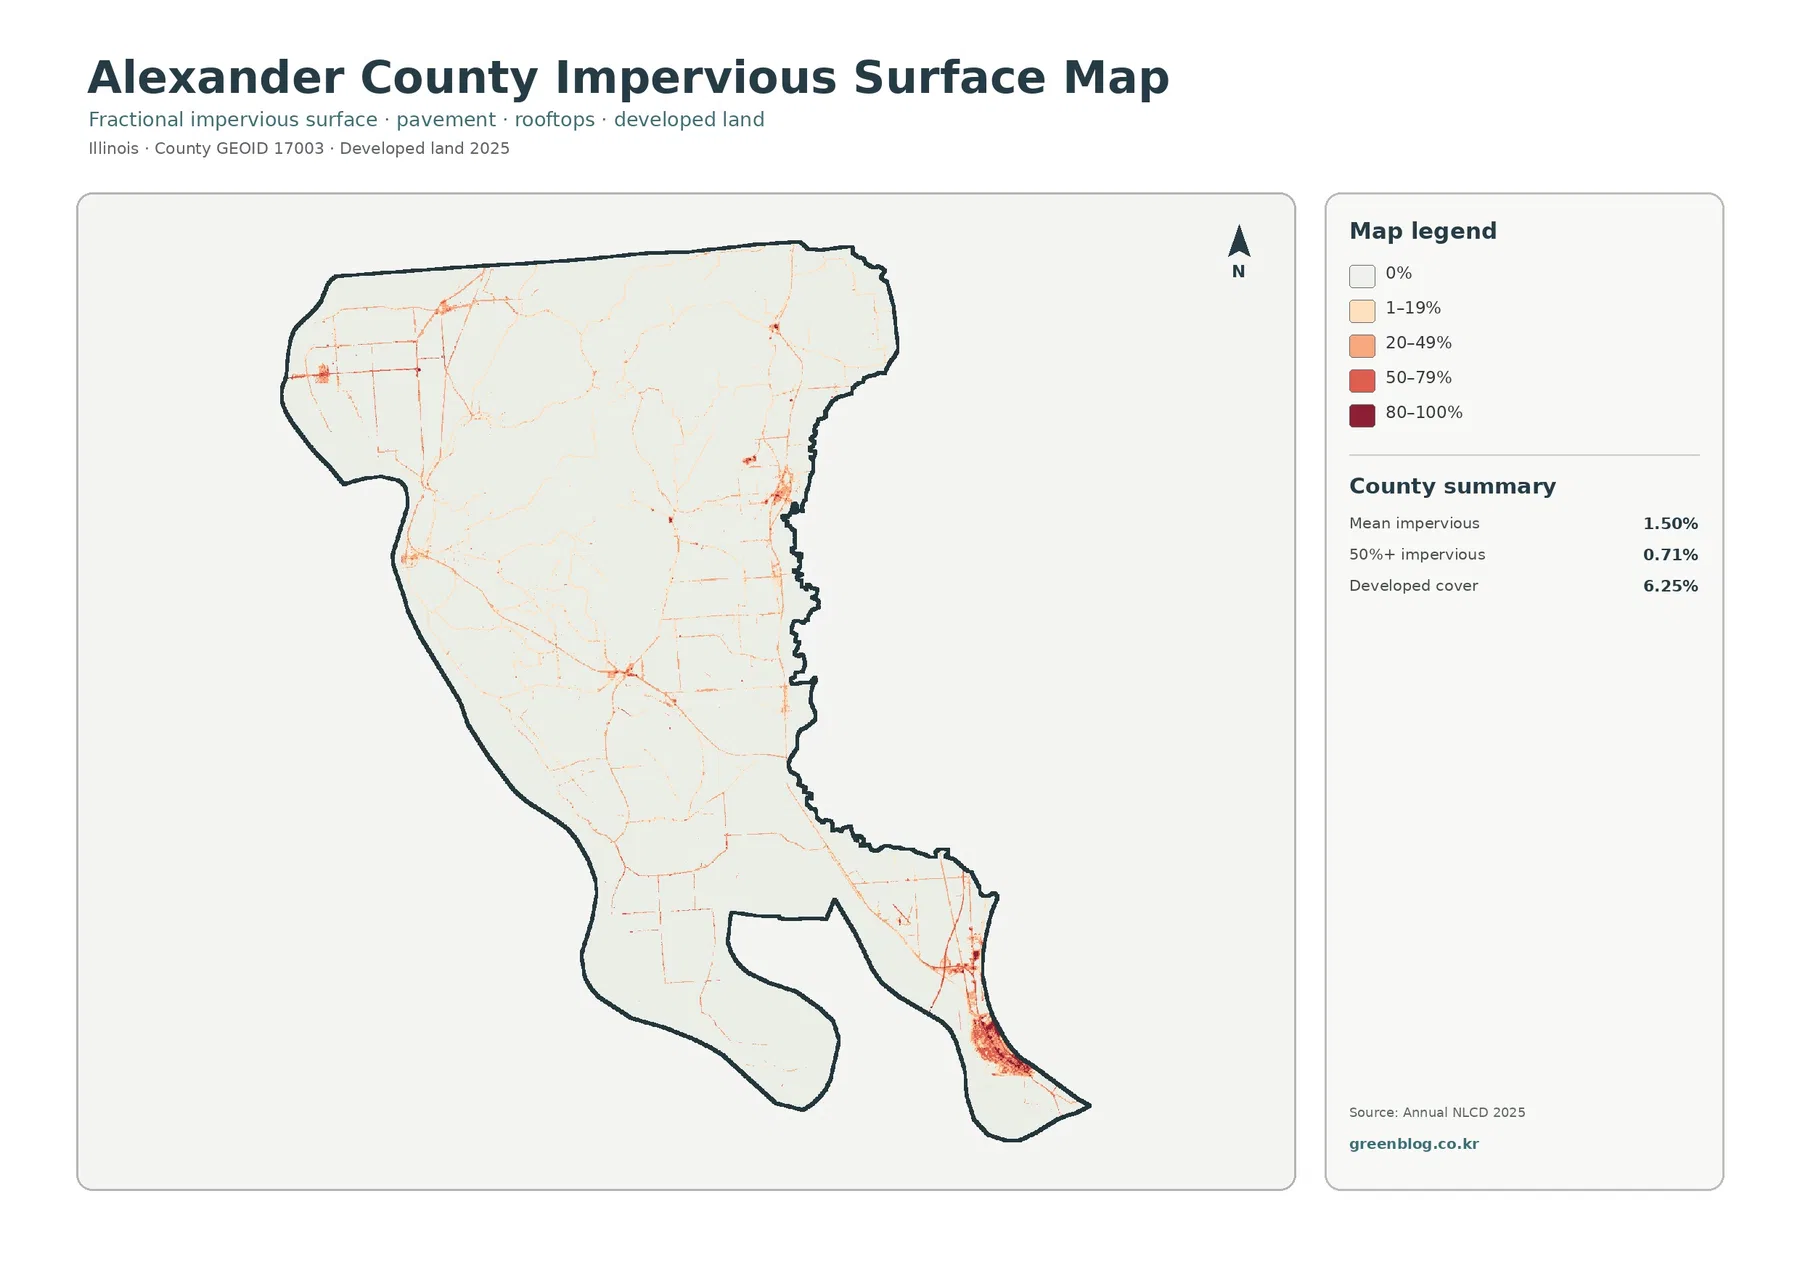
Mean impervious cover is 1.50%, and 0.71% of Alexander County is mapped at 50% impervious or greater. Both figures are below the 6.25% developed land-cover share because developed classes can contain grass, trees, bare soil, and other permeable ground. The impervious map isolates the harder surfaces associated with buildings, pavement, and similar materials.
The deepest tones gather at the southern tip around Cairo. Elsewhere, thin lines and smaller knots appear in the northwest, central corridor, and eastern side, while most of the forested and agricultural interior remains at very low values. The result is a strong contrast between a compact hard-surface center and a much larger rural landscape.
The 1985–2025 comparison is driven more by agricultural and other class differences than forest loss
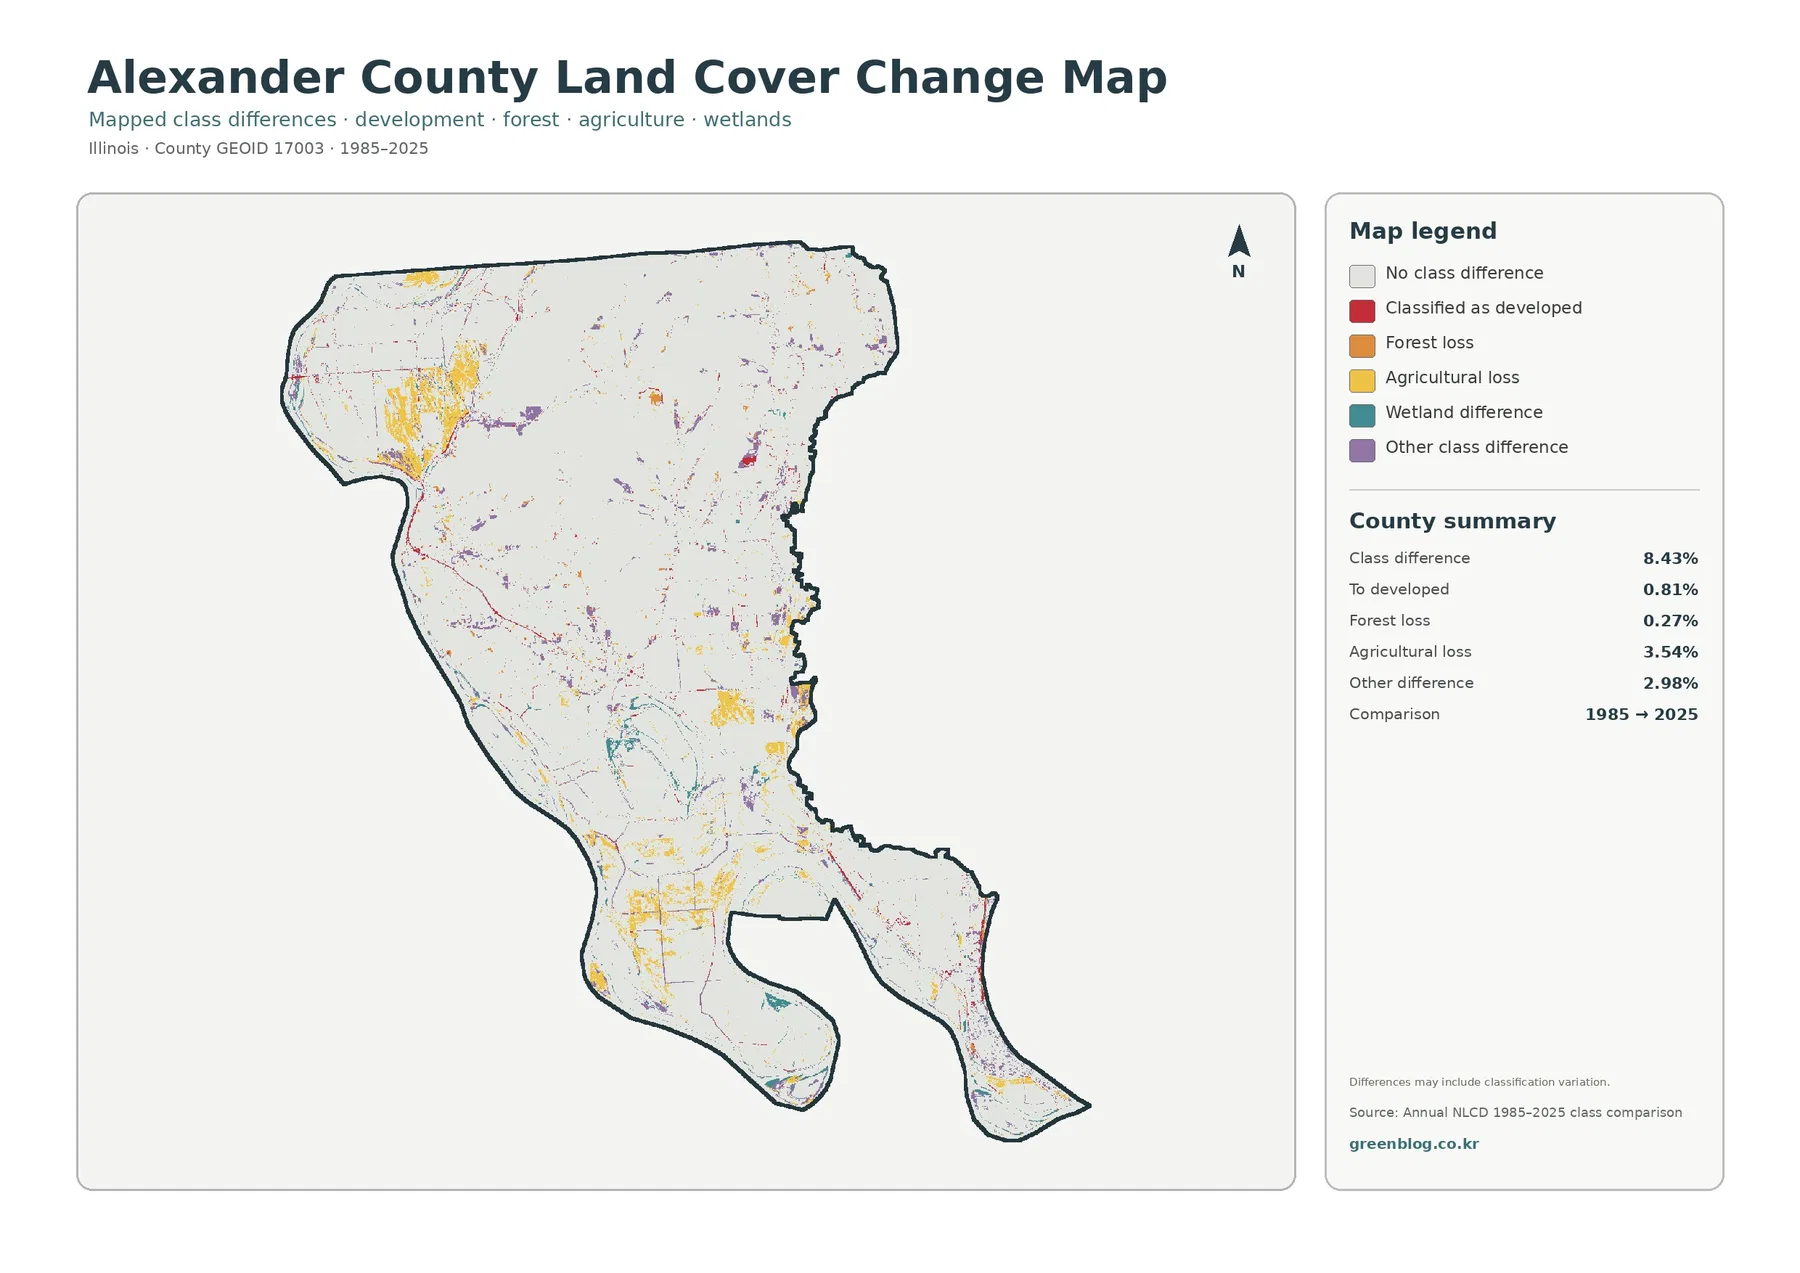
The endpoint comparison reports 8.43% total class difference. Listed components are 0.81% classified as developed, 0.27% forest loss, 3.54% agricultural loss, and 2.98% other difference. Wetland difference appears in the legend without its own printed percentage, so it should not be estimated visually or treated as an official residual value.
Agricultural-loss cells are especially noticeable in the northwest and recur in smaller southern and eastern patches. Purple other-difference cells are more scattered. Teal wetland-difference cells appear around parts of the southern water-and-wetland system, while red developed-conversion marks are concentrated in smaller clusters and lines rather than one broad countywide zone.
Loss in this legend means an endpoint class changed. It does not identify the process. A 1985 agricultural cell that received another class in 2025 could reflect real land-use change, flooding, fallow conditions, vegetation succession, or classification variation. Forest loss also does not automatically mean logging or damage. Intermediate imagery and local records are needed for timing and cause.
A practical reading order keeps river setting, current cover, and change from being mixed together
Use the forest-and-farmland image when the main question is how cultivated areas divide around the forested interior. Choose the impervious map for settlement intensity, especially when comparing Cairo with smaller rural clusters. The change map works best last, after current cover is already clear, because its colors describe endpoint differences rather than current land-cover classes.
Scale, observation year, and file size set clear limits on use
Annual NLCD is a generalized 30-meter product. Narrow riverbank strips, small roads, tree lines, levees, ditches, and buildings may be absorbed into a neighboring class, especially where farmland, wetlands, and water meet. Enlarging the image does not create parcel detail that was absent from the source.
Each original JPG measures 2480 × 1754 pixels. The package does not state that the files meet an A3 high-resolution reference, so a test print is sensible before enlarging them for a large poster. They work well for screen presentations, teaching materials, county profiles, and general comparison, but they are not survey or regulatory products.
Files included in the four-map JPG download
Frequently Asked Questions
Is Alexander County mostly farmland or forest?
Agriculture is the largest 2025 class at 38.61%, while forest is second at 31.40%. Their locations differ: farm blocks are strong in the northwest, east, and south, while a broad forested mass occupies much of the center and north. The county is better understood as a farm-forest split than as a single dominant landscape.
Why do wetlands cover 15.83% when open water is only 7.14%?
Open water and wetlands are separate land-cover classes. Blue areas emphasize exposed water, while wetland classes can include saturated soils and water-influenced vegetation. Alexander County’s position between major rivers and the Horseshoe Lake oxbow landscape helps explain why wetland color extends well beyond the open-water shapes.
Does the 8.43% class difference mean 8.43% of the county was damaged after 1985?
No. It is the share of cells that received different endpoint classifications in 1985 and 2025. Real land-surface change can contribute, but mixed pixels, seasonal conditions, and classification variation can also matter. Intermediate imagery and local records are needed to identify when and why a particular place changed.
Sources and Reference Data
- MRLC Annual NLCD Data – official access point for annual land-cover and comparison products
- USGS Annual NLCD Land Cover Classification – official guidance for the 30-meter land-cover classes
- U.S. Census Bureau TIGER/Line Shapefiles – official county-boundary reference for Alexander County
- Alexander County – About – official description of the Mississippi, Ohio, and Cache River boundaries and county geography
- Illinois DNR – Horseshoe Lake Alexander County – official location, lake area, and natural-setting information for Horseshoe Lake
- Illinois DOT – Alexander-Cairo Port District Profile – official transportation and river-port context for the county
Map File Information
The ZIP contains four original JPG maps for comparing Alexander County's agriculture, central forest, river wetlands and water, Cairo-area hard surfaces, and 1985–2025 class differences.
- Included Files: Use only the versions confirmed in the article and supplied images
- File Type: Use the confirmed download contents
- Intended Use: Printing, education, presentations, and map-based projects
Related Maps
- Adams County Illinois Land Cover Map
- From Cook to Alexander: Reading an Illinois County Map
- Illinois Population Density: Chicago Stands Apart Across 102 Counties
Green Map creates custom-edited map images using open geographic data sources such as geoBoundaries, Natural Earth, OpenStreetMap, and government open data.
These maps are edited visual materials, not raw data files, and are provided for education, documents, presentations, and graphic reference.