In west-central Idaho, Valley County is not dominated by a single surface type. The supplied 2025 summary puts forest at 42.49% and shrubland at 39.47%, with grassland, lakes, wetlands, a small agricultural footprint, and compact developed areas filling the remainder. This Valley County Idaho Land Cover Map makes the contrast especially clear between the wooded mountain country, broad shrub-covered terrain, and the western lake-and-valley corridor where most visible development is concentrated.
Four companion views are included: 2025 land cover, forest and farmland, impervious surface and developed land, and a 1985–2025 class-difference comparison. The WebP maps can be studied directly on the page, while the four original 2480 × 1754-pixel JPG files are packaged together in one ZIP below. They work well for county profiles, classroom geography, presentations, environmental context, and side-by-side map interpretation.
Table of Contents
A county split almost evenly between forest and shrubland
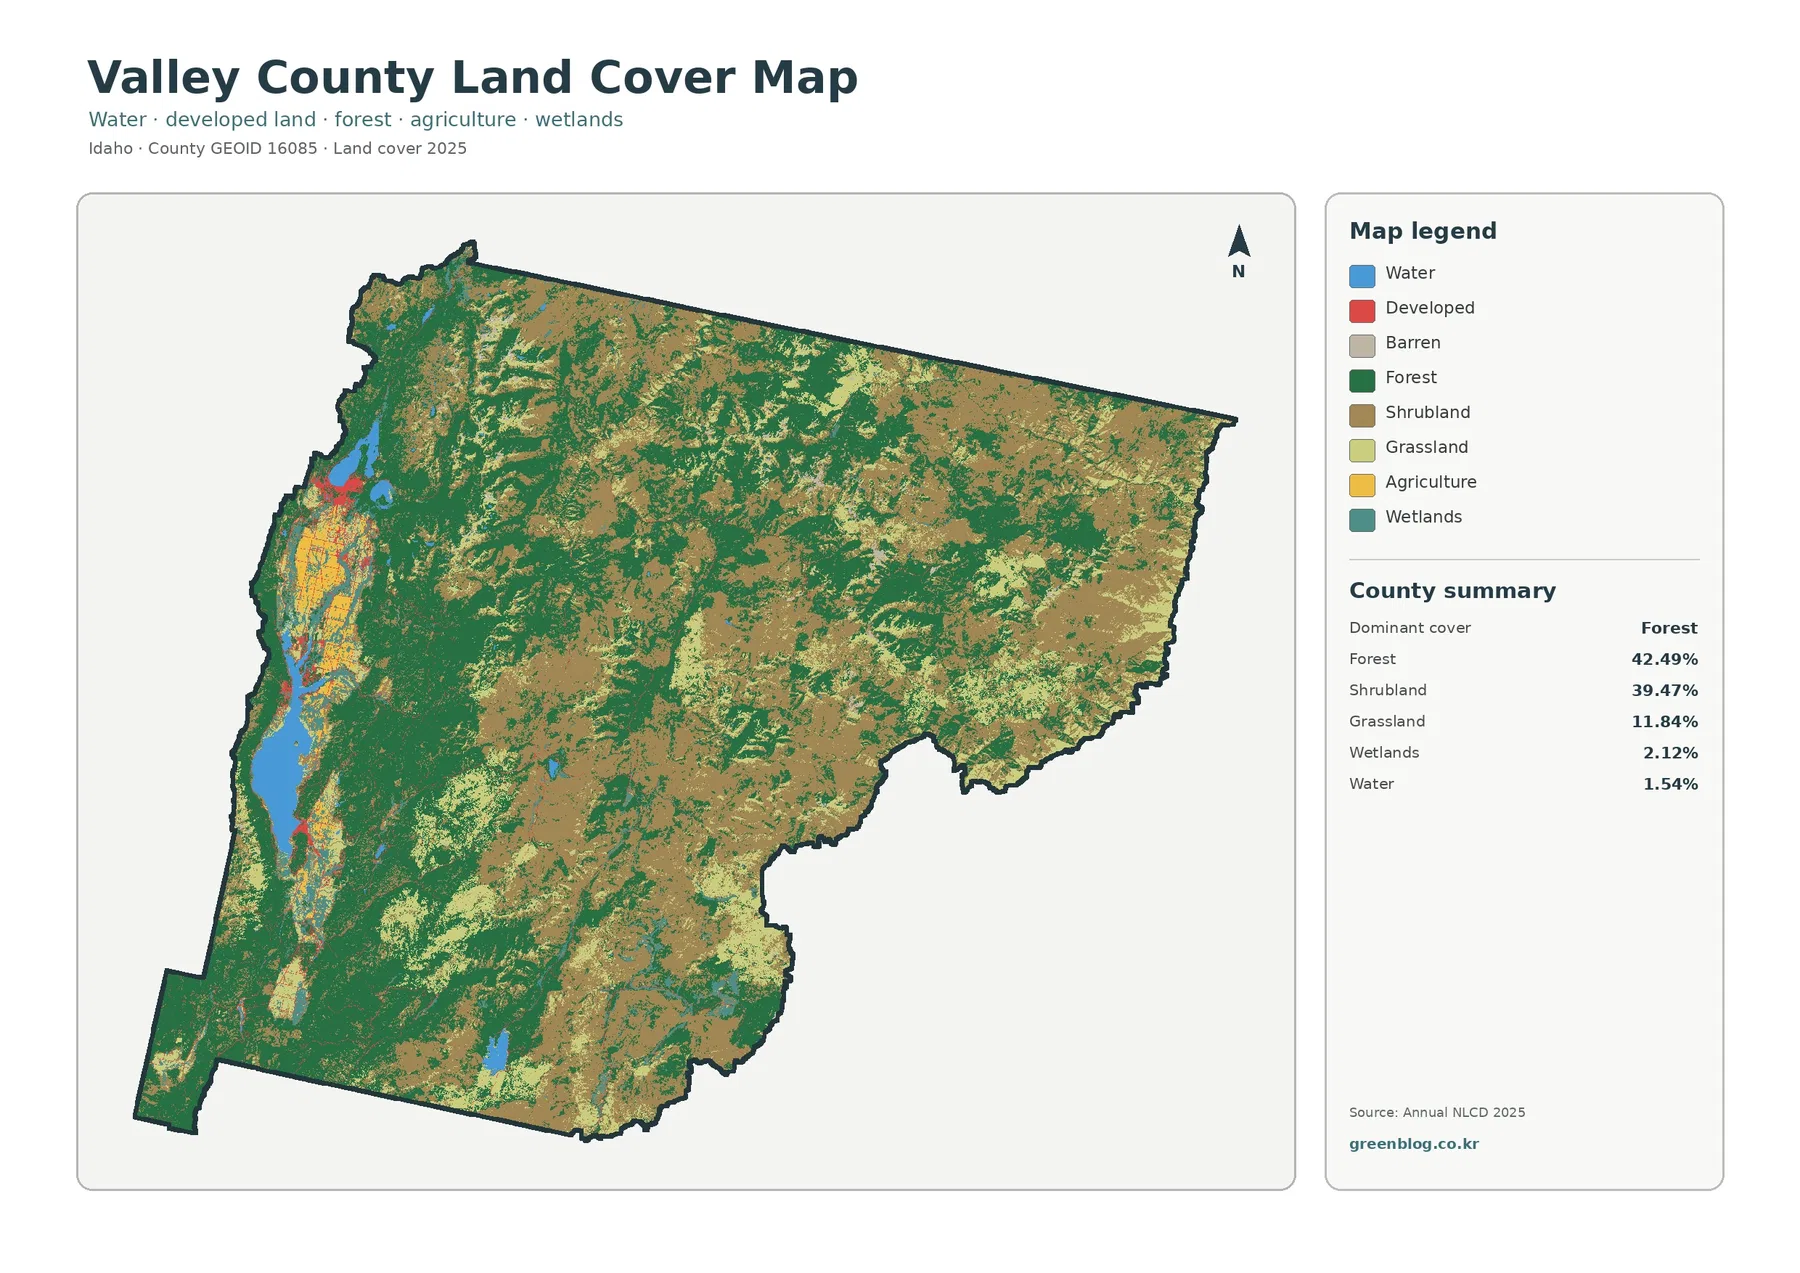
Forest is the largest class at 42.49%, but shrubland follows closely at 39.47%. Grassland accounts for another 11.84%, while wetlands are 2.12% and open water is 1.54%. Agriculture is only 0.85%, and developed cover is small enough that it appears as localized patches rather than a broad countywide color. Those proportions are important because they prevent a simple “forested mountain county” description from telling the full story. Nearly as much land is mapped as shrubland as forest.
The dark-green forest forms large blocks through much of the western and southwestern part of the county and reappears across central mountain areas. Tan shrubland spreads broadly across the east, northeast, and southeast, while lighter grassland breaks up both classes in open basins, slopes, and transitional areas. The boundary between these surfaces is irregular rather than clean. Short distances can contain forested slopes, open shrub cover, meadow-like grassland, and small wet areas, which is why a single countywide percentage never describes every part of Valley County equally well.
Blue water features are clustered mainly along the western side of the county, where the official Valley County description places the Long Valley, Payette Lake near McCall, and Lake Cascade farther south. The county’s own recreation and waterways pages also identify Warm Lake and many additional alpine lakes. Because lake names are not printed, small blue patches should not be assigned a name from shape alone. Still, the contrast between the western lake corridor and the much drier-looking shrub-dominant interior is one of the clearest county-specific patterns in the image.
Land cover is a description of what the ground surface was classified as, not a legal map of ownership, zoning, or development rights. A forest cell does not identify a particular landowner or management agency, and a developed cell does not tell whether the site is residential, commercial, public, or recreational. Parcel boundaries, building permissions, shoreline rules, and zoning decisions require current local records from Valley County or the relevant city. For that reason, this layer works best as a broad surface reference before moving to those more detailed sources.
The Long Valley stands out when developed colors are removed
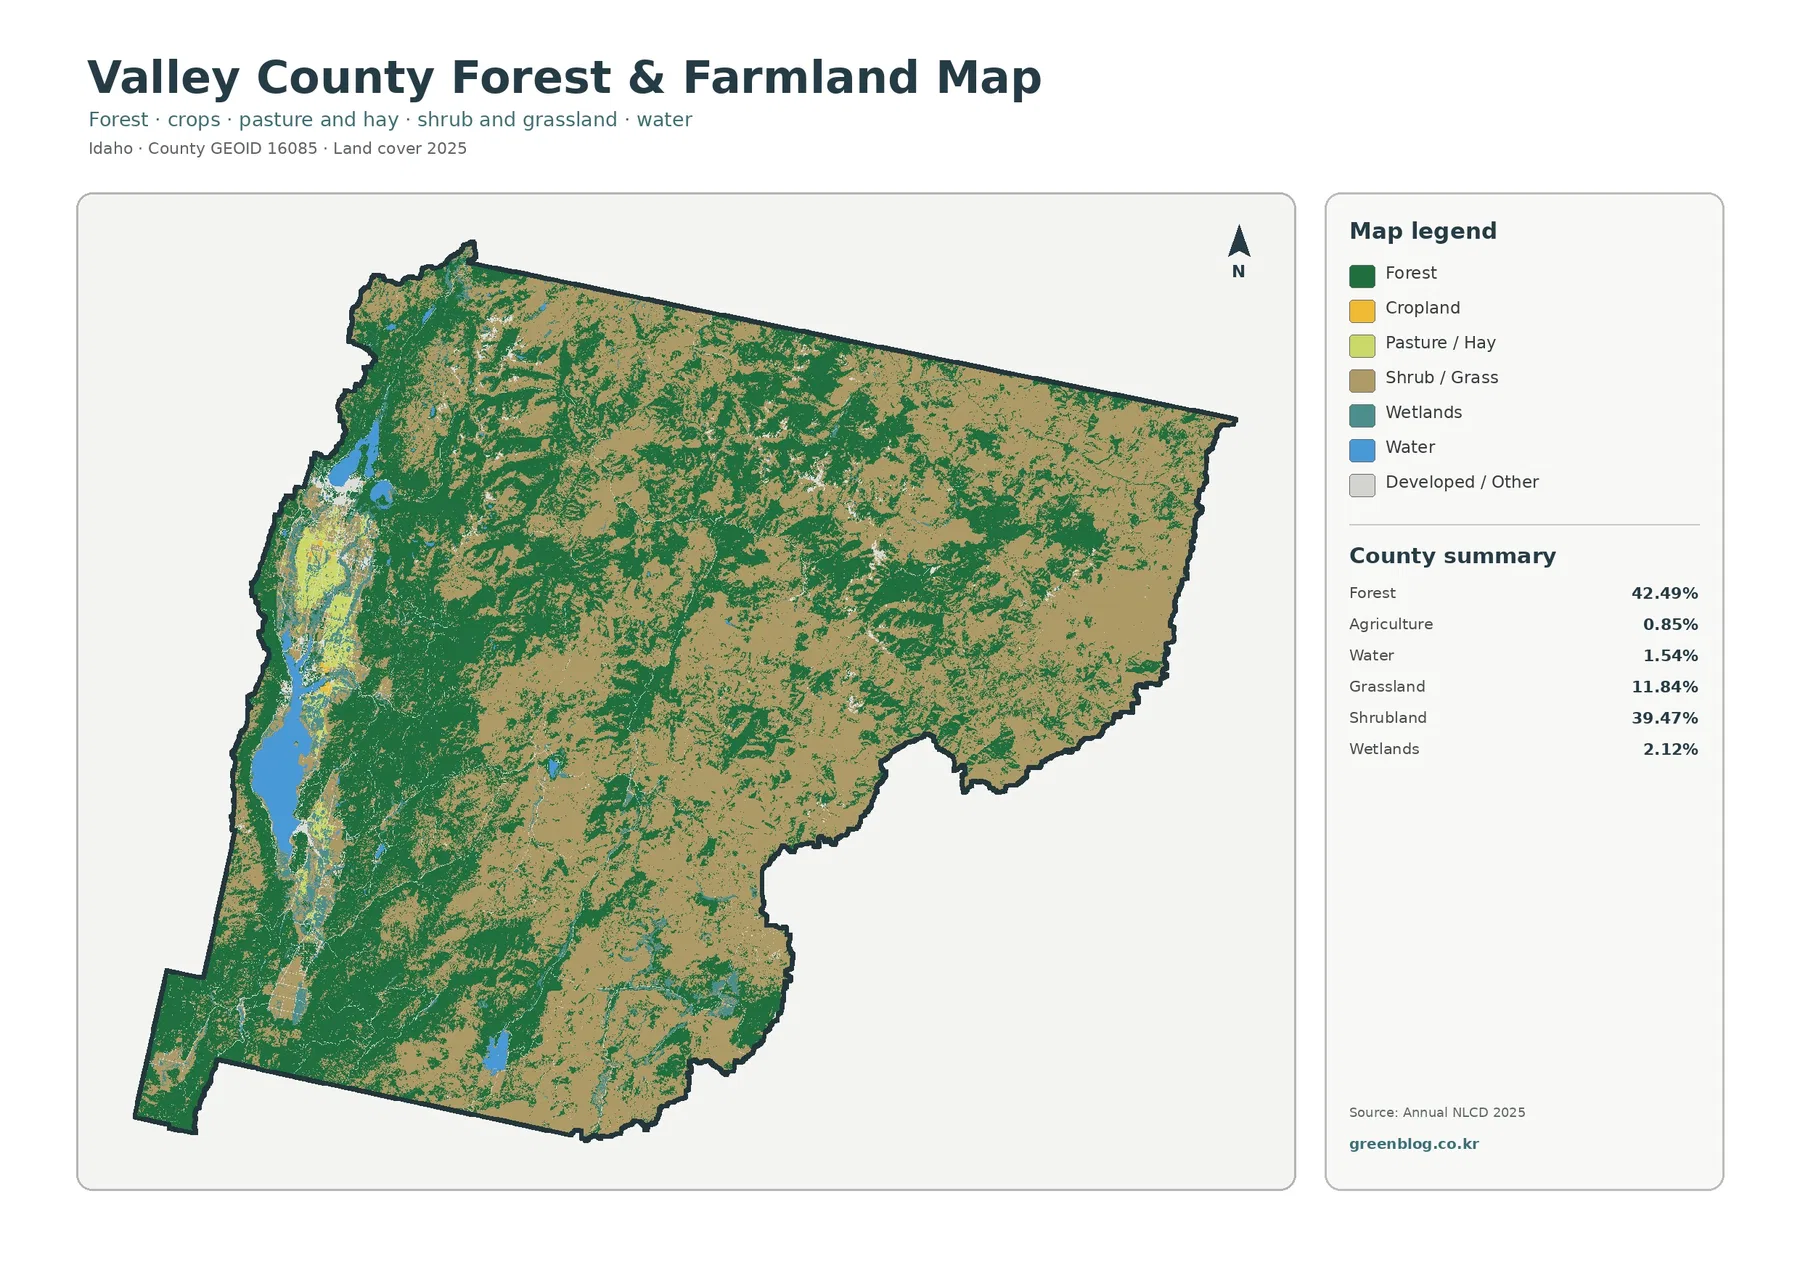
Fading developed and miscellaneous surfaces makes the relationship between forest and open country easier to see. Large green forest blocks dominate the western mountains and continue through portions of the center, while shrub and grass cover occupies much of the eastern half. Agriculture remains a very small component at 0.85%. Its limited extent is visible mainly in the western valley system rather than as the wide geometric farm grids seen in many southern Idaho counties.
The county’s official visitor page explains that Long Valley extends for more than 30 miles from the Payette Lake area at McCall south toward Cascade and Round Valley. That geographic setting helps explain why the western side deserves separate attention when reading the map. Open valley surfaces, water, settlements, and small agricultural or pasture areas occur close together there, while the county’s much larger mountain interior is primarily forest, shrubland, and grassland. That contrast is visible here, although the exact Long Valley boundary is not drawn.
Water and wetlands also need to be separated. Open water covers 1.54% of the county, while wetlands account for 2.12%. Blue indicates exposed water surfaces such as lakes, whereas wetland classes can include saturated soils and vegetation influenced by water. Teal cells around a lake or drainage are therefore not simply additional open water. They also should not be treated as a regulatory wetland determination, because legal jurisdiction depends on current field conditions and agency rules that a 30-meter land-cover classification cannot establish.
The county Waterways Management Plan lists Payette Lake, Lake Cascade, Warm Lake, Upper Payette Lake, Little Payette Lake, Deadwood Reservoir, and the North Fork of the Payette River among important county waterways. That official context is useful for understanding why water matters locally even though the countywide open-water percentage is modest. A large lake may occupy only a small share of the total county area while still shaping recreation, settlement, access, and the appearance of the western valley on the map.
Very low impervious cover hides several distinct settlement clusters
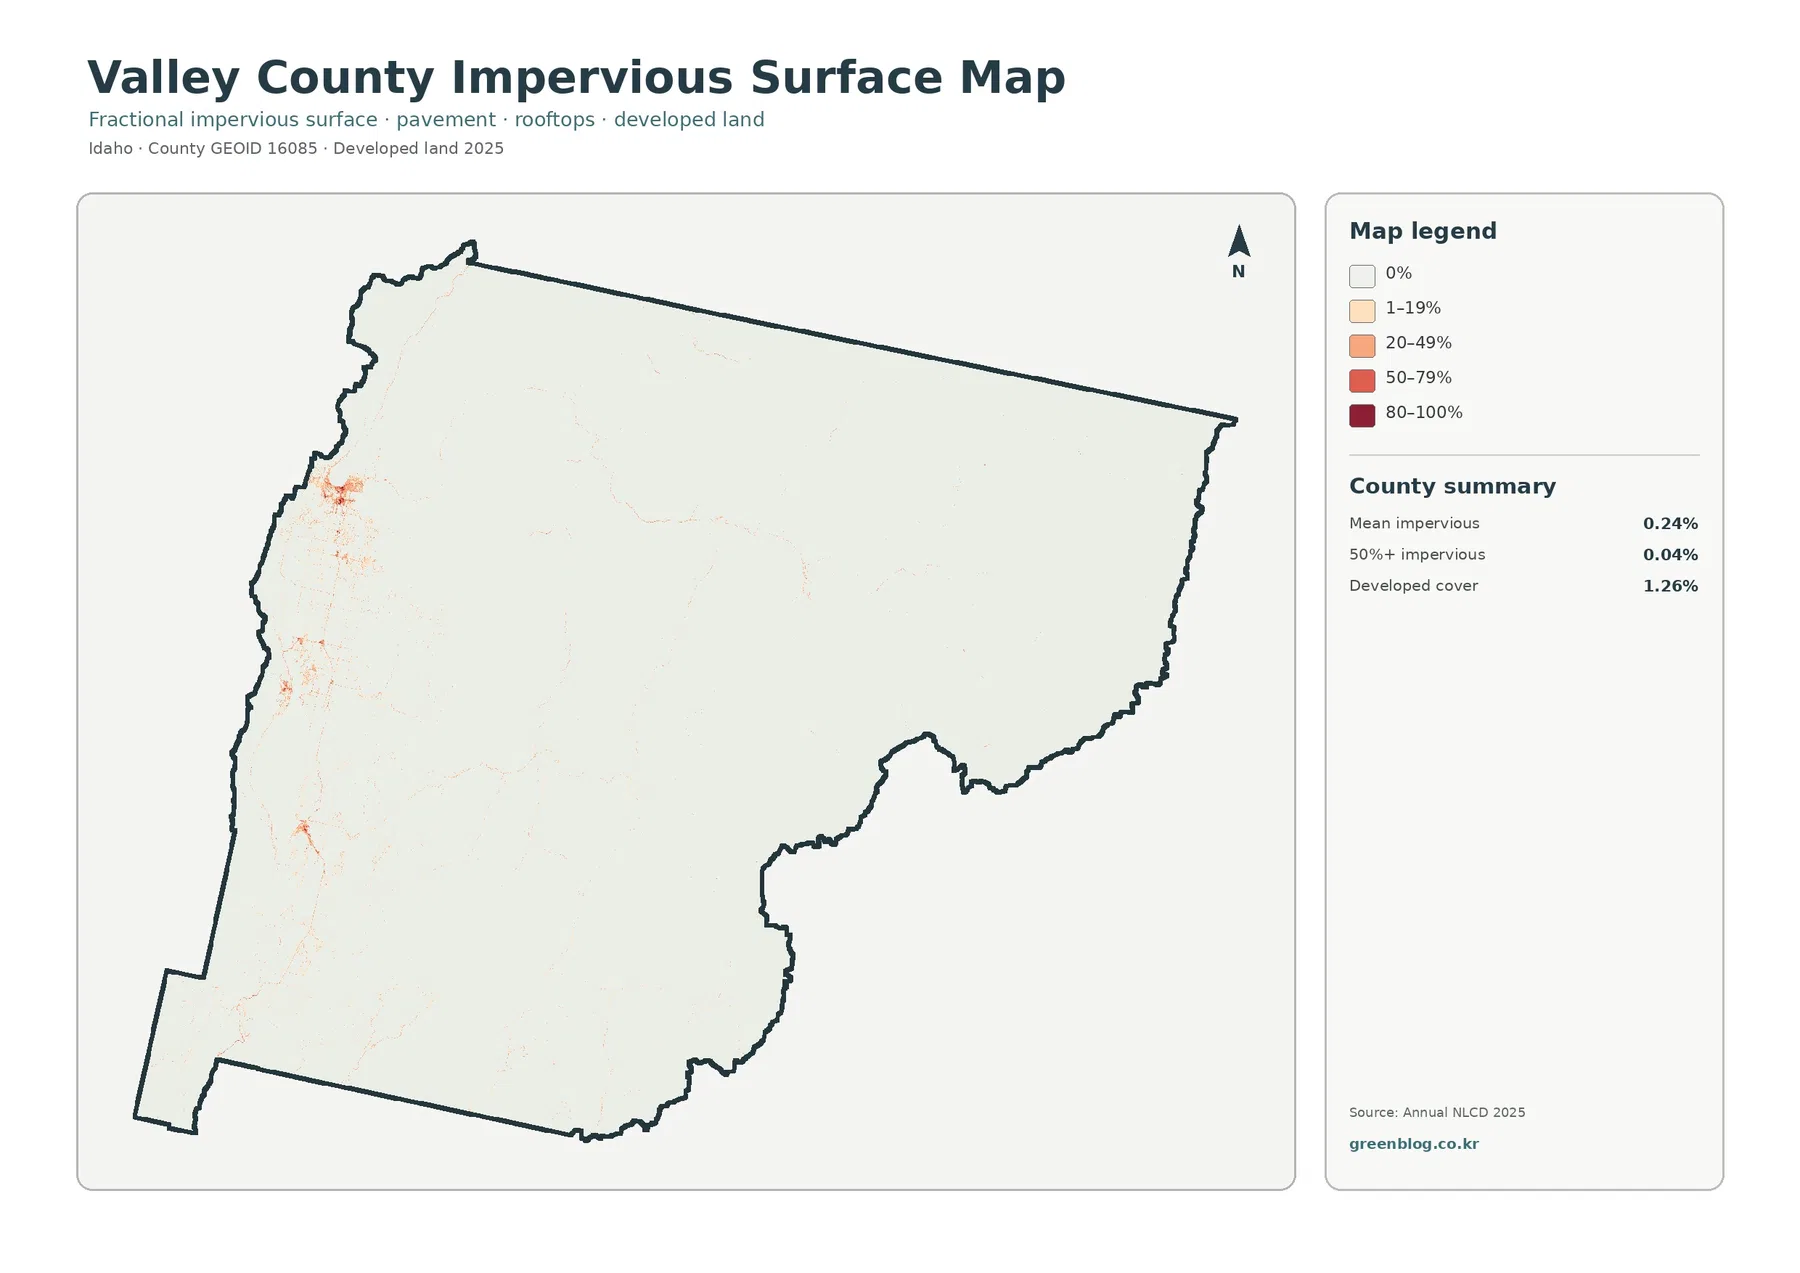
Impervious surface means hard material such as rooftops, pavement, and parking areas where water cannot readily soak into the ground. Mean impervious cover across Valley County is just 0.24%. Only 0.04% of the county is mapped at 50% impervious or greater, and total developed cover is 1.26%. These are very low countywide values, but the pale overall background should not be read as evidence that development is absent. Several compact clusters stand out clearly along the western valley.
The strongest hard-surface concentration appears in the northwestern lake area, with additional patches farther south along the Lake Cascade and Long Valley corridor. Cascade is the county seat and McCall is the largest city, while Donnelly sits between them in the same general valley system. The impervious map does not include city limits, street labels, or parcel boundaries, so the colored footprint should not be substituted for an official municipal map. It is useful for comparing where hard surfaces are concentrated relative to the county’s vast natural areas.
Thin traces extend away from the main clusters and can resemble road corridors, but no route names are printed in the image. A line that visually follows a transportation corridor should therefore remain an observation rather than be assigned a highway number without a road layer. For access or transportation work, this map can identify where developed surfaces become more continuous, and an official road map can then provide names, classifications, and connections.
Developed cover and impervious cover answer different questions. A developed land-cover class can include houses or businesses together with lawns, trees, bare ground, and other permeable surfaces. Impervious data isolates the hard fraction within those developed areas. That is why 1.26% developed cover can coexist with a countywide mean impervious value of only 0.24%. Reading both layers together keeps a small mountain town or recreation area from being mistaken for a fully paved surface.
The 37.47% endpoint difference is dominated by forest-class changes
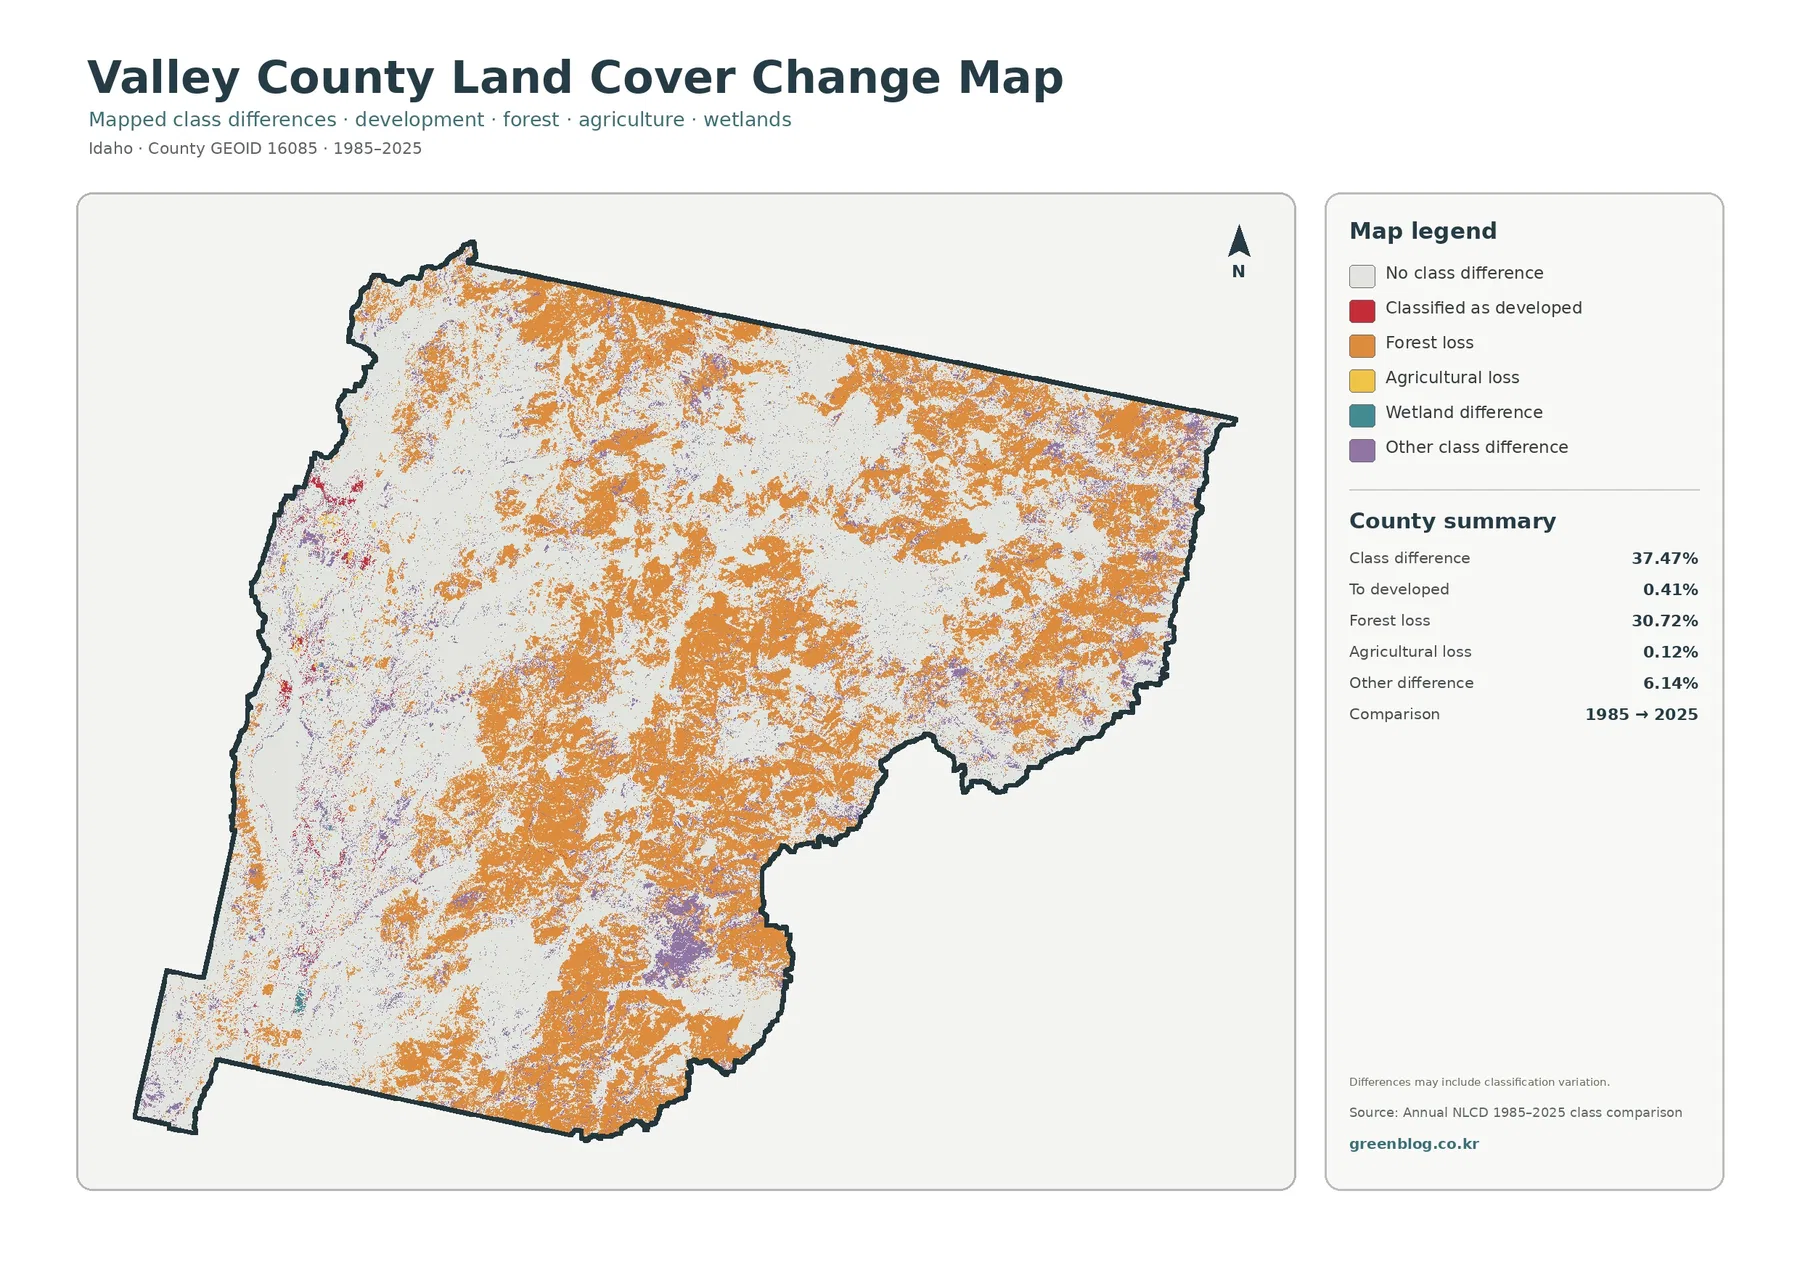
The 1985–2025 comparison reports a total class difference of 37.47%. Forest loss is the largest listed component at 30.72%, followed by 6.14% other difference, 0.41% classified as developed, and 0.12% agricultural loss. Wetland difference appears in the legend but is not given a separate percentage in the summary. A residual calculation or visual estimate should not be presented as an official wetland-change value when the source itself does not provide one.
Orange forest-loss cells are distributed across much of the northern, eastern, central, and southern mountain country. Red developed-conversion cells are much more concentrated in the western settlement corridor, while purple other differences form scattered patches in several mountain areas. The wide geographic spread is important. This comparison is not simply a record of expansion around McCall or Cascade; most of its colored area lies in landscapes that remain largely forest, shrubland, or grassland in the 2025 overview.
“Forest loss” here means that a cell classified as forest at the 1985 endpoint received another class in 2025. It does not identify logging, wildfire, insects, development, regrowth stages, or classification error as the cause. All of those possibilities require additional evidence. Seasonal differences, mixed pixels, sensor changes, and the way a classification system assigns one dominant label to a 30-meter cell can also affect endpoint comparisons. Intermediate annual imagery and local forest or fire records are needed before explaining any particular patch.
For that reason, use the change layer after the current land-cover map rather than in place of it. First establish that forest remains the largest 2025 class at 42.49% and shrubland is close behind at 39.47%. Then use the endpoint comparison to ask where labels differ between 1985 and 2025. That order keeps “current condition” separate from “difference between two observations,” which is especially important when the class-difference percentage is as large as it is in Valley County.
Lake corridors matter more than their countywide percentage suggests
Only 1.54% of Valley County is mapped as open water, yet the western side of the county is organized around several conspicuous lakes and the North Fork of the Payette River system. Payette Lake near McCall and Lake Cascade farther south are easy geographic reference points for explaining the settlement corridor, while Warm Lake and numerous smaller alpine waters add a different mountain setting. A percentage table tells how much area is water; the map explains where that water sits relative to forest, shrubland, and developed land.
This distinction is useful for recreation and environmental presentations. A countywide map can show why a small developed share still intersects with important shorelines, and why broad forest and shrub surfaces remain the background around most water bodies. Local recreation programs emphasize lake and outdoor use, but those visitor activities are not land-cover classes. The maps can provide physical context for a recreation discussion without being treated as a recreation-use or access map.
Planning questions require the same separation. Local planning and zoning rules are administered through Valley County and coordinated with cities and other jurisdictions, while the NLCD layer classifies observed surface cover. A parcel that is planned for future development may still appear as forest or shrubland in the 2025 image, and a developed cell does not automatically establish what uses are legally permitted there. For shoreline setbacks, future land use, or building review, use current county and city planning documents after using the land-cover map for broad context.
Choosing the right map for a county profile or classroom comparison
The general 2025 land-cover map is the strongest starting point for a county profile because it puts forest, shrubland, grassland, water, wetlands, and development in one frame. It immediately shows the near-even forest-shrub balance and the concentration of lakes and settlement along the west. For a lesson on rural land use, the forest-and-farmland map is more useful because the county’s very small 0.85% agricultural share becomes easier to compare with surrounding natural cover.
Use the impervious map when the question is about towns, roads, roofs, and paved surfaces rather than total developed land. It is especially effective beside the countywide map: the red developed classes in the first image can be compared with the much more limited high-impervious pixels in the second. Place the change map at the end of the sequence, after readers understand the current landscape, so its orange and purple classes are not mistaken for present-day forest or shrubland.
A two-map presentation is often clearer than placing all four images on one slide. Pair the 2025 overview with the impervious view for a settlement discussion, with the forest-and-farmland view for a land-use comparison, or with the 1985–2025 layer for an endpoint-change discussion. Keeping one main question per comparison also reduces the chance that map colors from different legends will be confused.
Scale, cell size, and print limits
Annual NLCD is based on 30-meter square cells. A single cell may contain trees, a road, lawn, bare ground, a creek edge, and part of a building, yet it receives one predominant land-cover label. Enlarging the map makes the cell larger on screen but does not recover parcel-level detail that was never present in the source. Site-specific questions need higher-resolution current imagery, local records, and sometimes field inspection.
The supplied current maps represent the 2025 observation year. Construction, wildfire, harvest, vegetation recovery, road work, changing water levels, and other events after that observation may not appear. The 1985–2025 comparison also summarizes two endpoints rather than every year of the 40-year period. If timing matters, consult intermediate imagery or annual datasets rather than treating the endpoint map as a complete history.
Each downloadable JPG measures 2480 × 1754 pixels. That is useful for on-screen graphics, documents, presentations, and moderate-size printing, but the package does not mark these files as meeting an A3 high-resolution reference. Test a large print before relying on small legend text. The maps are reference graphics rather than survey, parcel, regulatory wetland, flood-insurance, engineering, or legal boundary products.
What is included in the four-map JPG package
The ZIP contains one JPG each for 2025 land cover, forest and farmland, impervious surface and developed land, and 1985–2025 land-cover change. For most uses, begin with the countywide map and add one specialized view that matches the question. The files share the same county outline, making it easier to compare the western lake corridor, broad forest and shrub country, compact developed clusters, and areas where endpoint classes differ.
Frequently Asked Questions
Is Valley County mostly forest?
Forest is the largest single 2025 class at 42.49%, but shrubland is close behind at 39.47%. A more accurate description is a county divided almost evenly between forest and shrub country, with grassland, lakes, wetlands, and small developed or agricultural areas mixed into that larger pattern.
Do the hard-surface clusters show the exact limits of McCall, Donnelly, and Cascade?
No. They show where impervious surfaces such as roofs and pavement are concentrated, not legal city boundaries. The main clusters broadly align with the western settlement corridor, but exact municipal limits, street names, and parcels require official local maps.
Does 30.72% forest loss mean that nearly one-third of the county’s forest was destroyed?
No. It is an endpoint classification measure: cells labeled forest in 1985 that received another class in 2025. Wildfire, logging, regrowth, shrub conversion, seasonal conditions, and classification variation cannot be separated from this map alone, so causes and timing need additional imagery and records.
Sources and Reference Data
- MRLC Annual NLCD Data – official access to current and annual land-cover products
- USGS Annual NLCD Land Cover Classification – definitions and guidance for forest, shrubland, grassland, developed land, wetlands, and related classes
- U.S. Census Bureau TIGER/Line Shapefiles – official county-boundary reference for Valley County
- Valley County – Visit Valley County – official county context for Long Valley, Cascade, McCall, and local geography
- Valley County Waterways Management Plan – official information on Payette Lake, Lake Cascade, Warm Lake, the North Fork of the Payette River, and other county waterways
- Valley County Planning & Zoning – county services for zoning, planning, permits, and related local land-use questions
Map File Information
Download the map files associated with this page for reference, printing, and compatible visual projects.
- Included Files: Use only the versions confirmed in the article and supplied images
- File Type: Use the confirmed download contents
- Intended Use: Printing, education, presentations, and map-based projects
Related Maps
Green Map creates custom-edited map images using open geographic data sources such as geoBoundaries, Natural Earth, OpenStreetMap, and government open data.
These maps are edited visual materials, not raw data files, and are provided for education, documents, presentations, and graphic reference.