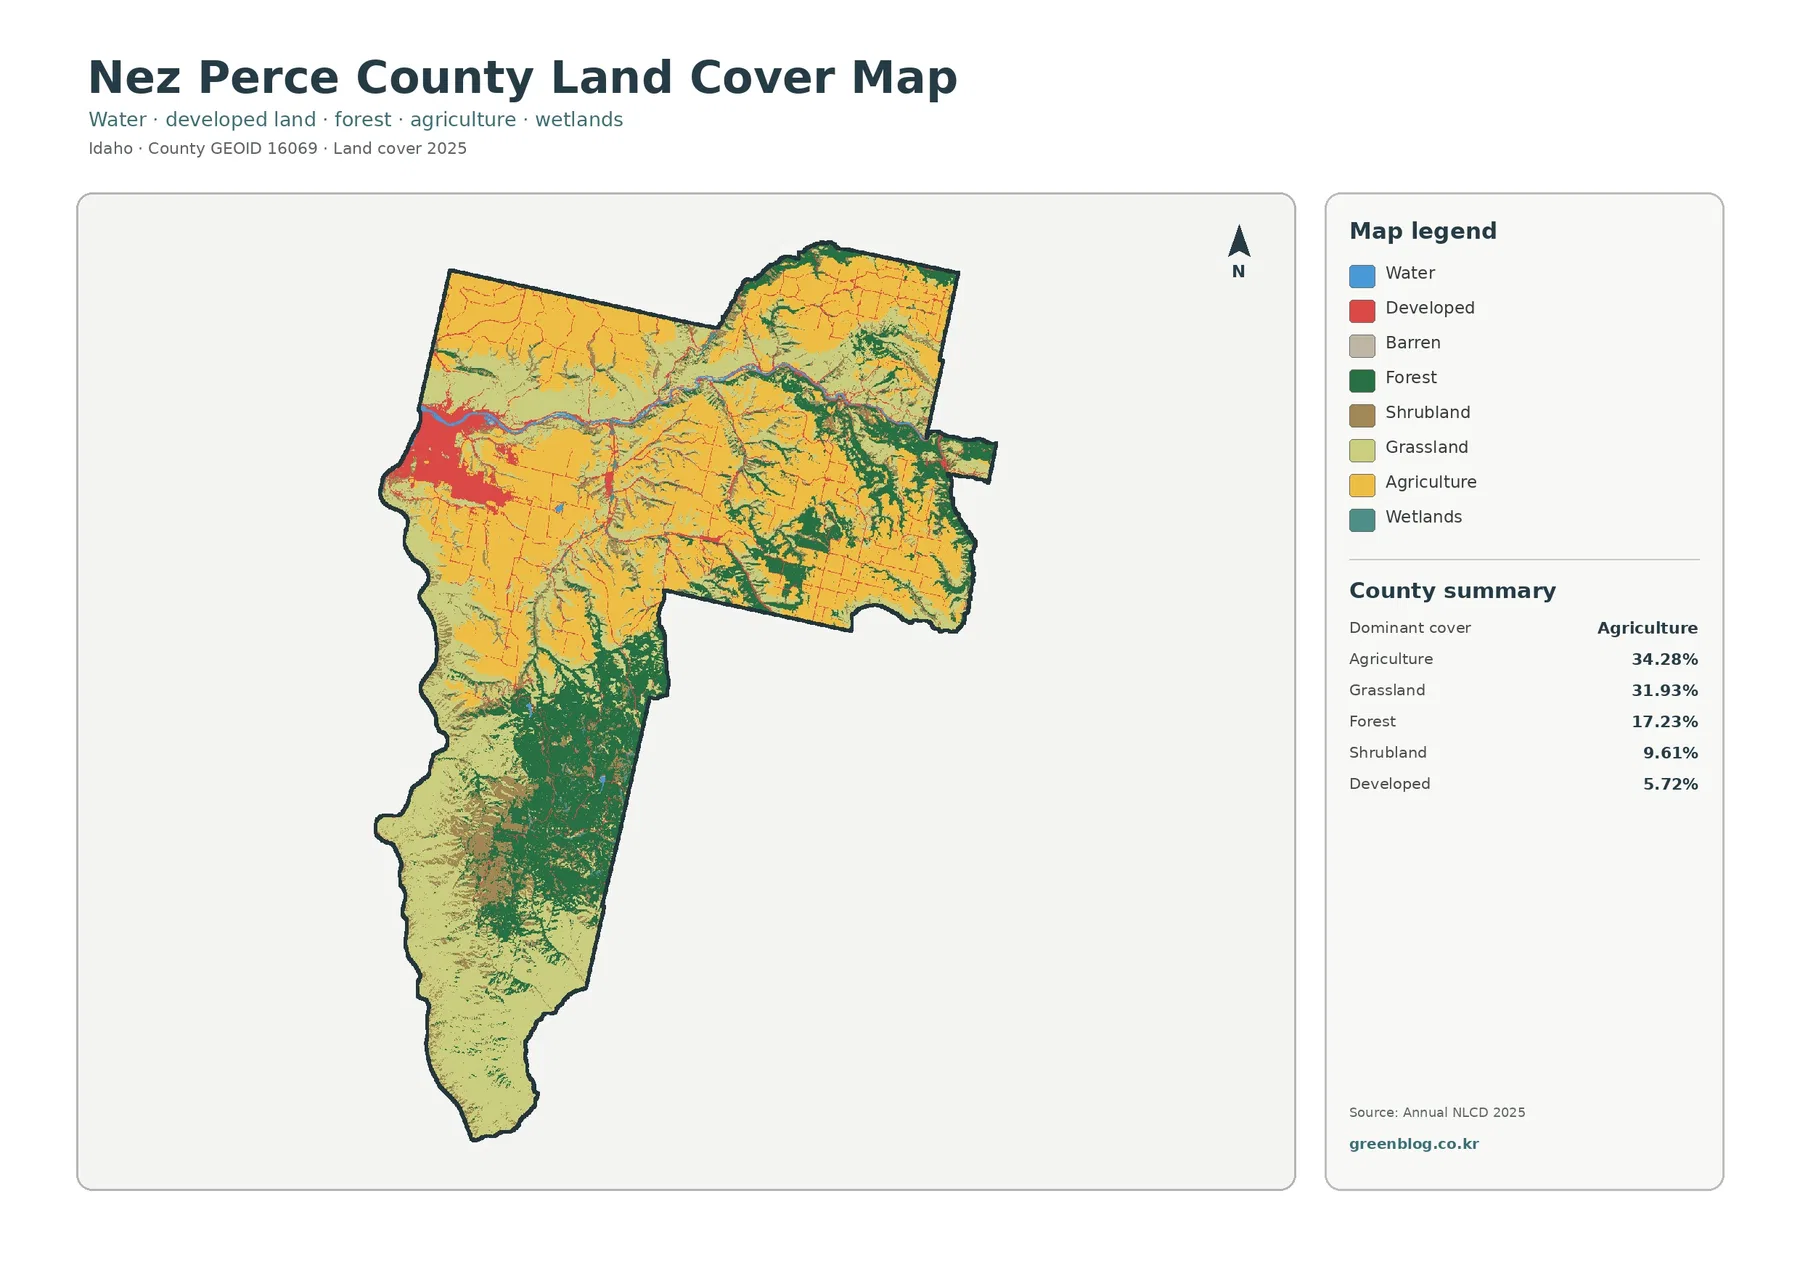
Nez Perce County has no single land-cover class that overwhelms the rest of the 2025 map. Agriculture accounts for 34.28% and grassland for 31.93%, while forest covers 17.23% and shrubland 9.61%. The strongest developed cluster, 5.72% of the county in total, sits in the northwest around Lewiston. Looking across all four maps makes it possible to compare this farm-and-grass mosaic with forested southern country, impervious surfaces, and the places where the 1985 and 2025 land-cover classes differ.
The four original JPG maps are available together in one download on this page. They are useful for printed reference sheets, classroom work, presentations, watershed orientation, and county-scale comparisons. Land cover describes what is on the ground as classified from satellite data: crops, grass, forest, water, developed surfaces, and related classes. It should not be read as a zoning map, parcel survey, ownership map, or statement about where development is legally allowed.
Table of Contents
The northwest corner is the easiest place to orient the entire map set
Start with the compact red area near the western edge of the broad northern part of the county. This is the clearest developed concentration in the general land-cover map, and it corresponds to the Lewiston area. Nez Perce County identifies Lewiston as the county seat, and county planning and emergency material places the city where the Clearwater River meets the Snake River. Those two rivers make the northwest corner especially useful as a reference point because the developed land, water corridors, and surrounding agricultural cover can all be located from the same part of the map.
The Clearwater runs westward across the northern portion of the county toward Lewiston, while the Snake follows the western side before the rivers meet. On the land-cover map, the blue water line is narrow compared with the much larger blocks of agriculture and grassland, yet it helps separate neighboring patterns. Developed land spreads most strongly near the confluence and becomes much smaller away from that corner. Small red traces elsewhere can be compared with communities and transportation corridors, but the raster map does not label every road or town and should not be used to identify a specific address.
Outside the Lewiston concentration, the county quickly shifts toward open and agricultural cover. Yellow agricultural areas occupy much of the north, center, and eastern side, while grassland and shrubland break those fields into more irregular shapes along slopes and incised drainage areas. Farther south, forest becomes a much stronger part of the picture. This visible transition from a developed river-city corner to farm country and then to more forested southern terrain gives the map a pattern that is easy to recognize even before reading the percentages.
Agriculture and grassland together cover about two-thirds of the county
Agriculture is the largest individual 2025 class at 34.28%, but grassland is close behind at 31.93%. Their near balance matters when reading the map. The yellow crop areas are broad across the upper and central portions of the county, yet they are repeatedly divided by lighter grassland, shrubland, drainage lines, and patches of other cover. The result is not one continuous farm block. Instead, cultivated ground and open vegetation form a large mosaic whose boundaries become more complex toward canyons and steeper terrain.
University of Idaho Extension describes small grains and alternative crops as important agricultural topics for Nez Perce County and north-central Idaho. That local context fits the large agricultural share shown by the Annual NLCD classification, but the map does not identify wheat, canola, legumes, hay, or any other crop individually. The 34.28% value is a land-cover class, not a crop-production statistic. Anyone who needs acreage by crop or year should use an agricultural dataset designed for that question rather than trying to infer crop type from the yellow pixels.
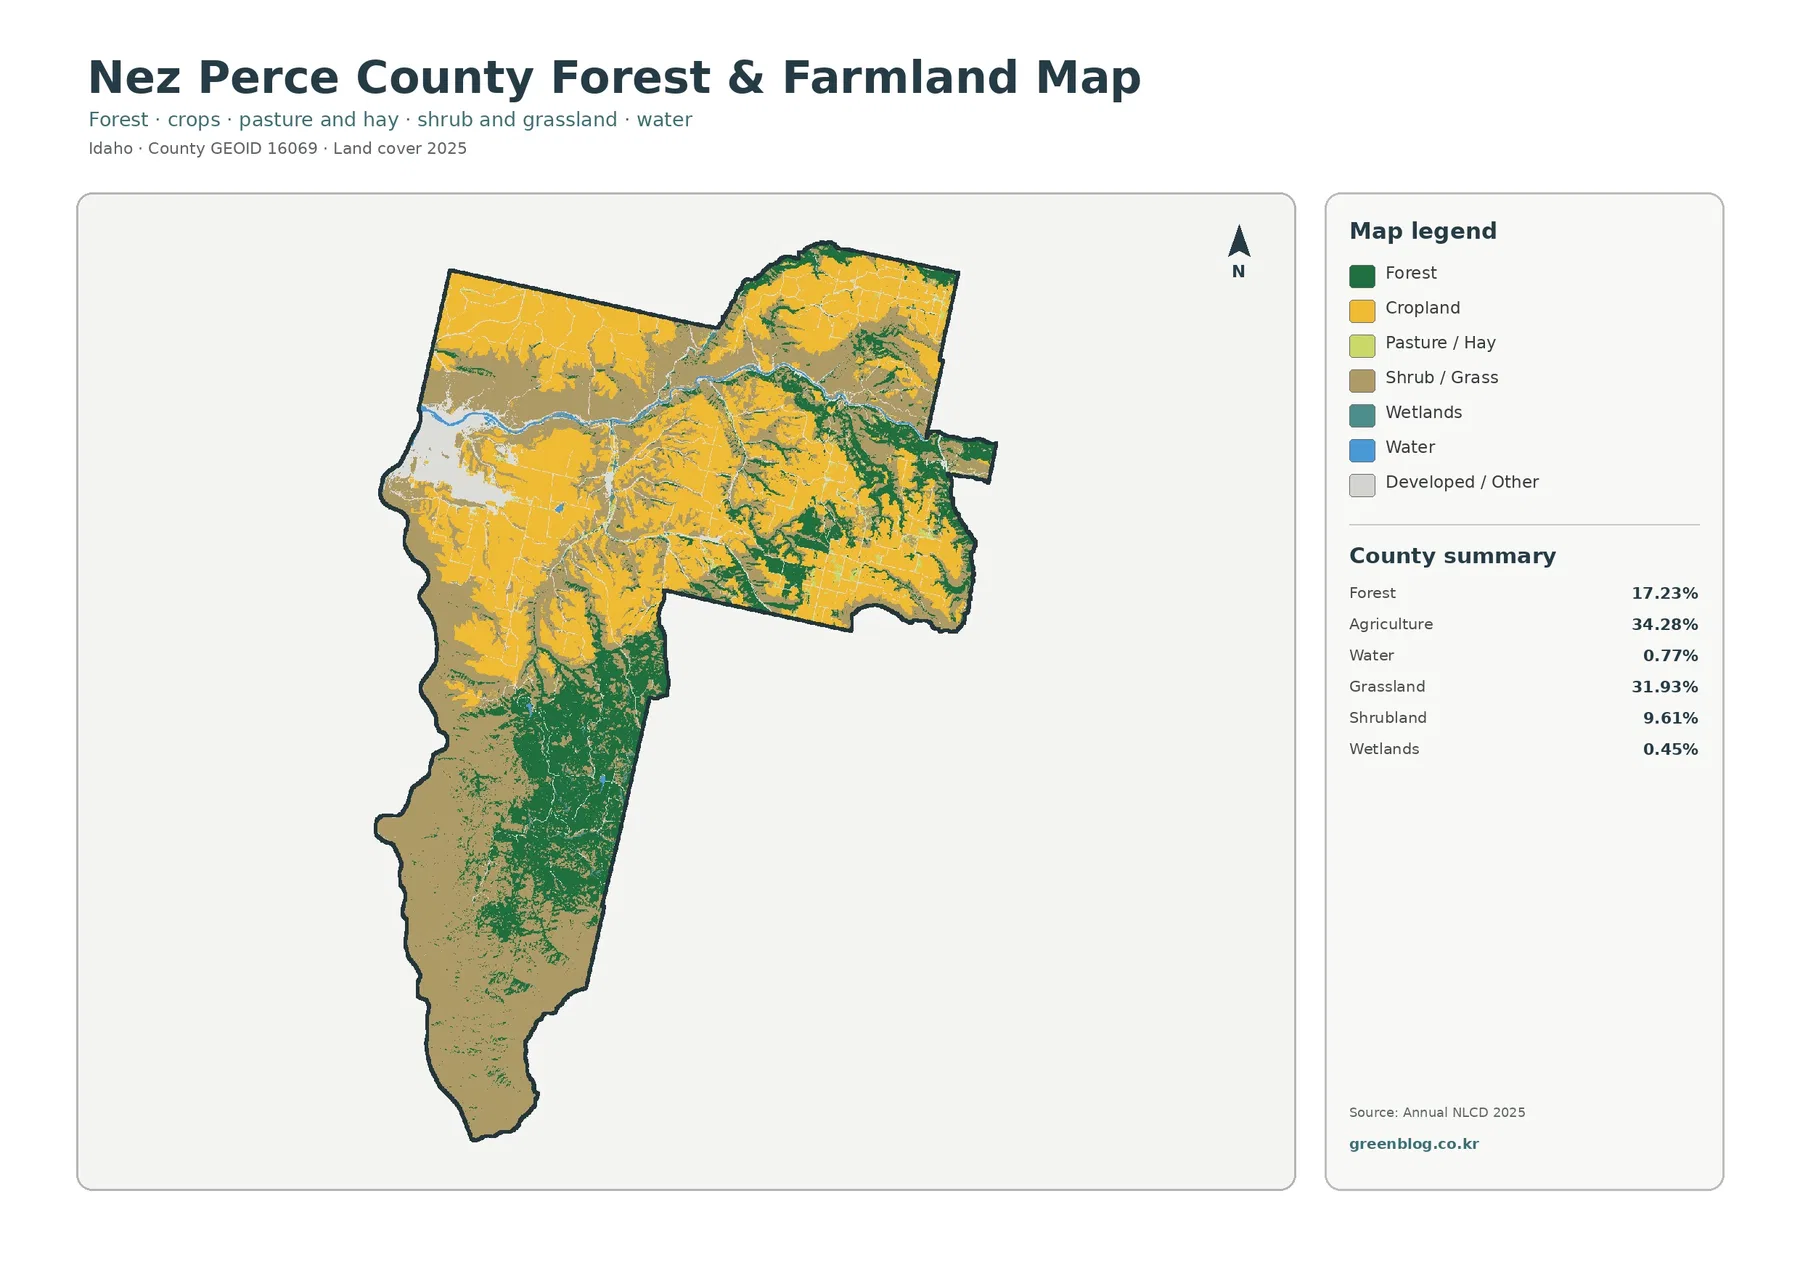
The forest-and-farmland view simplifies the contrast. Forest remains 17.23%, and its green areas become much more prominent in the long southern part of the county and along several valley or canyon margins to the east. Water is 0.77% and wetlands 0.45%. These are small countywide shares, but the mapped water and wetland cells can still be useful for finding river corridors and low-lying edges. Shrubland at 9.61% and grassland at 31.93% fill much of the space between cultivated ground and forest, especially where the landscape is more open.
Because agriculture and grassland are so close in total share, a black-and-white print can hide an important distinction. A color copy is preferable when the goal is to compare the large farm areas with neighboring open vegetation. The legend should stay attached to the map, especially if the figure is cropped for a slide. Forest, grassland, and shrubland may all appear visually “green” in a simplified reproduction even though they represent different 2025 classes and should not be combined without a specific analytical reason.
Impervious surface is low countywide but sharply concentrated around Lewiston
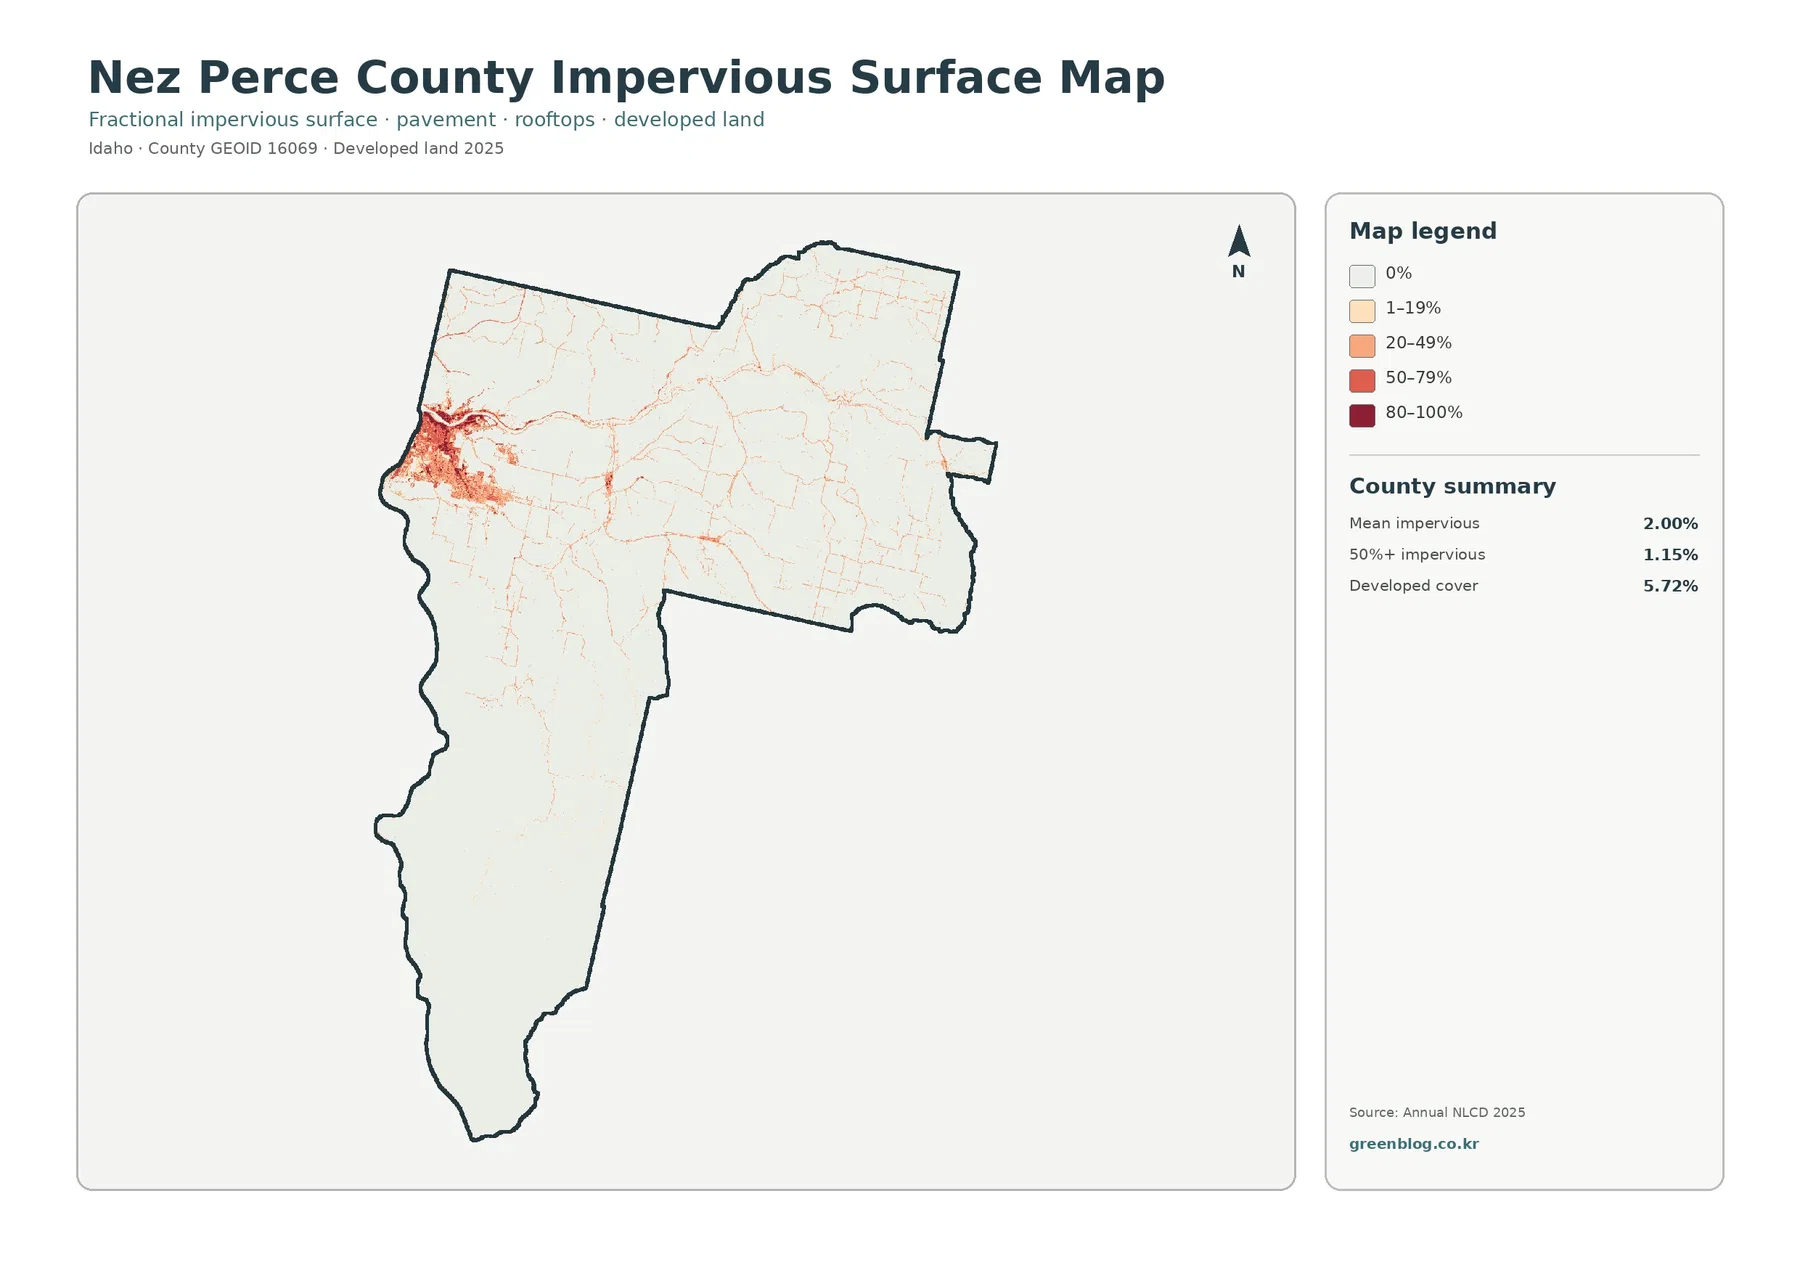
The impervious-surface map answers a different question from the developed-land class. Impervious percentage estimates the share of a raster cell occupied by hard surfaces such as pavement and rooftops. The countywide mean is 2.00%, and 1.15% of the county is mapped above 50% impervious. Developed land covers 5.72%, a larger share, because a developed land-cover class can include yards, trees, soil, and other surfaces that are not themselves impervious. The two numbers therefore should not be expected to match.
The spatial pattern is much more concentrated than the general developed class makes it look. The highest values form a dense patch in the northwest around Lewiston, with lighter linear traces extending along roads and smaller settlement areas. Most of the agricultural plateau, grassland, shrubland, and forested southern area remains very pale. This makes the impervious map particularly useful when a reader wants to distinguish the urban core from developed areas that still contain substantial permeable ground.
A narrow orange or red line should not be treated as an exact road footprint. Annual NLCD uses 30-meter raster cells, so a cell can contain pavement, a roadside shoulder, vegetation, and other surfaces at the same time. The map works well for county-scale concentration and comparison, but it is not precise enough to calculate the paved area of a parcel, parking lot, or single building site. Detailed local GIS or high-resolution aerial imagery is the better source for those tasks.
The 1985–2025 change map needs more caution than the current-cover maps
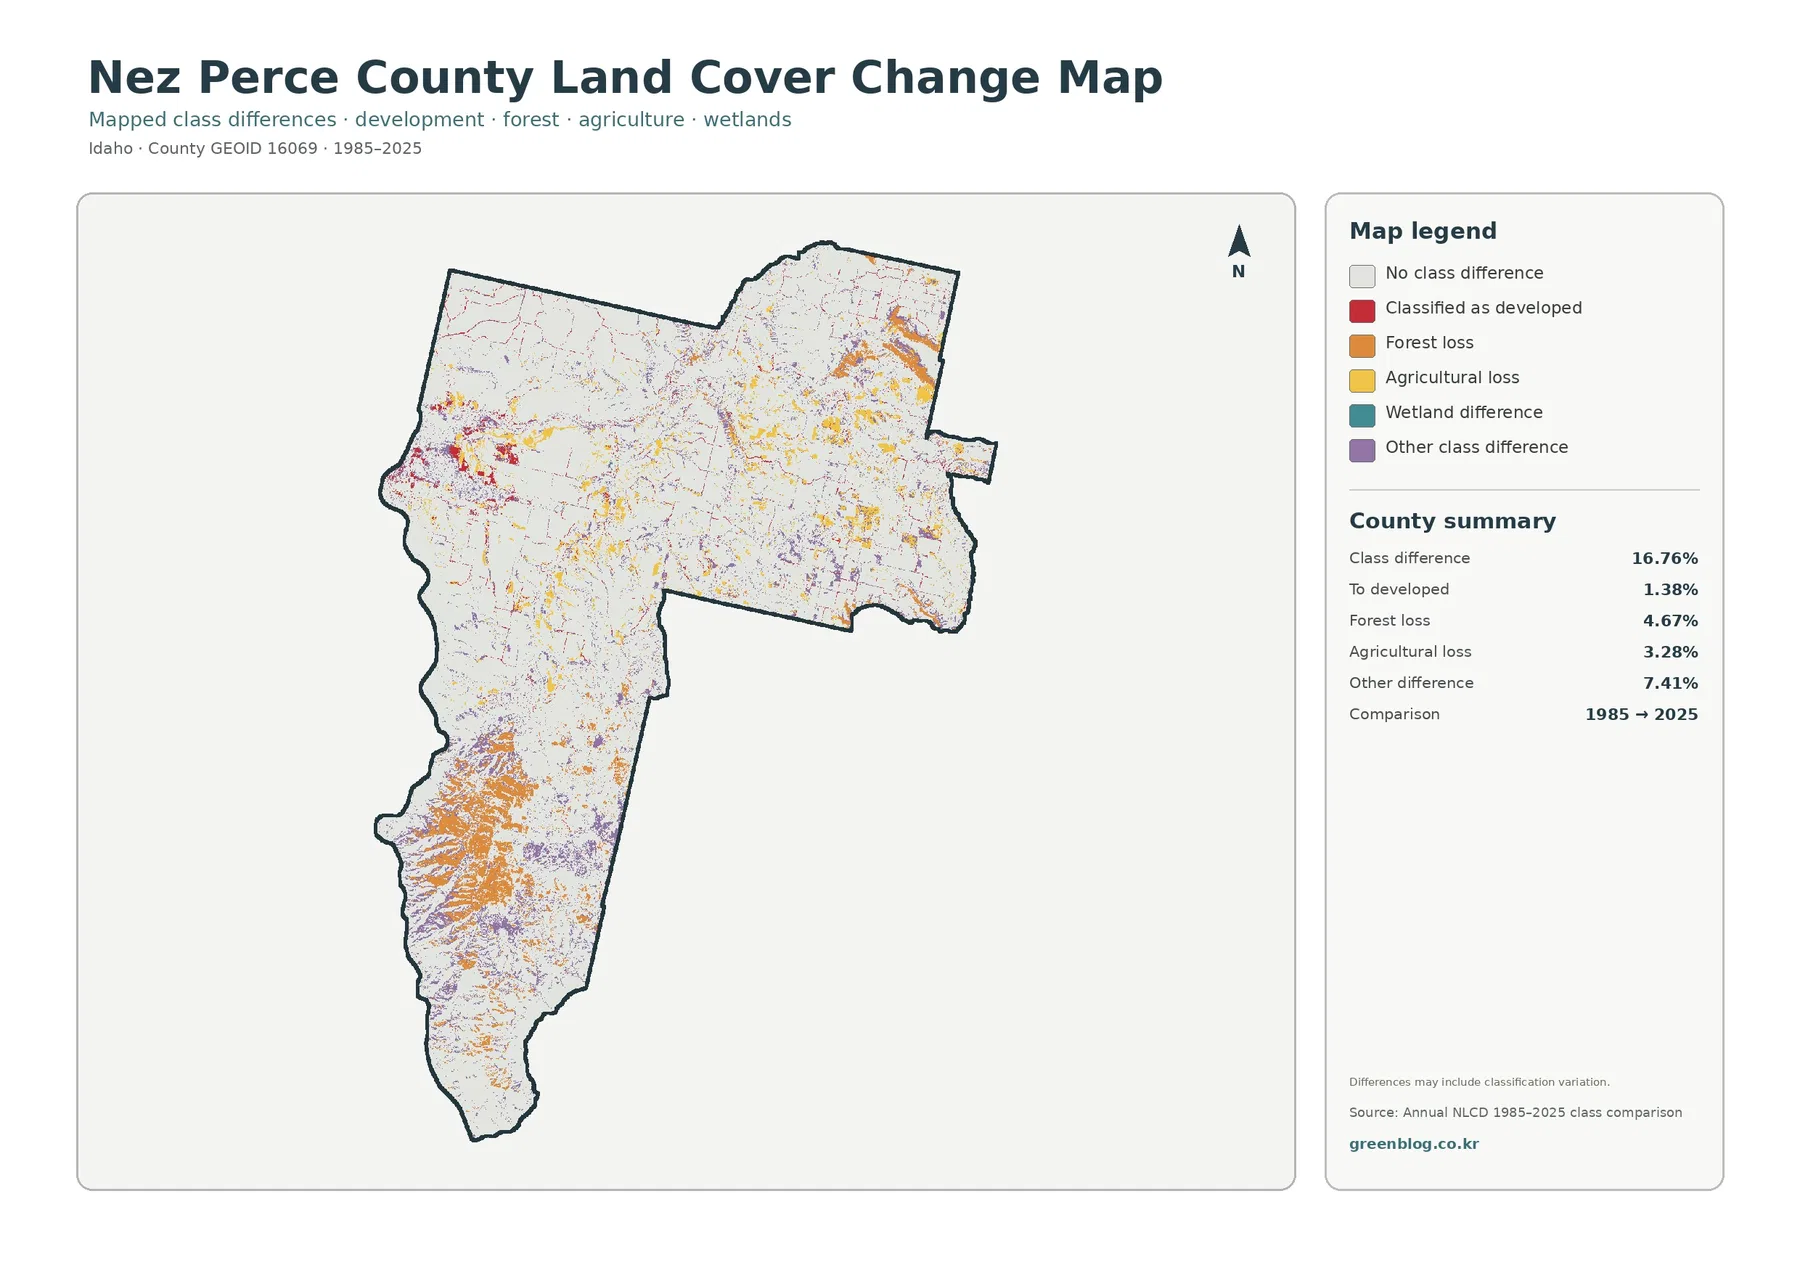
The mapped class difference between 1985 and 2025 is 16.76%. Within that total, 1.38% is classified as a change to developed land, 4.67% as forest loss, 3.28% as agricultural loss, and 7.41% as other class difference. The map also includes a wetland-difference category, but the county summary does not provide a separate percentage for it. Rather than inventing a missing value, the safest reading is to use the displayed totals and the visible pattern of colored cells.
Orange forest-loss pixels are especially noticeable through parts of the long southern section and along several eastern slopes. Yellow agricultural-loss cells are scattered through farm country, while red change-to-developed cells are easiest to find near Lewiston and a few other settled corridors. Purple other-class differences occur across many parts of the county and make up the largest single change category at 7.41%. That category can include shifts among open-cover classes and other classification differences that are not equivalent to one specific land-use conversion.
The figure itself warns that differences may include classification variation. A cell can change class because the ground truly changed, but differences in sensors, source imagery, classification rules, mixed pixels, or the position of a class boundary can also matter. For that reason, the 16.76% figure should not be described as the share of the county that was “developed,” “cleared,” or “lost.” It is a screening measure that points to locations worth checking with intermediate Annual NLCD years, aerial photographs, forestry records, agricultural information, or local planning documents.
The forest-loss category deserves the same care. A 4.67% mapped loss does not identify the cause or year of a forest transition. It may direct attention to places where the 1985 and 2025 classifications differ, but it cannot by itself distinguish harvest, fire, vegetation succession, conversion to another cover type, or classification uncertainty. A time series is needed before making a statement about when and why a particular area changed.
River corridors and the southern uplands provide three practical map checkpoints
A simple way to compare the four figures is to keep three checkpoints in mind. First, locate the Lewiston developed cluster in the northwest. Second, follow the Clearwater River across the upper part of the county and the Snake along the western side. Third, look at the long southern section where forest becomes more extensive and open grass or shrub cover surrounds it. Moving through the maps with those checkpoints makes it easier to match the same location even though every legend uses different colors and categories.
County emergency material describes a landscape that ranges from river gorges and the Clearwater Plateau to mountainous terrain, with substantial variation in elevation and precipitation. The Sheriff’s Office also describes the county as a mix of urban, rural, and wilderness settings and notes the Snake, Clearwater, and Salmon rivers within its jurisdiction. Those descriptions help explain why one county can contain a compact urban concentration, broad agricultural country, open grass and shrub cover, and forested slopes. The land-cover maps show those surface patterns, while the local sources provide geographic context for them.
For watershed or environmental education, the maps can be paired rather than treated as four isolated graphics. The general map gives the full class mix, the forest-and-farmland map reduces visual complexity, the impervious map highlights hard surfaces near settlements, and the change map marks locations where the endpoint classes differ. A presentation can use the same river or town reference point across all four figures so an audience can see how each layer changes the question without changing the county boundary.
The downloadable JPG set is also useful when a project needs a consistent series of figures rather than a web screenshot. Keeping the title, legend, year, and source visible reduces the chance of mixing 2025 current cover with the 1985–2025 comparison. If the maps are resized, avoid cropping away the legend or county summary because the percentages and class names are necessary to interpret the colors correctly.
What these maps can answer—and what requires a different source
Annual NLCD is a 30-meter raster product, so it generalizes the ground into grid cells. A field edge, narrow stream, tree row, house, and road can all occur within a small area, but the final land-cover layer must assign each cell to a mapped class. This is appropriate for countywide comparisons such as the 34.28% agriculture share or the concentration of impervious surface around Lewiston. It is not a substitute for parcel boundaries, a survey, site inspection, or a high-resolution engineering map.
Administrative boundaries need similar care. County sources note that the Nez Perce Indian Reservation occupies a large portion of the county east of Lewiston, but reservation boundaries are not drawn on these land-cover figures. A forest, farm, grassland, or developed pixel identifies surface cover, not ownership or jurisdiction. The same applies to zoning and city limits. Readers working on legal, planning, tribal-jurisdiction, or property questions should consult the appropriate official boundary and planning layers.
The observation year matters as well. The current-cover maps describe the 2025 classification, so later construction, fire, harvest, vegetation recovery, or crop changes may not appear. The endpoint change map compresses forty years into a comparison between 1985 and 2025 and does not show every transition in between. For time-sensitive work, check the latest Annual NLCD release and local imagery; for change analysis, compare several intermediate years rather than relying on a single start-to-end difference.
Finally, the percentages are county summaries, not promises about every location inside the boundary. Agriculture and grassland together occupy roughly two-thirds of the mapped area, yet individual canyons, river edges, wooded slopes, wetlands, and settlements can be very different from that countywide average. The most informative reading combines the summary numbers with the actual pattern on the map instead of using either one alone.
Frequently Asked Questions
Why does the northwest corner of the Nez Perce County maps look so different from the rest of the county?
That corner contains the Lewiston area, the county’s strongest developed and impervious-surface concentration. County sources also place the Clearwater–Snake River confluence at Lewiston, so urban land and two major river corridors meet in the same part of the map.
Why is developed land 5.72% while mean impervious surface is only 2.00%?
They measure different things. Developed land is a land-cover class that can include vegetation and soil around buildings and roads, while impervious percentage estimates hard surfaces such as pavement and rooftops within each raster cell.
Does the 16.76% class difference mean that 16.76% of Nez Perce County was physically converted between 1985 and 2025?
No. The map states that classification variation may be included, and 7.41% is labeled as other class difference. Forest loss 4.67%, agricultural loss 3.28%, and change to developed 1.38% are useful screening categories, but intermediate years and other evidence are needed to identify the timing and cause of real change.
Sources and Reference Material
- MRLC – Annual NLCD Data (official source for the 2025 land-cover data and the 1985–2025 class comparison)
- U.S. Geological Survey – Annual NLCD Land Cover Classification (land-cover classes and the 30-meter Annual NLCD framework)
- University of Idaho Extension – Agriculture in Nez Perce County (local information on small grains, alternative crops, and agricultural programs)
- Nez Perce County Sheriff’s Office (county context for Lewiston, local communities, the Snake, Clearwater, and Salmon rivers, and Craig Mountain)
- Nez Perce County Multi-Hazard Mitigation Plan 2025–2030 (official geographic context for the Clearwater Plateau, river systems, terrain, and the Clearwater–Snake confluence)
Map File Information
Four JPG land-cover maps for Nez Perce County are provided together in one ZIP file.
- Included Versions: land cover, forest and farmland, impervious surface and developed land, land-cover change
- File Type: ZIP containing four JPG files
Related Maps
Green Map creates custom-edited map images using open geographic data sources such as geoBoundaries, Natural Earth, OpenStreetMap, and government open data.
These maps are edited visual materials, not raw data files, and are provided for education, documents, presentations, and graphic reference.