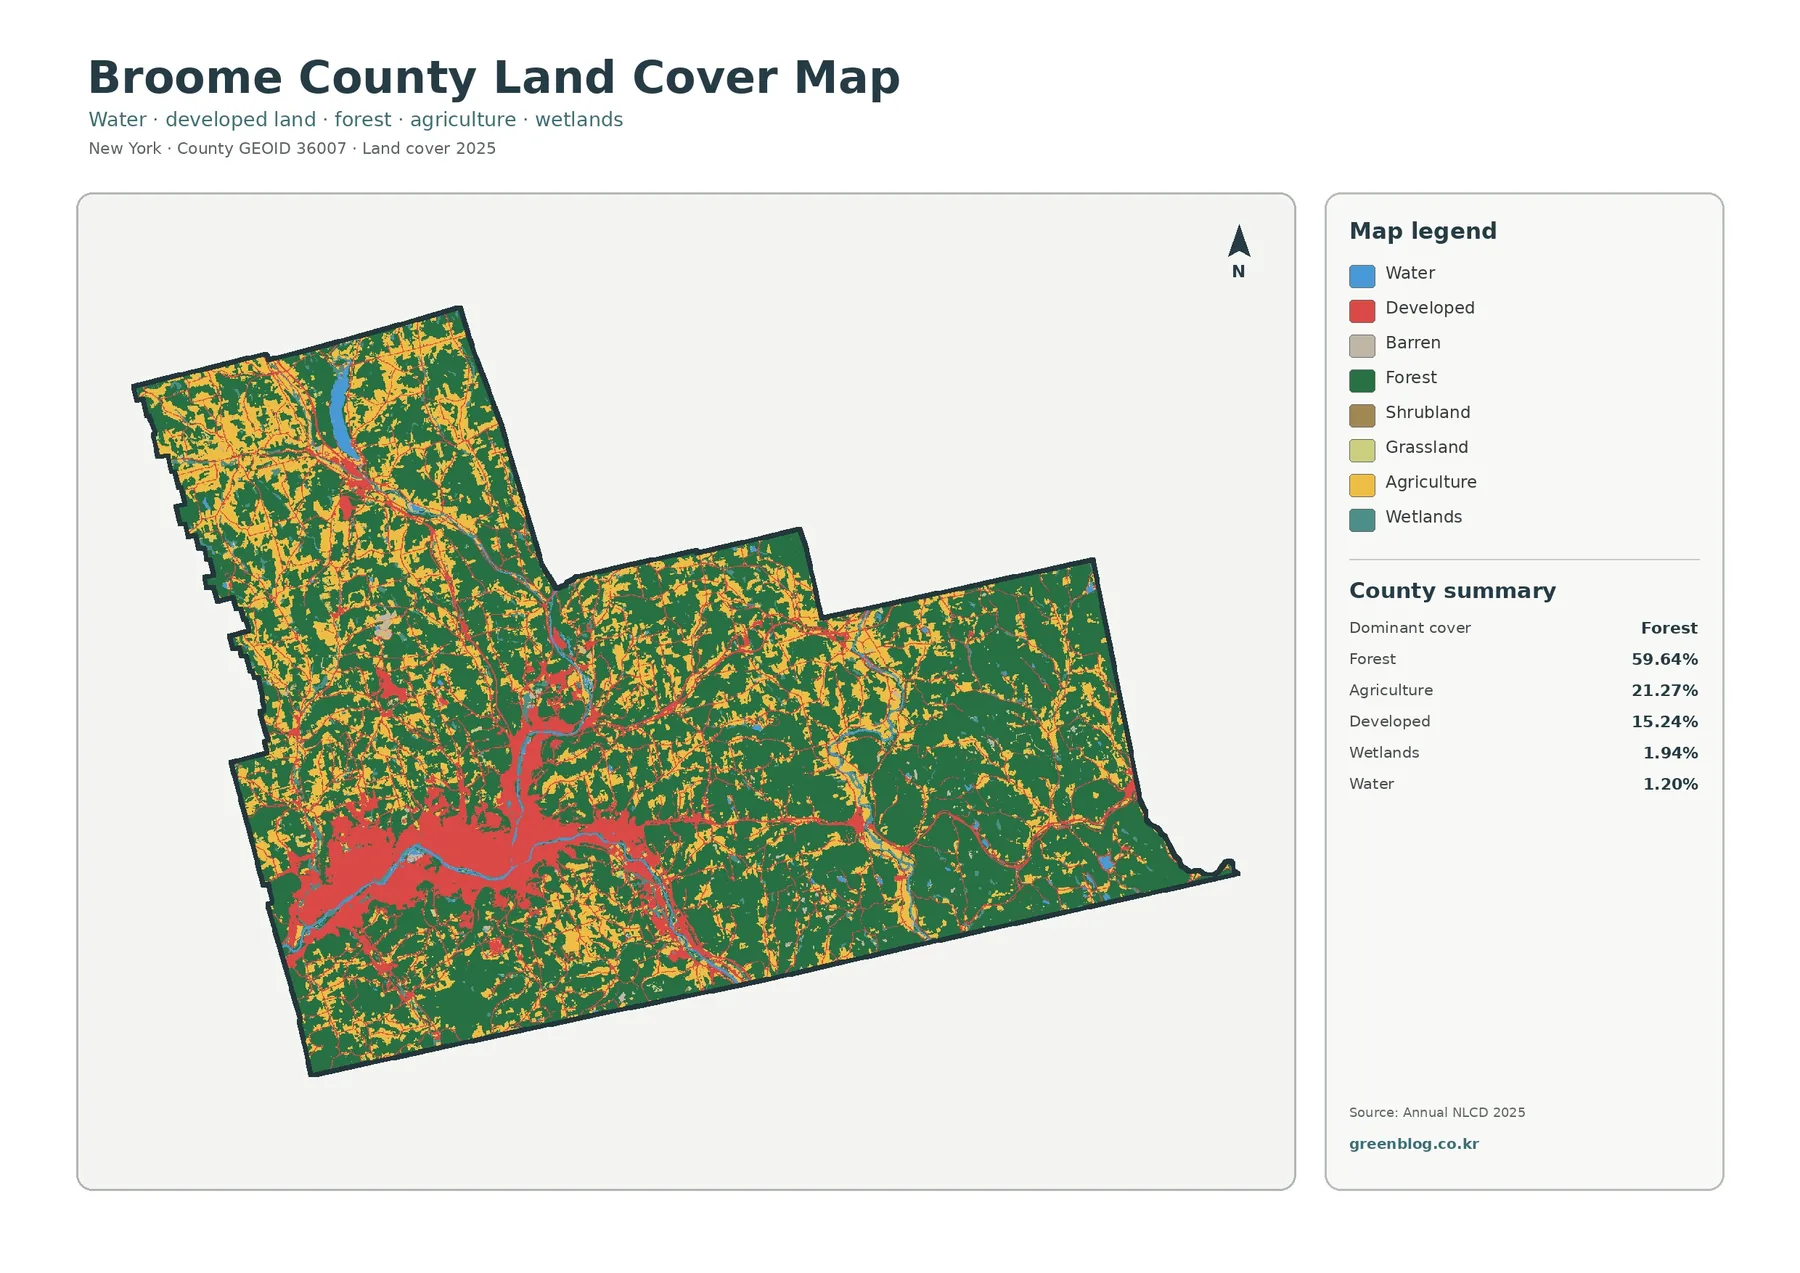
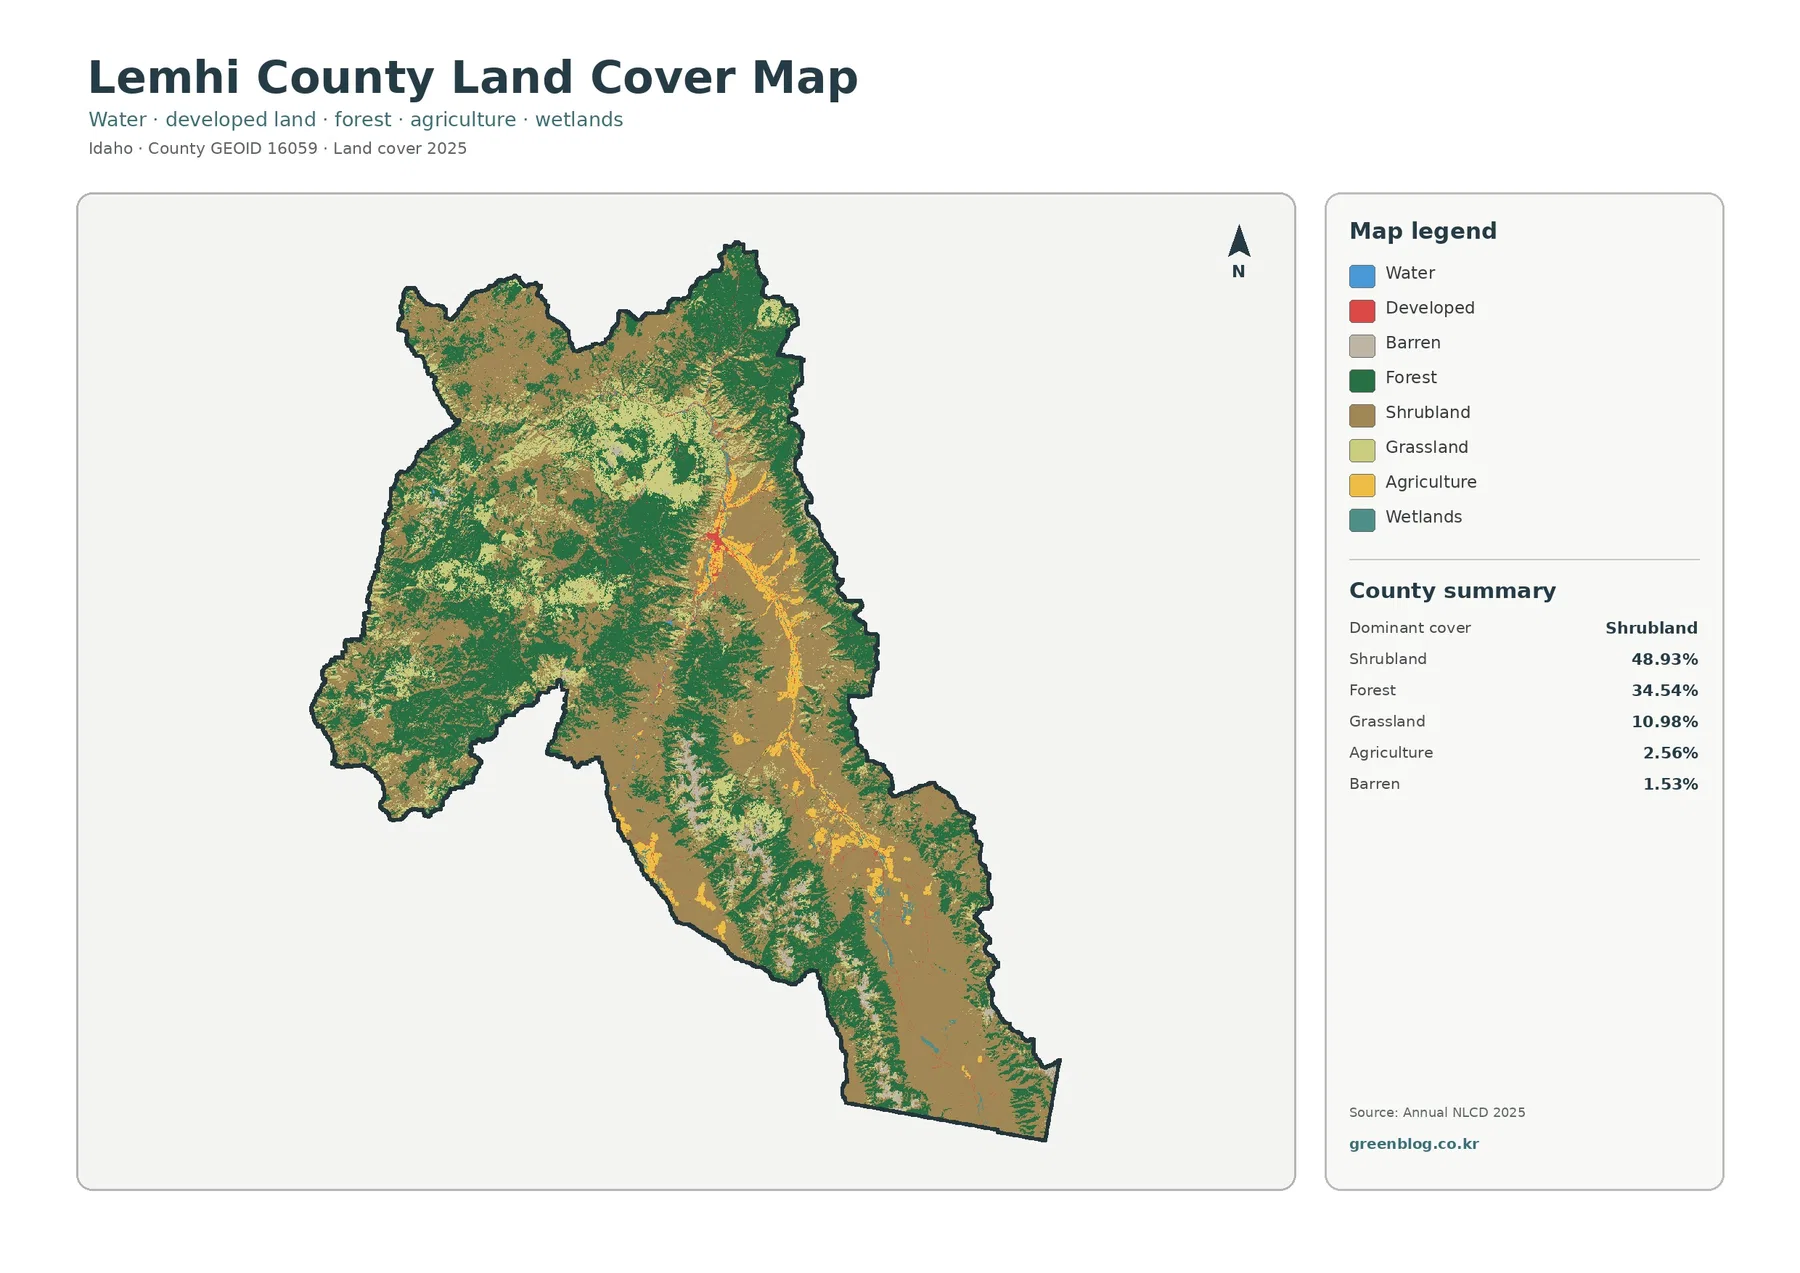
Lemhi County is visually dominated by two broad surface types: open shrub-covered country and large forested mountain areas. The 2025 summary assigns 48.93% of the county to shrubland and 34.54% to forest, with grassland at 10.98%. Agriculture accounts for only 2.56%, yet it stands out because it forms a narrow, recognizable ribbon through the Lemhi Valley rather than spreading evenly across the county.
Four views are provided here: current land cover, forest and farmland, impervious/developed surface, and mapped class differences from 1985 to 2025. The four original JPG maps are available together in one ZIP for print or reference use. These products describe surface cover, not property ownership, parcel boundaries, zoning, water rights, or whether a site can legally be developed.
Table of Contents
The Lemhi Valley is a small percentage with an outsized visual role
A countywide percentage can hide where a class actually occurs. Agriculture is a good example in Lemhi County. Yellow agricultural pixels occupy only 2.56% of the 2025 total, but they form a long, narrow pattern that can be followed from the Salmon area southeast through the Lemhi Valley toward Leadore. The official county agriculture page describes beef cattle and hay production as major parts of the local agricultural economy, and Idaho fisheries material describes the Lemhi River running through a broad valley of agricultural land before meeting the Salmon River at Salmon.
That valley ribbon is surrounded by much larger expanses of shrubland, forest, and grassland. On the eastern and southeastern side of the county, shrub tones cover broad areas, while darker forest blocks become more extensive across western and northern mountain country. Grassland appears as lighter openings within and between those larger classes. The result is not a simple split between farms and wild land; it is a narrow settled valley embedded in a much larger mountain landscape.
The map also helps explain why an agricultural class can matter locally even when its countywide share is small. Communities such as Salmon, Carmen, Tendoy, and Leadore are associated with the valley setting, while the broad mountain areas around them contain far less mapped agriculture. A reader interested in ranching, irrigation, or valley settlement should therefore follow the location of the agricultural and pasture/hay colors rather than judge importance from the 2.56% total alone.
Forest and open range occupy most of the mountain country
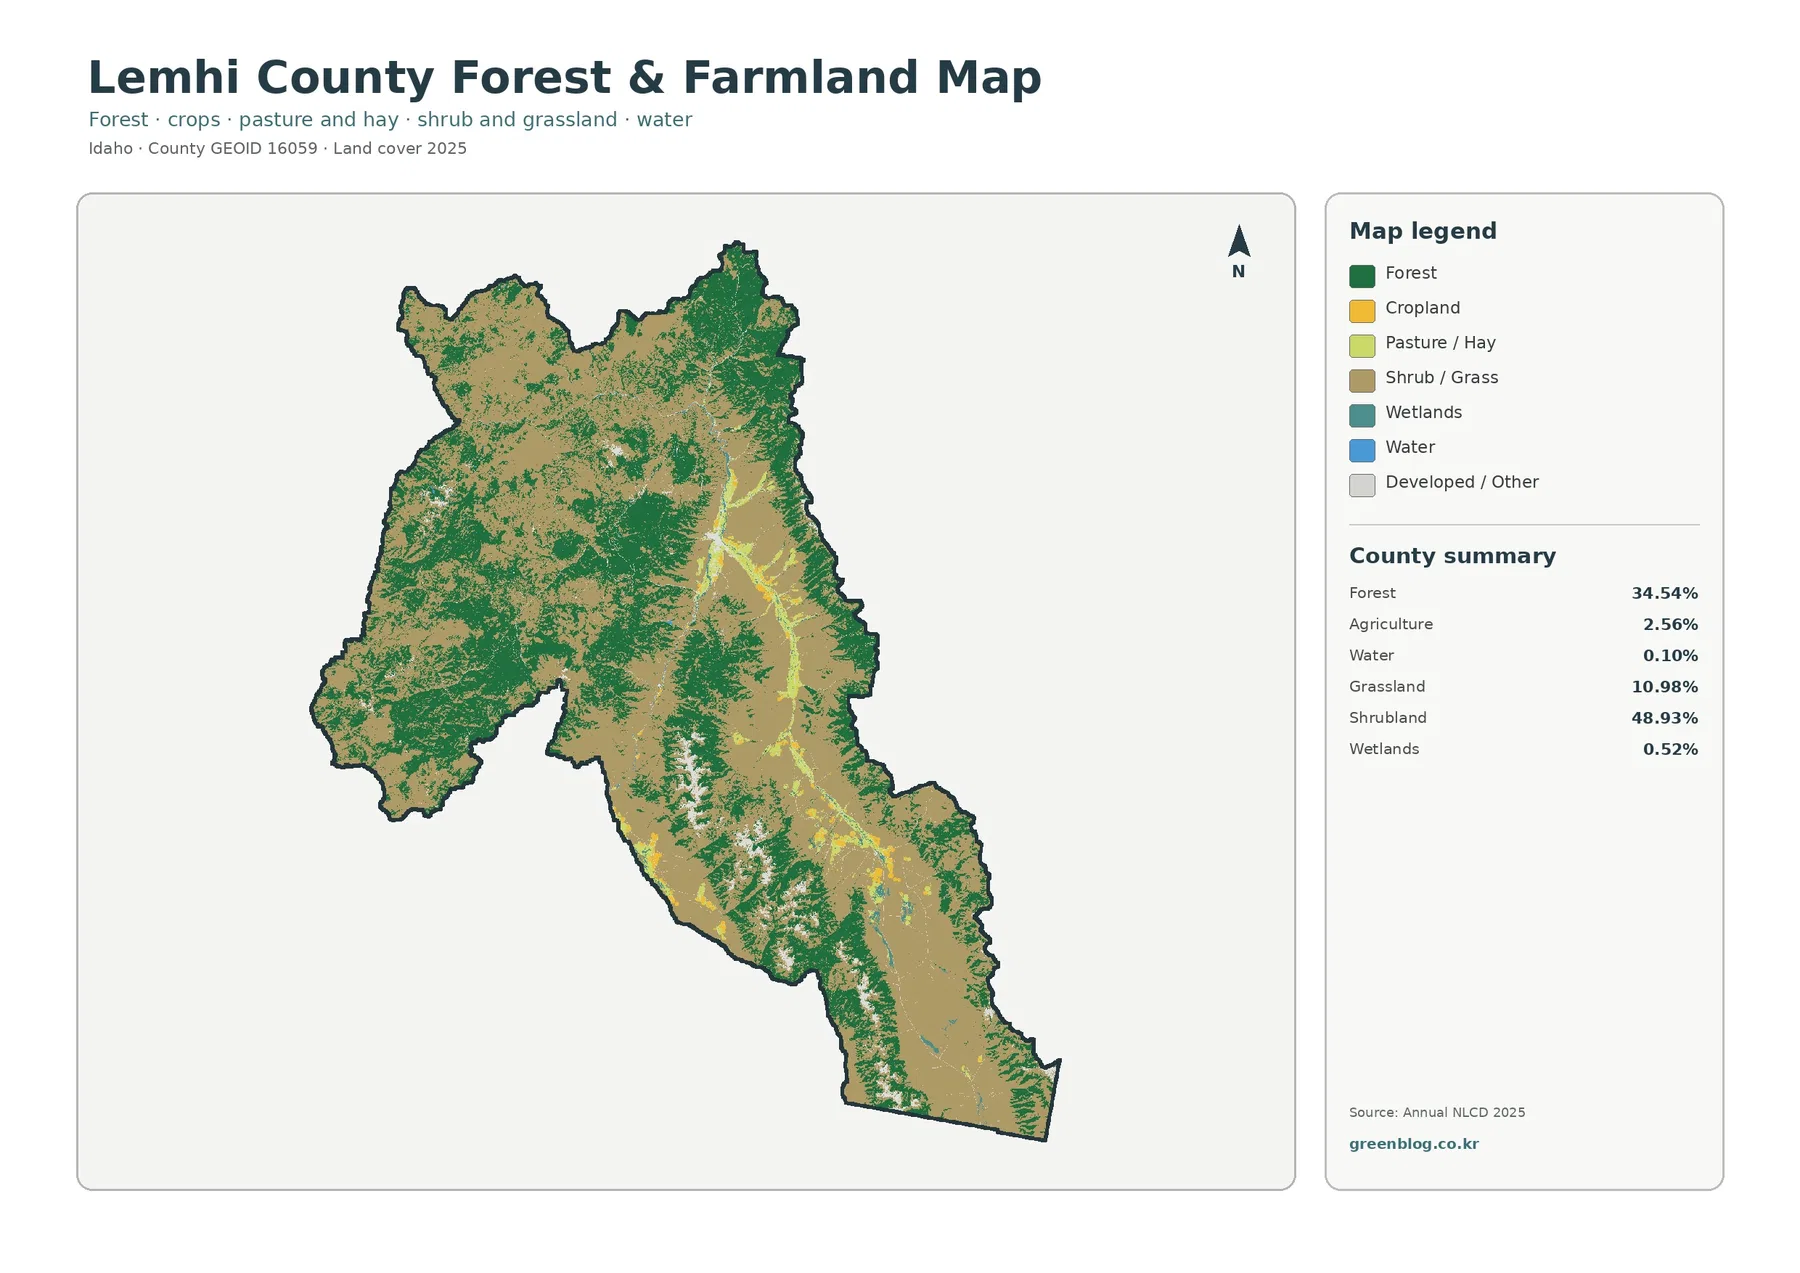
The simplified forest-and-farmland view makes the mountain-versus-valley contrast easier to follow. Forest is shown as broad dark-green blocks across much of the western and northwestern county, with additional forested belts through the central and eastern mountains. Shrub and grass cover fills many of the open slopes and interior valleys between those forested areas. Because the legend reduces the number of categories, the county looks less visually busy than it does on the full land-cover map.
Forest totals 34.54%, while shrubland and grassland together account for nearly three-fifths of the county. Those figures fit what the image shows: extensive open country is interwoven with large wooded mountain zones, and neither class is restricted to one neat corner. The boundary between them is irregular, reflecting a landscape of ridges, slopes, broad valleys, and smaller drainage corridors rather than a checkerboard of land-cover blocks.
Pasture/hay and cropland remain concentrated in the Lemhi Valley and a few smaller open areas. They should not be confused with the much larger shrub/grass category. Both may appear as open terrain, but the classification separates agricultural cover from natural or semi-natural grass and shrub cover. That distinction matters for a county where ranching is important but most of the land surface is not mapped as cultivated agriculture.
Water accounts for 0.10% and wetlands 0.52% of the county summary. Those small totals explain why blue and teal do not dominate the page even though the county contains major river systems. Narrow rivers and wetland corridors can occupy important ecological positions while still contributing little to a countywide area percentage, and a 30-meter raster may simplify channels that are narrower than the mapping cell.
Built surfaces are concentrated near Salmon rather than spread across the county
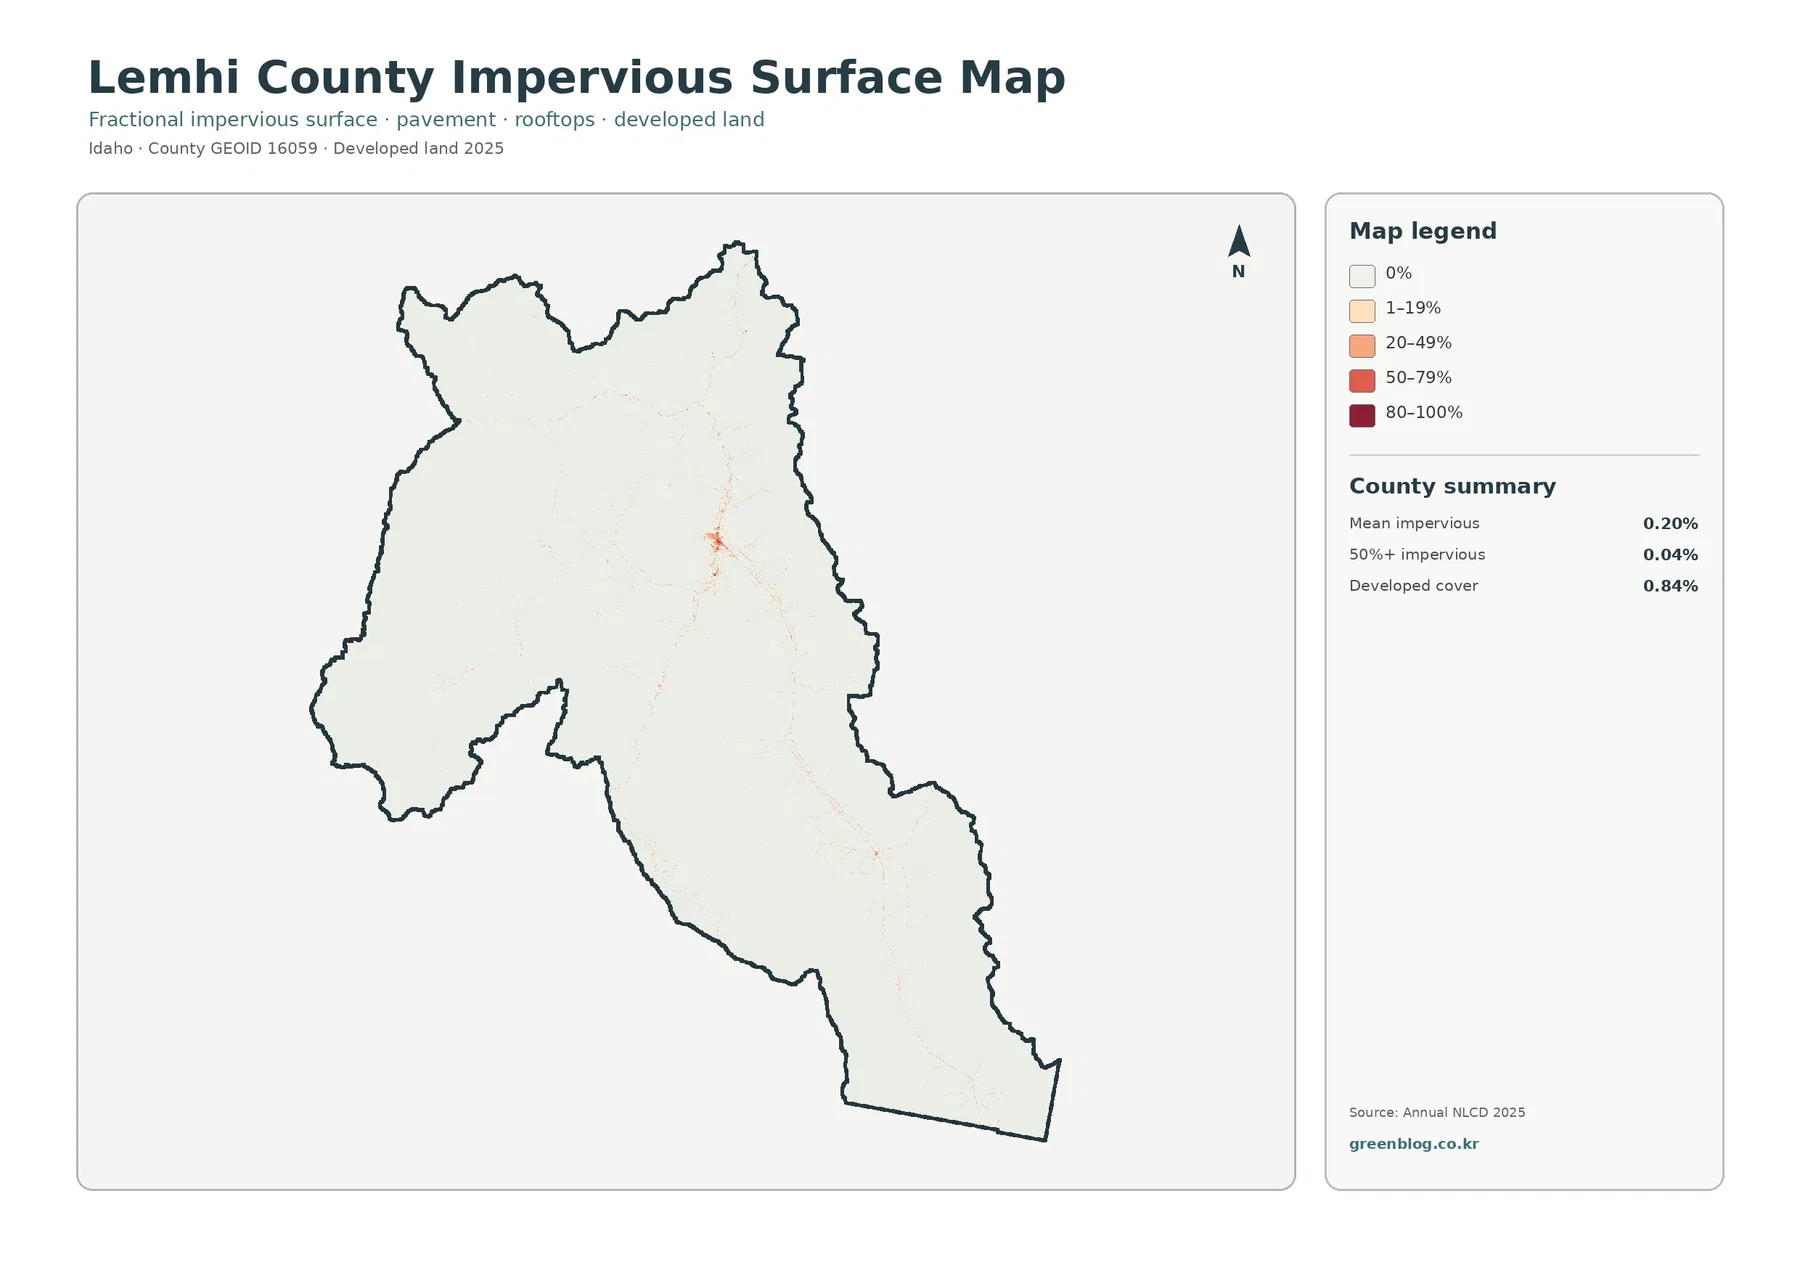
The impervious map asks a different question from the land-cover map. Impervious surface means pavement, rooftops, parking areas, and other hard surfaces that do not readily absorb water. Lemhi County has a mean impervious value of 0.20%, and only 0.04% of the county is mapped above 50% impervious. Developed land is 0.84% of the 2025 land-cover summary. Those numbers are low because most of the county is mountain, range, forest, or open valley land rather than dense settlement.
Salmon produces the clearest red cluster on the impervious map. From that area, faint lines and small concentrations extend southeast along the Lemhi Valley, with another smaller developed signal near the Leadore area. Large western mountain sections remain nearly white on the impervious layer. The contrast is useful because it separates the concentration of hard surfaces from the much broader developed-land class shown on the general map.
Developed cover and impervious percentage should not be treated as interchangeable measurements. A low-density developed cell can contain lawns, trees, bare soil, and buildings together, so its impervious share may be modest. A compact town center can contain a much higher fraction of pavement and rooftops within a smaller area. Comparing the two maps therefore distinguishes the footprint of development from the density of hard surface inside that footprint.
The fine linear traces visible on the impervious layer are useful for orientation, but they are not a road survey. A 30-meter raster cannot provide lane width, pavement condition, right-of-way boundaries, or exact building footprints. For site design, drainage calculations, or parcel-level infrastructure work, current local GIS and engineering data are needed in addition to this county-scale product.
The 1985–2025 comparison is dominated by forest-related class differences
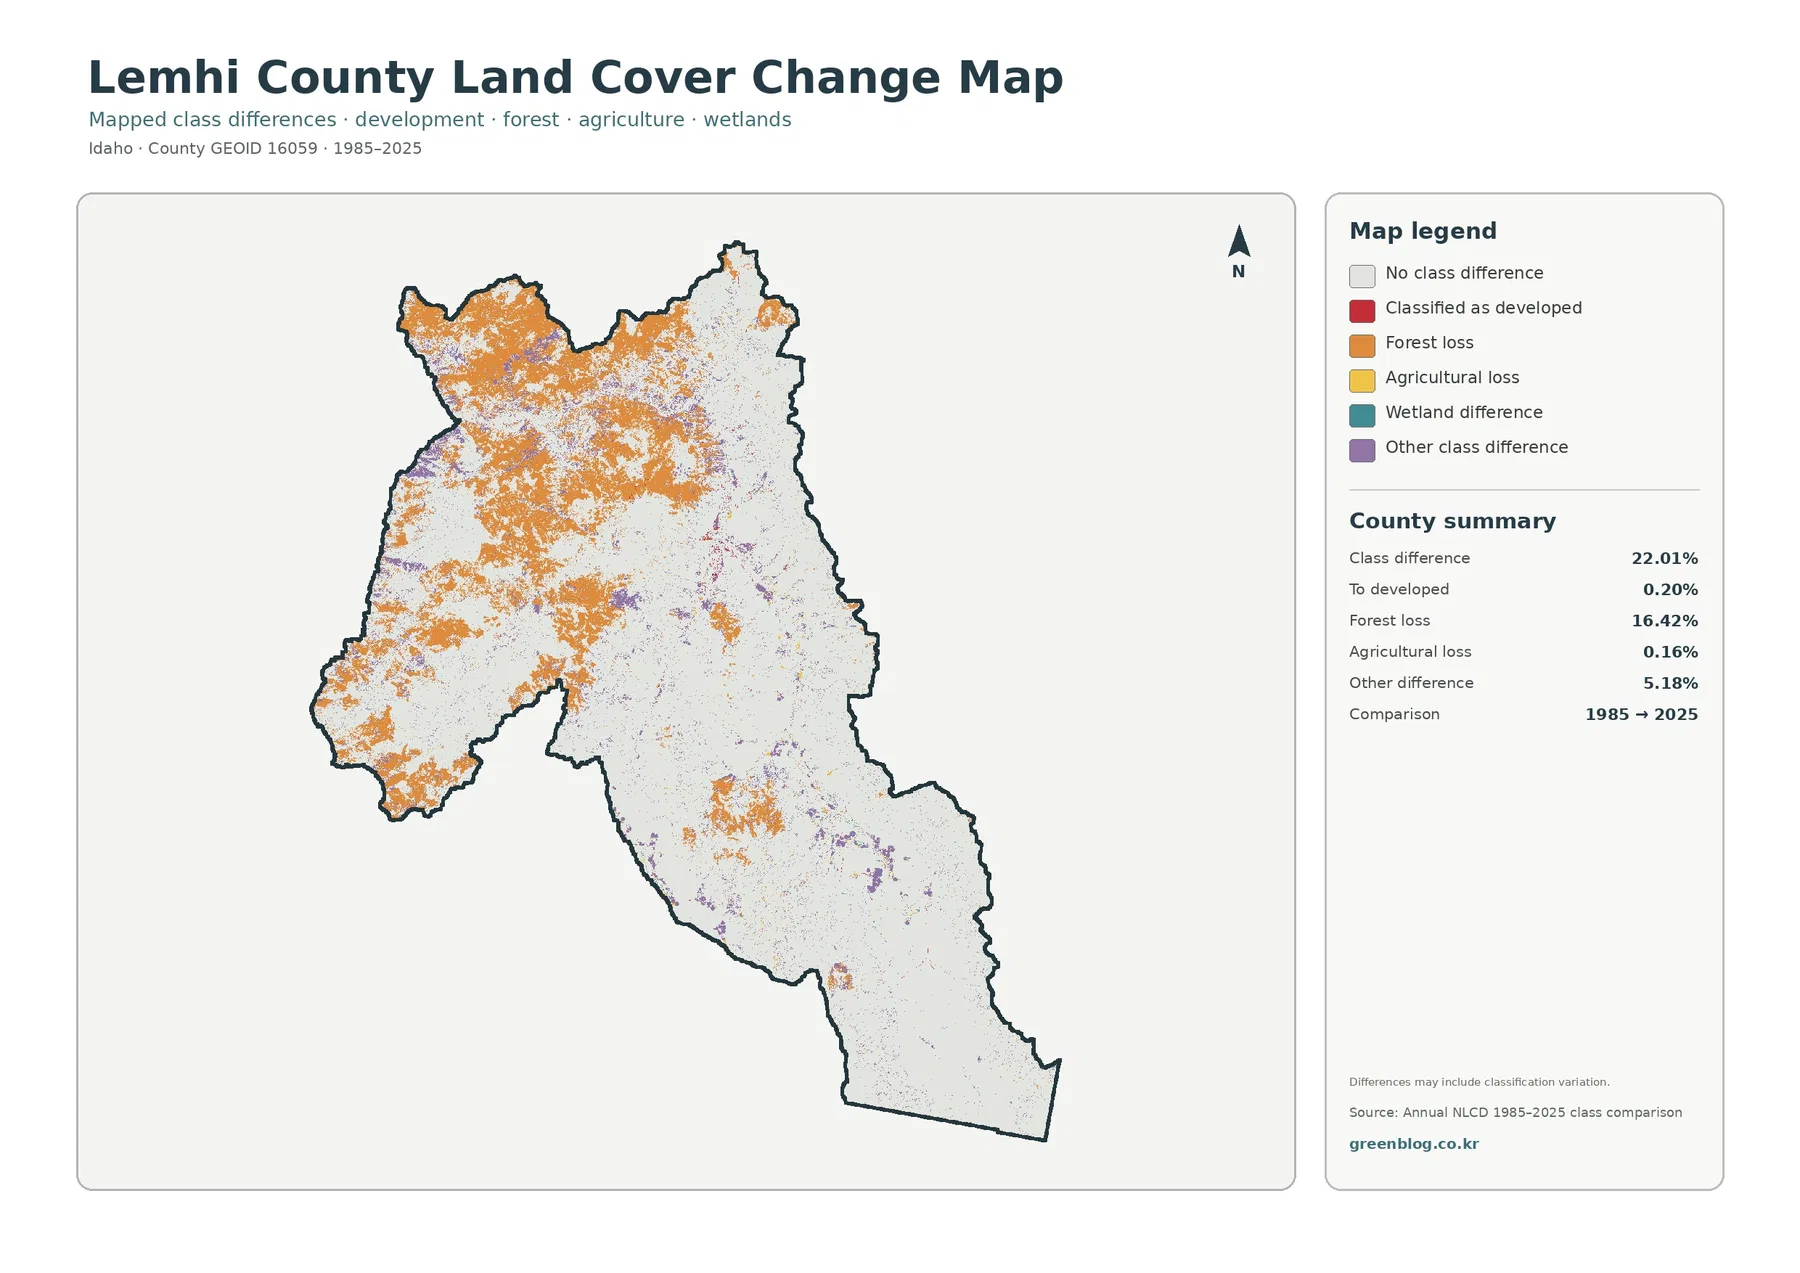
The change product marks cells whose mapped class differs between 1985 and 2025. Lemhi County has 22.01% total class difference in the supplied summary. The largest named component is forest loss at 16.42%, followed by other class differences at 5.18%. Change to developed accounts for 0.20%, and agricultural loss is 0.16%. These values describe the comparison layer; they are not the same as current land-cover percentages.
Orange forest-loss pixels are especially widespread across the northwestern and western portion of the county, with additional patches through central mountain areas. Some of these locations are still forested on the 2025 current-cover map. That is not contradictory. One layer asks what class is mapped now, while the other asks whether the two endpoint classifications match. A location can have a forest-related difference in the comparison and still contain forest in 2025.
The map itself warns that mapped differences may include classification variation. Mountain terrain, mixed pixels, changes in imagery, and the boundary between forest, shrub, and grass can all influence class assignments. The orange areas therefore should not automatically be labeled as wildfire, logging, permanent clearing, or any other single cause. Confirming what happened at a particular site requires the annual NLCD sequence, aerial photography, and land-management records.
Red change-to-developed marks are sparse and much more localized than the forest-related differences. Small purple other-difference patches are scattered in several parts of the county, while agricultural-loss marks are limited. That distribution reinforces a central point from the current maps: the county’s most extensive mapped dynamics occur in the forest/open-land landscape, not in a broad expanding urban field.
River and watershed context helps explain the long, narrow patterns
Lemhi County’s comprehensive plan identifies the Salmon River system, Lemhi River, Pahsimeroi River, Little Lost River, forests, range, soils, fisheries, and watersheds as major natural-resource elements. The maps on this page do not label every river, but that verified geographic context helps explain why several cover classes appear as long corridors instead of broad rectangles. The Lemhi River valley is the clearest example: agriculture, pasture/hay, settlement, and small wetland features follow a narrow open valley between much larger mountain landscapes.
The water and wetland shares are small, yet their locations can still matter for watershed or habitat study. A thin blue or teal corridor may represent only a small fraction of the county area while connecting larger upland systems. When reviewing such areas, the map is best used as a first screening layer. It can show where a wetland or water class was mapped, but it cannot establish legal wetland jurisdiction, streambank boundaries, floodplain status, or water rights.
Ownership and management are another separate issue. The county comprehensive plan notes the large role of government-managed lands in Lemhi County, but the land-cover colors here do not identify who owns or manages a cell. Forest may occur on federal, state, local, or private land, and the same is true for shrub or grass cover. Land-management questions therefore require agency ownership maps or county parcel records rather than an inference from vegetation color.
A useful reading order for the four maps
Start with the full 2025 land-cover map when the goal is to understand the county as a whole. It immediately establishes the dominance of shrubland and forest, the open grass component, and the narrow agricultural valley. After that overview, the forest-and-farmland version is useful for simplifying the comparison between wooded mountains, open shrub/grass country, and the agricultural corridor. This sequence keeps the small but locally important farm pattern from being lost in the full legend.
Use the impervious map only when the question shifts toward built surfaces. Its mostly pale appearance is informative: Lemhi County has very little hard surface compared with its total area, and the main concentration around Salmon stands out because the surrounding county is so lightly developed. The 1985–2025 map should come last, because it is easiest to interpret after the current cover is already familiar. A highlighted change cell is then read as a comparison result rather than mistaken for a current land-cover class.
For a classroom or presentation, placing the current cover and change maps side by side works well because they answer different questions. The forest-and-farmland map is better for an agriculture or vegetation discussion, while the impervious map is better for settlement and runoff context. In print, keep the legend, year, county outline, and summary panel intact. Cropping those elements can make the same color appear to carry the same meaning across maps even when each product uses a different legend.
What the 30-meter classification can and cannot tell you
Annual NLCD is a raster land-cover product derived largely from Landsat observations. At 30-meter spatial resolution, each cell represents an area on the ground and receives a mapped value. That scale is appropriate for countywide patterns, but it cannot reproduce every fence line, narrow stream, driveway, building, or field edge. A mixed cell containing several surface types still receives a generalized value, so local boundaries may look more blocky than they do in current aerial imagery.
Scale matters especially in Lemhi County because a narrow valley is surrounded by very large mountain areas. At a full-county view, the agricultural corridor can look like a thin line even though it is important to local communities, and small developed areas can look like points. Zooming in makes the pattern easier to see but does not create parcel-level accuracy. Surveying, zoning review, property purchase, road design, and site drainage work all require more detailed official records.
Time is another limitation. The current maps use the supplied 2025 classification, so construction, vegetation change, restoration, or land management after that observation period may not appear. The 1985–2025 difference map compares endpoint classifications and does not provide a continuous history of every intermediate event. A cell may change class more than once during the 40-year span. For current decisions, use the newest imagery and local or agency data alongside these maps.
Frequently Asked Questions
Why does agriculture look important in Lemhi County if it is only 2.56% of the 2025 total?
Agriculture is concentrated rather than widespread. The mapped cropland and pasture/hay form a narrow corridor through the Lemhi Valley near communities such as Salmon and Leadore, so the class is locally prominent even though most county land is shrubland, forest, or grassland.
What does the 0.20% mean impervious value tell me?
It is a countywide average of hard surfaces such as pavement and rooftops within the impervious dataset. The low value reflects the county’s large undeveloped area, while Salmon still appears as a clear local concentration of higher impervious cover.
Does the 16.42% forest-loss category prove that 16.42% of the county was permanently deforested?
No. It is a mapped class-difference category in the 1985–2025 comparison, and the product notes that classification variation may be included. Site-level causes or permanence need to be checked with annual layers, aerial imagery, and land-management records.
Map File Information
Download one ZIP containing all four original JPG maps prepared for Lemhi County, Idaho.
- Included Versions: land cover, forest and farmland, impervious/developed land, land-cover change
- File Type: ZIP containing 4 JPG files
- Intended Use: screen comparison, print reference, classroom and presentation use, county-scale environmental review
Related Maps
Sources and References
- MRLC – Annual NLCD Data (Annual NLCD data access and product context)
- U.S. Geological Survey – Annual NLCD Land Cover Classification (land-cover class definitions and interpretation)
- Lemhi County – Agriculture in Lemhi County (local ranching, hay production, and community context)
- Idaho Fish and Game – Lemhi River overview (official Lemhi River and agricultural-valley context)
- Lemhi County Comprehensive Plan (rivers, forests, range, watersheds, and natural-resource context)
Green Map creates custom-edited map images using open geographic data sources such as geoBoundaries, Natural Earth, OpenStreetMap, and government open data.
These maps are edited visual materials, not raw data files, and are provided for education, documents, presentations, and graphic reference.