Bonneville County stretches across two sharply different land-cover settings. The western side is a broad Snake River Plain landscape of agriculture and the Idaho Falls urban area, while the eastern half shifts into shrub-covered uplands, forested mountains, river valleys, and the large blue surface of Palisades Reservoir. In the supplied 2025 summary, shrubland leads at 40.39%, followed by forest at 28.57%, agriculture at 19.45%, developed land at 4.87%, and wetlands at 2.92%. This Bonneville County Idaho Land Cover Map is most useful when those east–west contrasts are read together rather than as a simple ranking.
The page contains four related views: current land cover, forest and farmland, impervious surface with developed land, and a 1985–2025 class-difference layer. The WebP images can be compared in the article, while the four original 2480 × 1754-pixel JPG maps are available together in one ZIP below. Moving between the layers makes the Idaho Falls farm grid, eastern forest, Palisades water, and long-term classification differences much easier to separate.
Table of Contents
The Snake River Plain and eastern mountains divide the county into very different cover zones
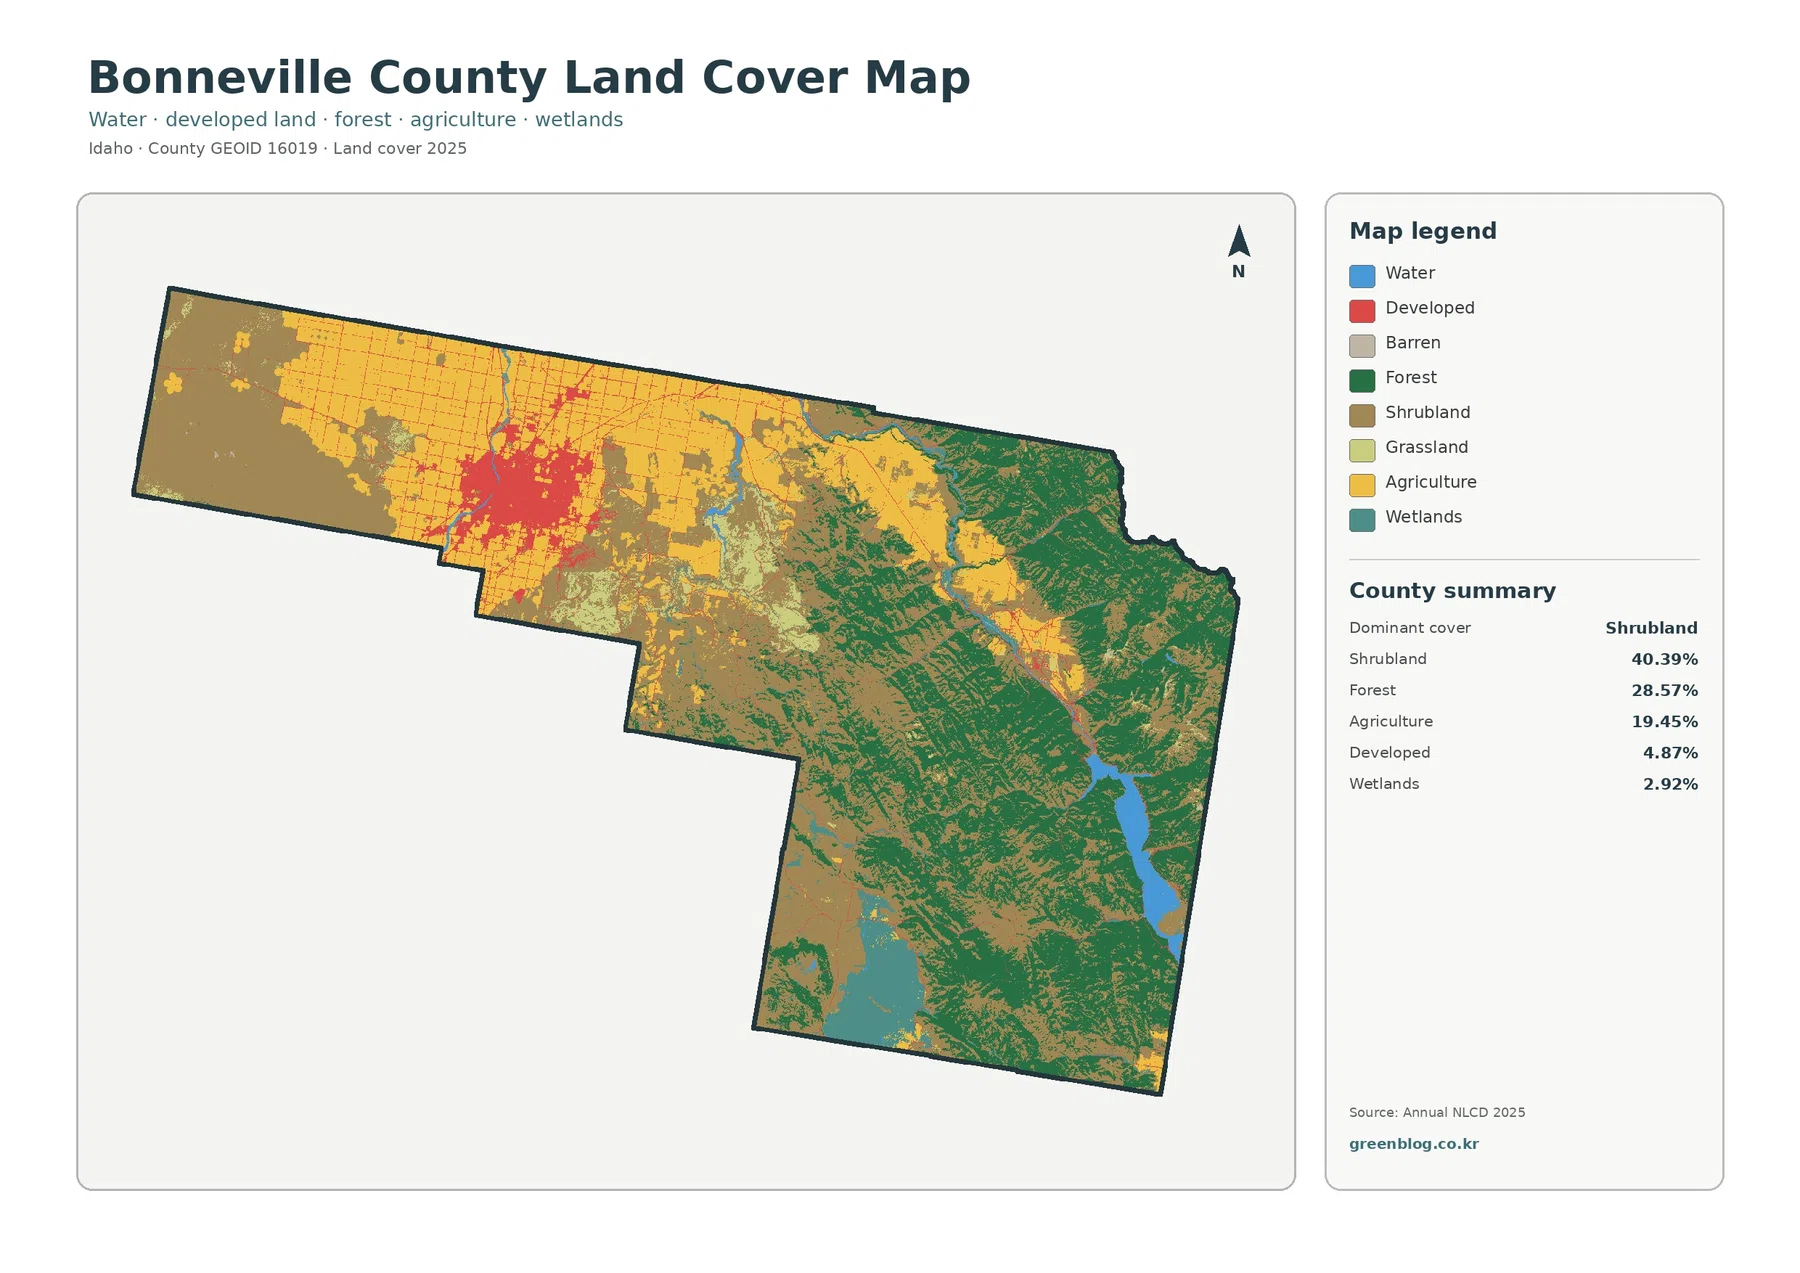
The western third of the county is visually dominated by yellow agricultural fields, tan shrubland, and a large red developed concentration around Idaho Falls. Straight field blocks and road-like traces make the plain look very different from the eastern half. Farther east, the yellow farm pattern thins, green forest expands across mountain slopes, and tan shrubland fills broad upland spaces between wooded ridges and river valleys.
Shrubland is the largest class at 40.39%, but it is not evenly distributed. It occupies extensive central and eastern open ground and also appears around the margins of the western farm belt. The large share reflects how much dry, open upland lies between the Snake River Plain and the forested ranges. Reading only the percentage would miss the fact that agriculture dominates some western views while forest dominates large parts of the east.
Forest covers 28.57% and creates the strongest green pattern in the eastern and southeastern sections. Green blocks follow higher terrain and become much more continuous near the county’s eastern side. A regional planning profile describes Bonneville County as extending from the Snake River Plain in the west to the Snake River and Caribou ranges near Wyoming, which matches the visible transition from fields to shrub uplands and forested mountain country.
Water is a small countywide share but a major visual landmark. A large blue reservoir occupies the southeast, while thinner blue features trace river corridors through the central and western parts of the map. The Bureau of Reclamation identifies Palisades Reservoir and Dam on the Snake River southeast of Idaho Falls. On the land-cover map, that reservoir provides an easy reference point for comparing the forested east with the farm-dominated plain farther west.
Agriculture forms a broad western grid around the Idaho Falls urban core
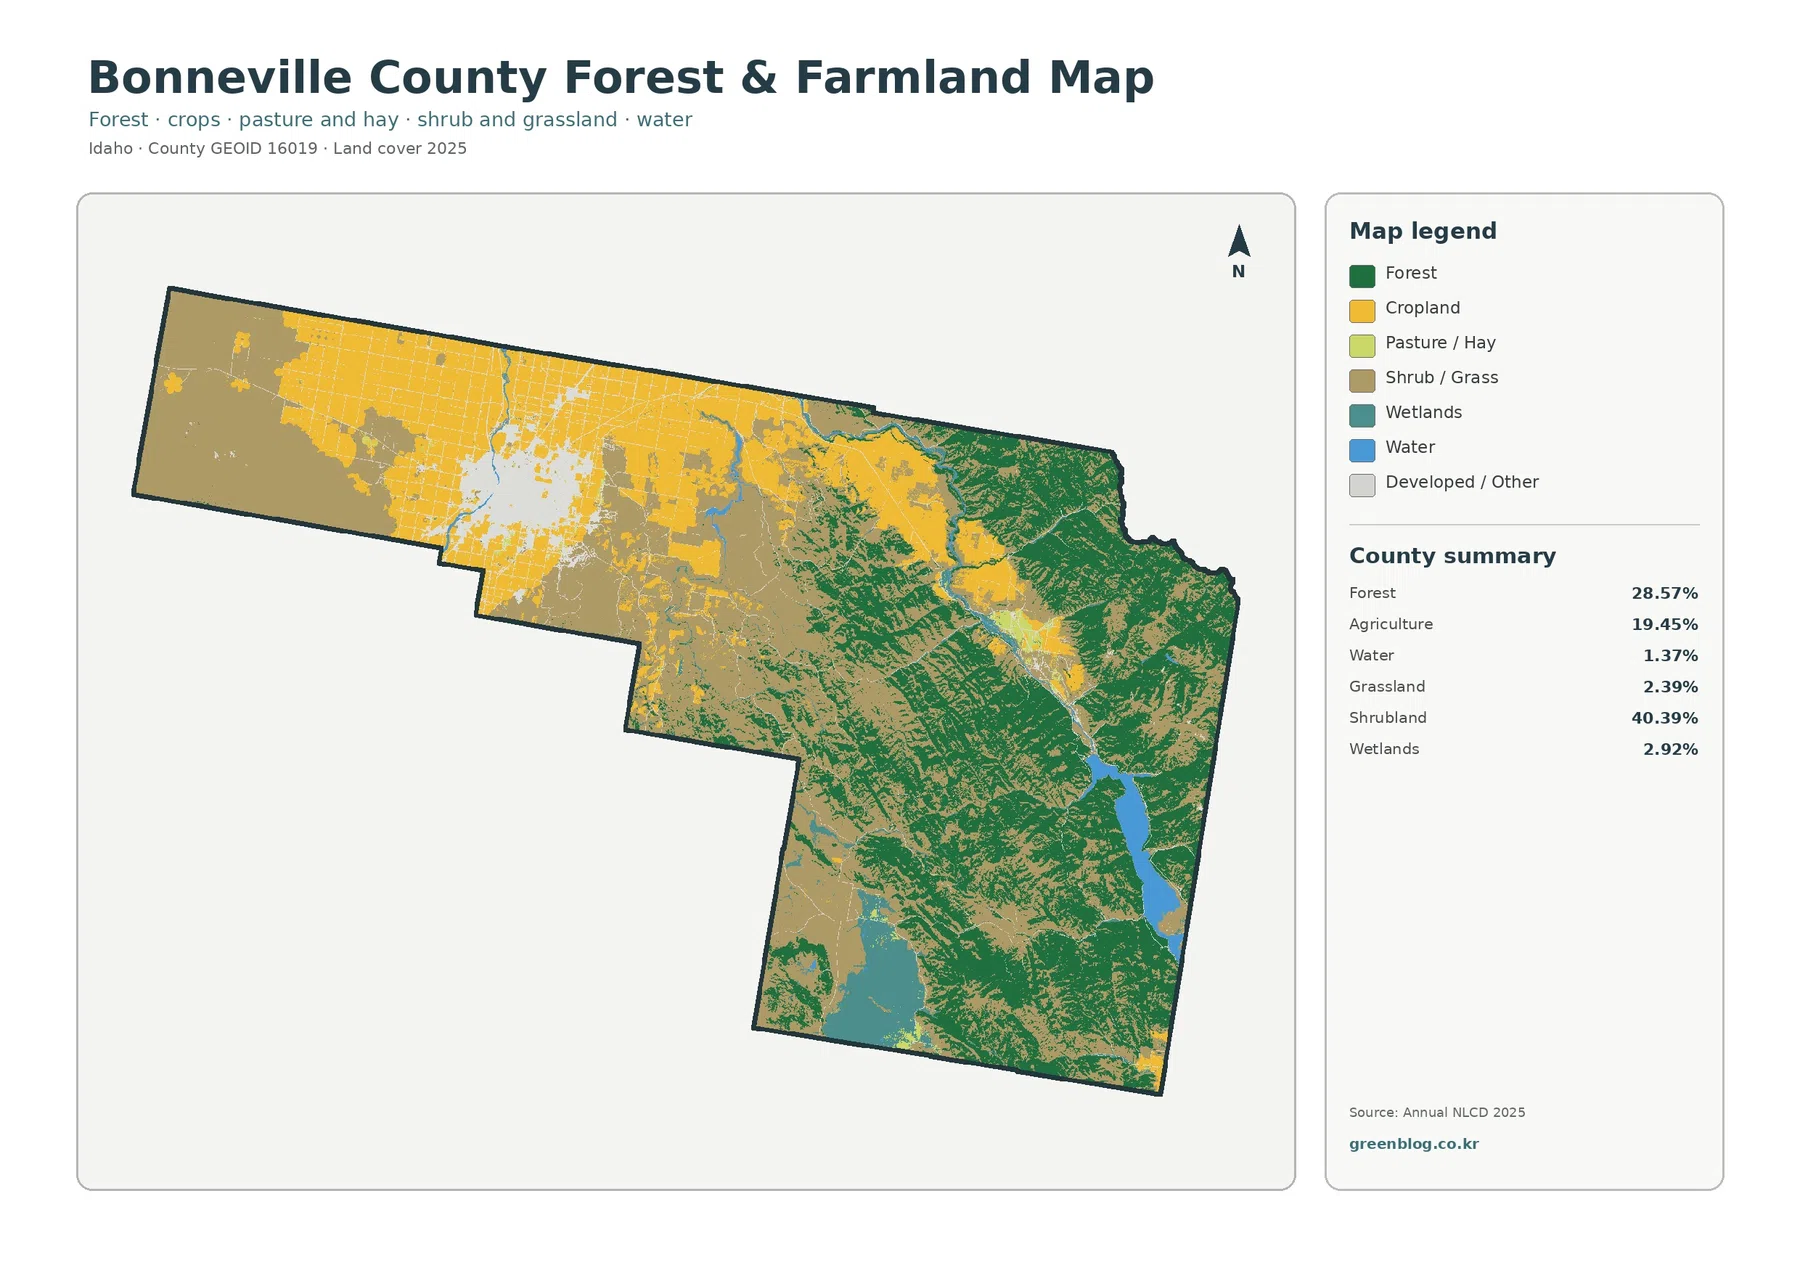
Agriculture accounts for 19.45% of the 2025 summary, and the simplified map shows how strongly that land is concentrated in the west. Yellow fields extend from the county’s western boundary toward Idaho Falls and continue north and east of the urban area in a regular grid. The central built area interrupts the farm pattern, but large blocks of agricultural cover resume quickly outside the developed core.
The farm belt becomes less continuous toward the middle of the county. Agricultural blocks narrow into selected valley bottoms and flatter areas while shrubland and forest become more common. By the eastern mountain section, agriculture is limited to a few corridors and pockets. This shift is important because the countywide 19.45% value is largely created by the western plain rather than by a uniform agricultural presence across Bonneville County.
Forest and agriculture occupy almost opposite ends of the county’s terrain. Forest is concentrated on higher and more rugged ground, while the largest cultivated areas sit on the flatter western plain and selected river valleys. In the southeast, forest reaches close to Palisades Reservoir. In the west, agricultural cover lies close to the Snake River and the Idaho Falls metropolitan area. The two classes therefore reflect different landscape settings even though both are major parts of the county.
Wetlands cover 2.92%, grassland 2.39%, and open water 1.37%. These smaller classes appear as narrow strips and patches rather than countywide blocks. Wetlands are especially useful for tracing low-lying areas near water, but the land-cover class is not a legal wetland-jurisdiction boundary. Ownership, water rights, drainage regulation, or permit status require separate official records.
Impervious surface concentrates around Idaho Falls and fades quickly toward the mountains
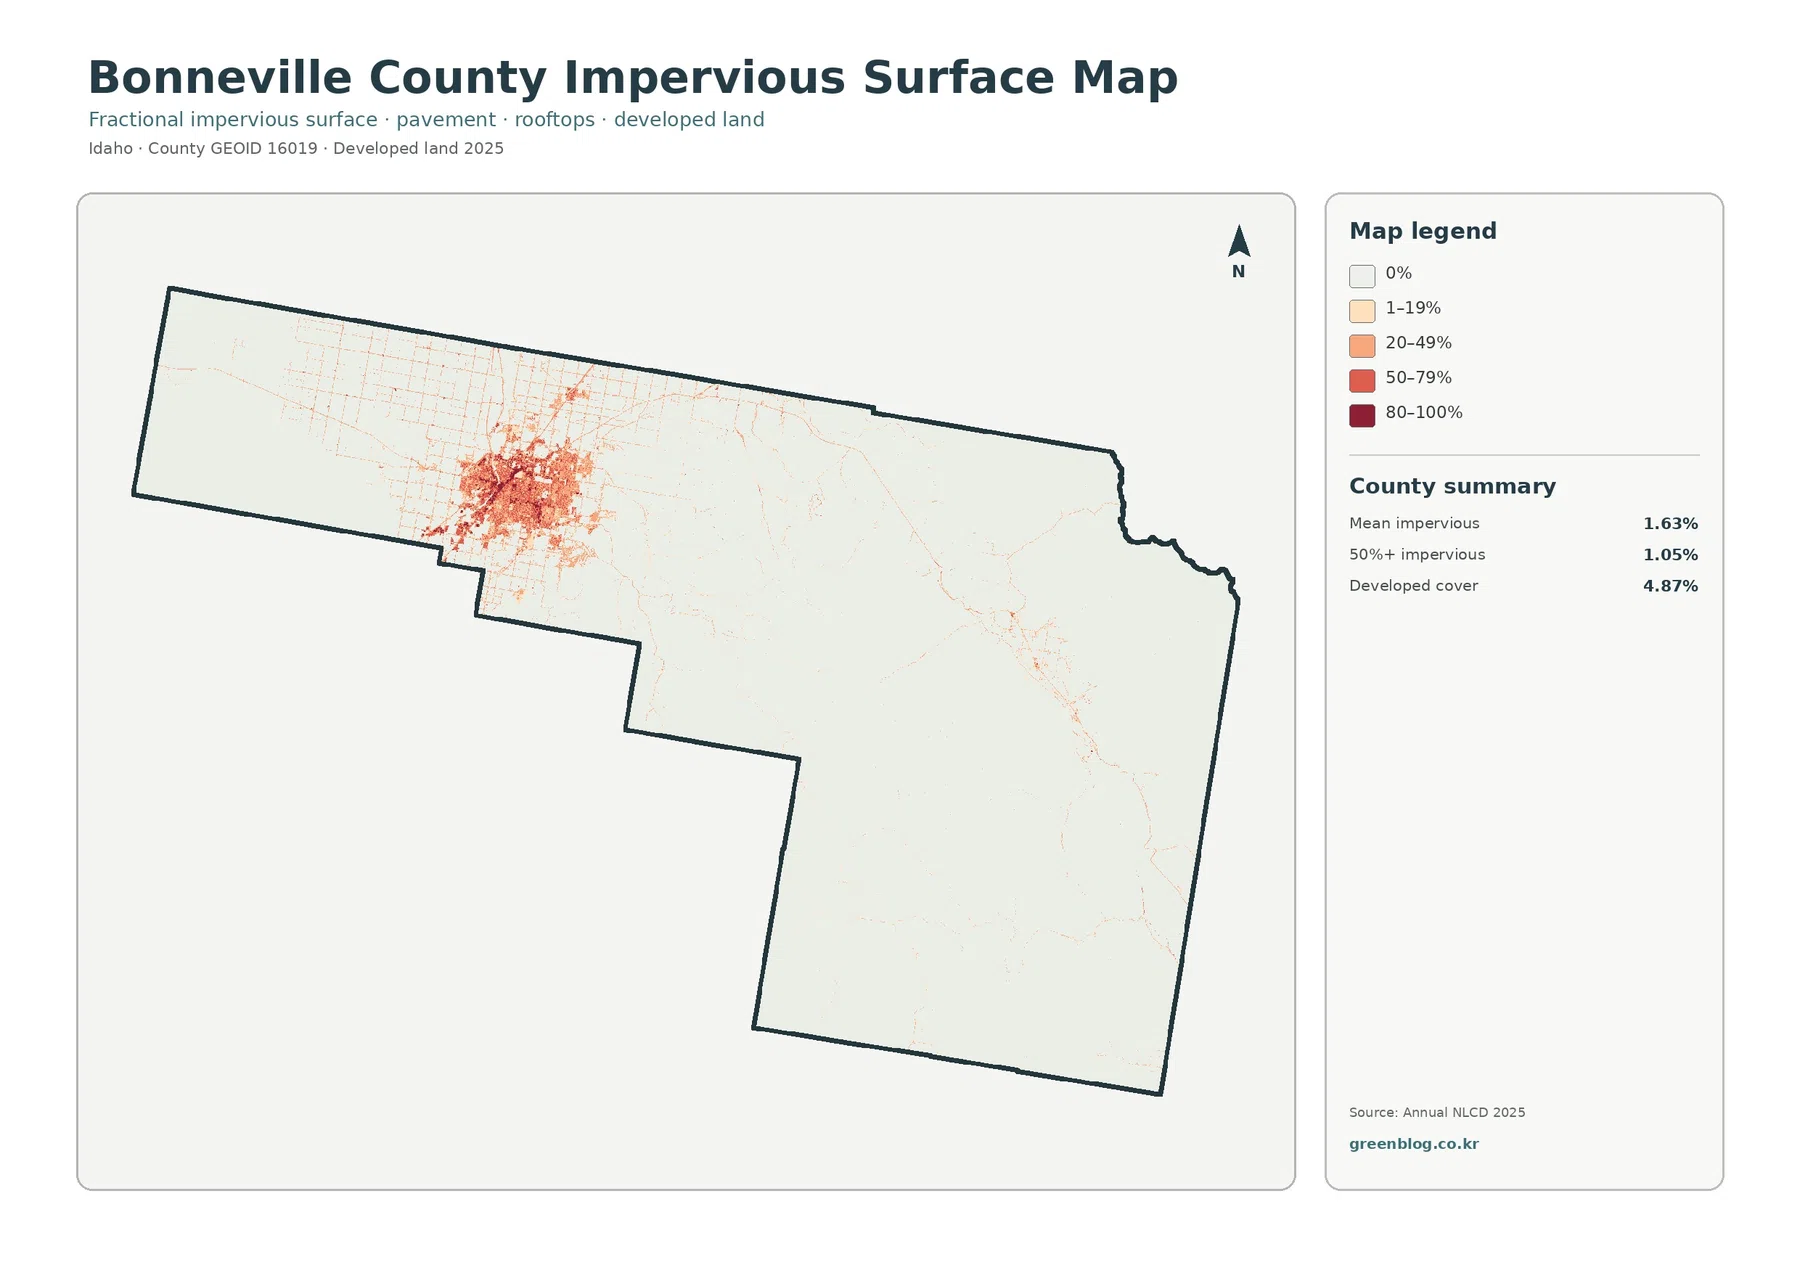
Impervious surface means hard cover such as rooftops, pavement, and parking areas where water does not readily soak into the ground. Bonneville County’s mean impervious value is 1.63%, and 1.05% of the county falls in cells with at least 50% impervious cover. Those countywide numbers are modest, but the west-central urban concentration is unmistakable.
The darkest colors form a compact cluster around Idaho Falls and nearby Ammon, then thin into road-like lines and smaller developed patches across the surrounding plain. Outside the urban core, the field grid remains visible but most agricultural land is nearly white on the impervious layer. Farther east, hard-surface traces become sparse and isolated as shrubland, forest, and mountain valleys replace the western farm-and-city pattern.
Developed land is 4.87%, noticeably higher than the 1.63% mean impervious value. These measures describe different things. A developed land-cover class can include lawns, trees, soil, and other permeable surfaces around buildings and roads, while the impervious product measures the hard fraction. The difference is especially clear at the edges of Idaho Falls, where developed cover extends beyond the darkest pavement and rooftop cells.
Thin colored lines should not be treated as an official road map. This image does not name highways, distinguish public and private access, or show current construction. Its purpose is to show where hard surfaces are concentrated relative to farms, shrubland, forest, and water. Transportation or parcel access questions need current county GIS and road information.
The 1985–2025 endpoint layer shows agricultural loss more widely than forest loss
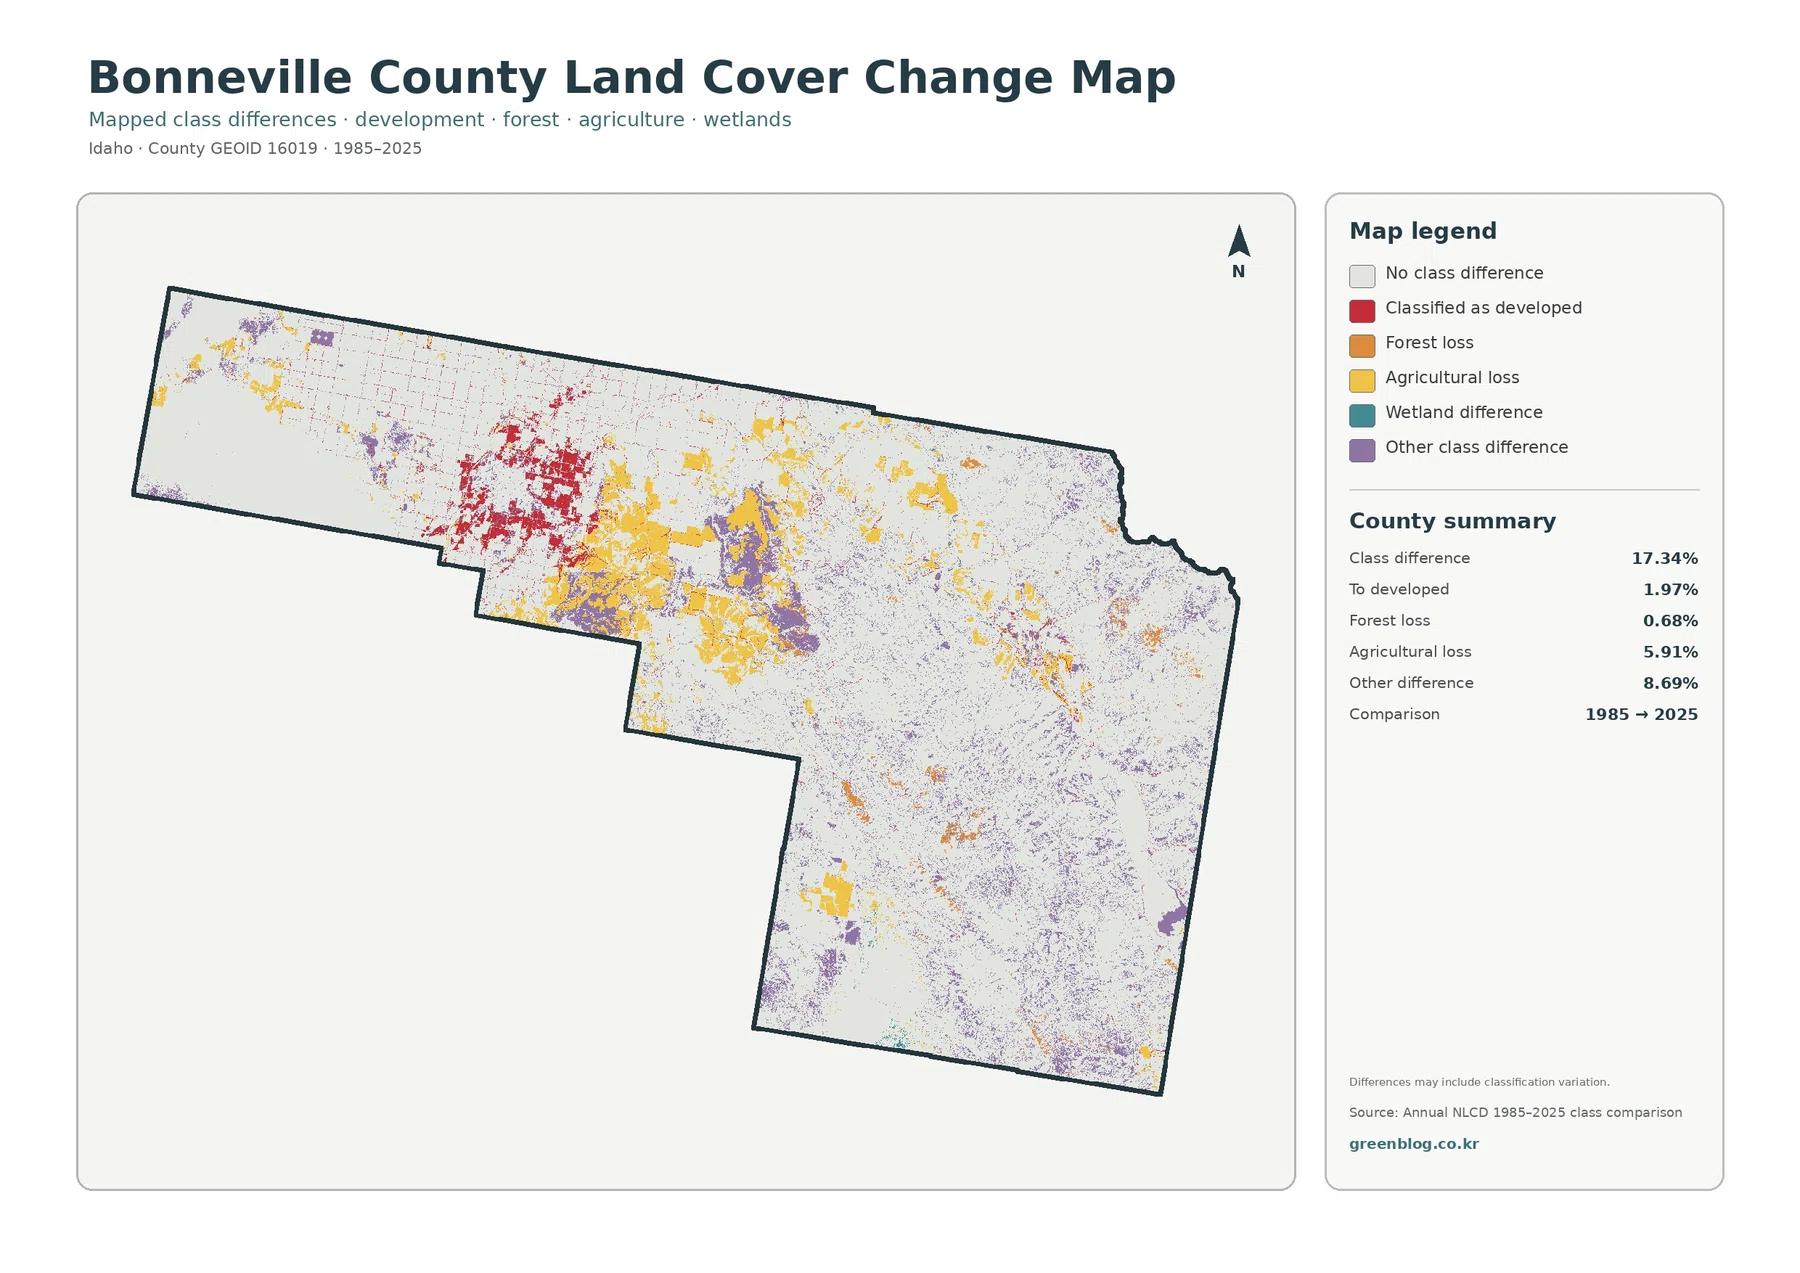
The supplied comparison marks 17.34% of Bonneville County as having a different class in 1985 and 2025. The listed categories are 1.97% classified to developed, 0.68% forest loss, 5.91% agricultural loss, and 8.69% other class difference. Those figures make it clear that the total should not be described as a 17.34% urban-development increase.
Red developed-difference cells are concentrated around the Idaho Falls urban area and along smaller traces that extend outward from it. That broad location is similar to the current impervious pattern, but the endpoint map cannot identify the date or cause of a specific development. Housing construction, road work, commercial growth, or classification adjustments require intermediate imagery and local records to distinguish.
Yellow agricultural-loss areas spread more widely across the western and central portions of the county. The 5.91% value means cells classified as agriculture at the earlier endpoint were classified differently at the later endpoint. It does not mean all of that area became developed. Some cells may have moved into shrub, grass, developed, or other classes, so agricultural loss and developed gain should not be treated as matching acreage.
Purple other-difference areas are common through central and eastern terrain where shrubland, grassland, forest, barren ground, and wetlands meet. The map itself notes that classification variation may be included. A purple patch therefore identifies a place where the two endpoint labels differ; it does not by itself prove physical damage, land-use conversion, or a specific management action.
Palisades Reservoir and the South Fork help organize the eastern half of the county
Palisades Reservoir is the easiest eastern landmark on the set because its large blue surface stands apart from surrounding forest and shrubland. Bureau of Reclamation data places Palisades Dam on the Snake River southeast of Idaho Falls. The reservoir sits within a mountain setting where green forest is much more continuous than on the western plain.
The South Fork of the Snake River also provides context for the mixed cover visible farther northwest. Narrow blue water, wetland patches, agriculture, and forest appear along selected valley sections. Higher ground away from the river shifts toward forest or shrubland. Reading the river corridor and uplands together gives a more accurate picture of eastern Bonneville County than describing the entire eastern half as one continuous forest.
Bonneville County is currently preparing a new comprehensive plan that addresses agriculture, natural resources, housing, population, and other growth issues. The land-cover maps cannot answer zoning or policy questions, but they provide a current surface-cover picture that can be compared with those planning topics. Legal land use, ownership, permit status, and future growth areas must still be checked in the county’s official planning and zoning materials.
Frequently Asked Questions
What is the largest land-cover class in Bonneville County?
Shrubland is the largest 2025 class at 40.39%, followed by forest at 28.57% and agriculture at 19.45%. The classes are strongly regional: agriculture dominates much of the west, while forest is concentrated in the eastern mountains.
Why does Idaho Falls stand out when developed cover is only 4.87%?
Development is concentrated rather than evenly distributed. The impervious layer shows the strongest rooftops and pavement around the Idaho Falls–Ammon urban area, while most of the county is agricultural, shrub-covered, forested, or mountainous.
Does 17.34% class difference mean that much of the county became urban?
No. Only 1.97% is listed as classified to developed. The total also includes 5.91% agricultural loss, 0.68% forest loss, and 8.69% other class difference, so several kinds of endpoint classification change are combined.
Thirty-meter cells set a county-scale, not parcel-scale, level of detail
Annual NLCD is a raster product, meaning the landscape is divided into square cells. At the commonly used 30-meter cell size, one cell receives a predominant class even when a field edge, road, trees, lawn, and building all share the same area. This generalization matters around Idaho Falls, narrow Snake River channels, and small eastern valley settlements where individual features can be much smaller than the map cell.
Enlarging the JPG makes the map easier to read but cannot recover parcel detail absent from the source. A field boundary may look blocky, a narrow stream may be simplified, and a small developed feature may merge with neighboring surfaces. Property boundaries, zoning, wetland jurisdiction, flood regulation, access, and building decisions require current official records.
The current maps use the supplied 2025 observation year. Later construction, agricultural change, wildfire, vegetation recovery, flooding, or reservoir conditions may not appear. The change layer compares the 1985 and 2025 endpoints rather than every year in between. A location can change more than once between those dates and still finish in a class similar to its starting point.
Each downloadable JPG measures 2480 × 1754 pixels. The files work for screens, reports, classroom materials, and many presentation layouts, but the supplied asset manifest does not identify them as meeting an A3 high-resolution reference. A proof print should be checked before making a large poster, and the original proportions should be preserved so the long county outline and narrow river features are not distorted.
What is included in the four-file package
The ZIP contains one original JPG for the 2025 land-cover overview, one for forest and farmland, one for impervious surface and developed land, and one for the 1985–2025 class comparison. The set makes it possible to revisit the same Idaho Falls location, western farm block, South Fork valley, or Palisades-area forest in several layers without relying on a small composite image.
Map File Information
The ZIP contains four original JPG maps for comparing Bonneville County's western agriculture, Idaho Falls hard surfaces, central shrubland, eastern forest, Palisades water, and 1985–2025 endpoint differences.
- Included Files: Use only the versions confirmed in the article and supplied images
- File Type: Use the confirmed download contents
- Intended Use: Printing, education, presentations, and map-based projects
Related Maps
Sources and Reference Data
- MRLC Annual NLCD Data – official access point for Annual NLCD land-cover and comparison products
- USGS Annual NLCD Land Cover Classification – definitions for shrubland, forest, agriculture, developed land, wetlands, and other classes
- Bonneville County Comprehensive Plan Update – official county information on the ongoing comprehensive-plan update covering agriculture, natural resources, housing, and growth
- Bureau of Reclamation Palisades Reservoir Data – official location and water-operations information for Palisades Reservoir and Dam
Green Map creates custom-edited map images using open geographic data sources such as geoBoundaries, Natural Earth, OpenStreetMap, and government open data.
These maps are edited visual materials, not raw data files, and are provided for education, documents, presentations, and graphic reference.