Towns County is overwhelmingly forested in the 2025 land-cover summary. Forest accounts for 80.55% of the county, while developed land is 8.30%, agriculture is 7.84%, and water is 2.71%. The four maps on this page separate that broad mountain-forest pattern into current land cover, forest and farmland, impervious surface, and 1985-2025 class differences, making it easier to see where the smaller built and open areas sit within a largely wooded county.
The page uses WebP previews for quick viewing, and the four original JPG maps are available together in one ZIP download. They are useful when you need to compare the Lake Chatuge area with the more heavily forested southern and eastern parts of the county, or when you want a map for a document, lesson, presentation, or county-level reference. Reading the maps in sequence also helps keep current development, hard surface, and long-term change from being confused with one another.
Table of Contents
A mountain county where forest covers four-fifths of the map
The general land-cover map is dominated by dark green from the southern part of the county across the east and much of the interior. That visual impression matches the county summary: forest covers 80.55%. Developed land at 8.30% and agriculture at 7.84% occupy much smaller shares, and water contributes 2.71%. Grassland is only 0.35%. These proportions make Towns County very different from a Georgia county where cropland or wetlands divide most of the landscape.
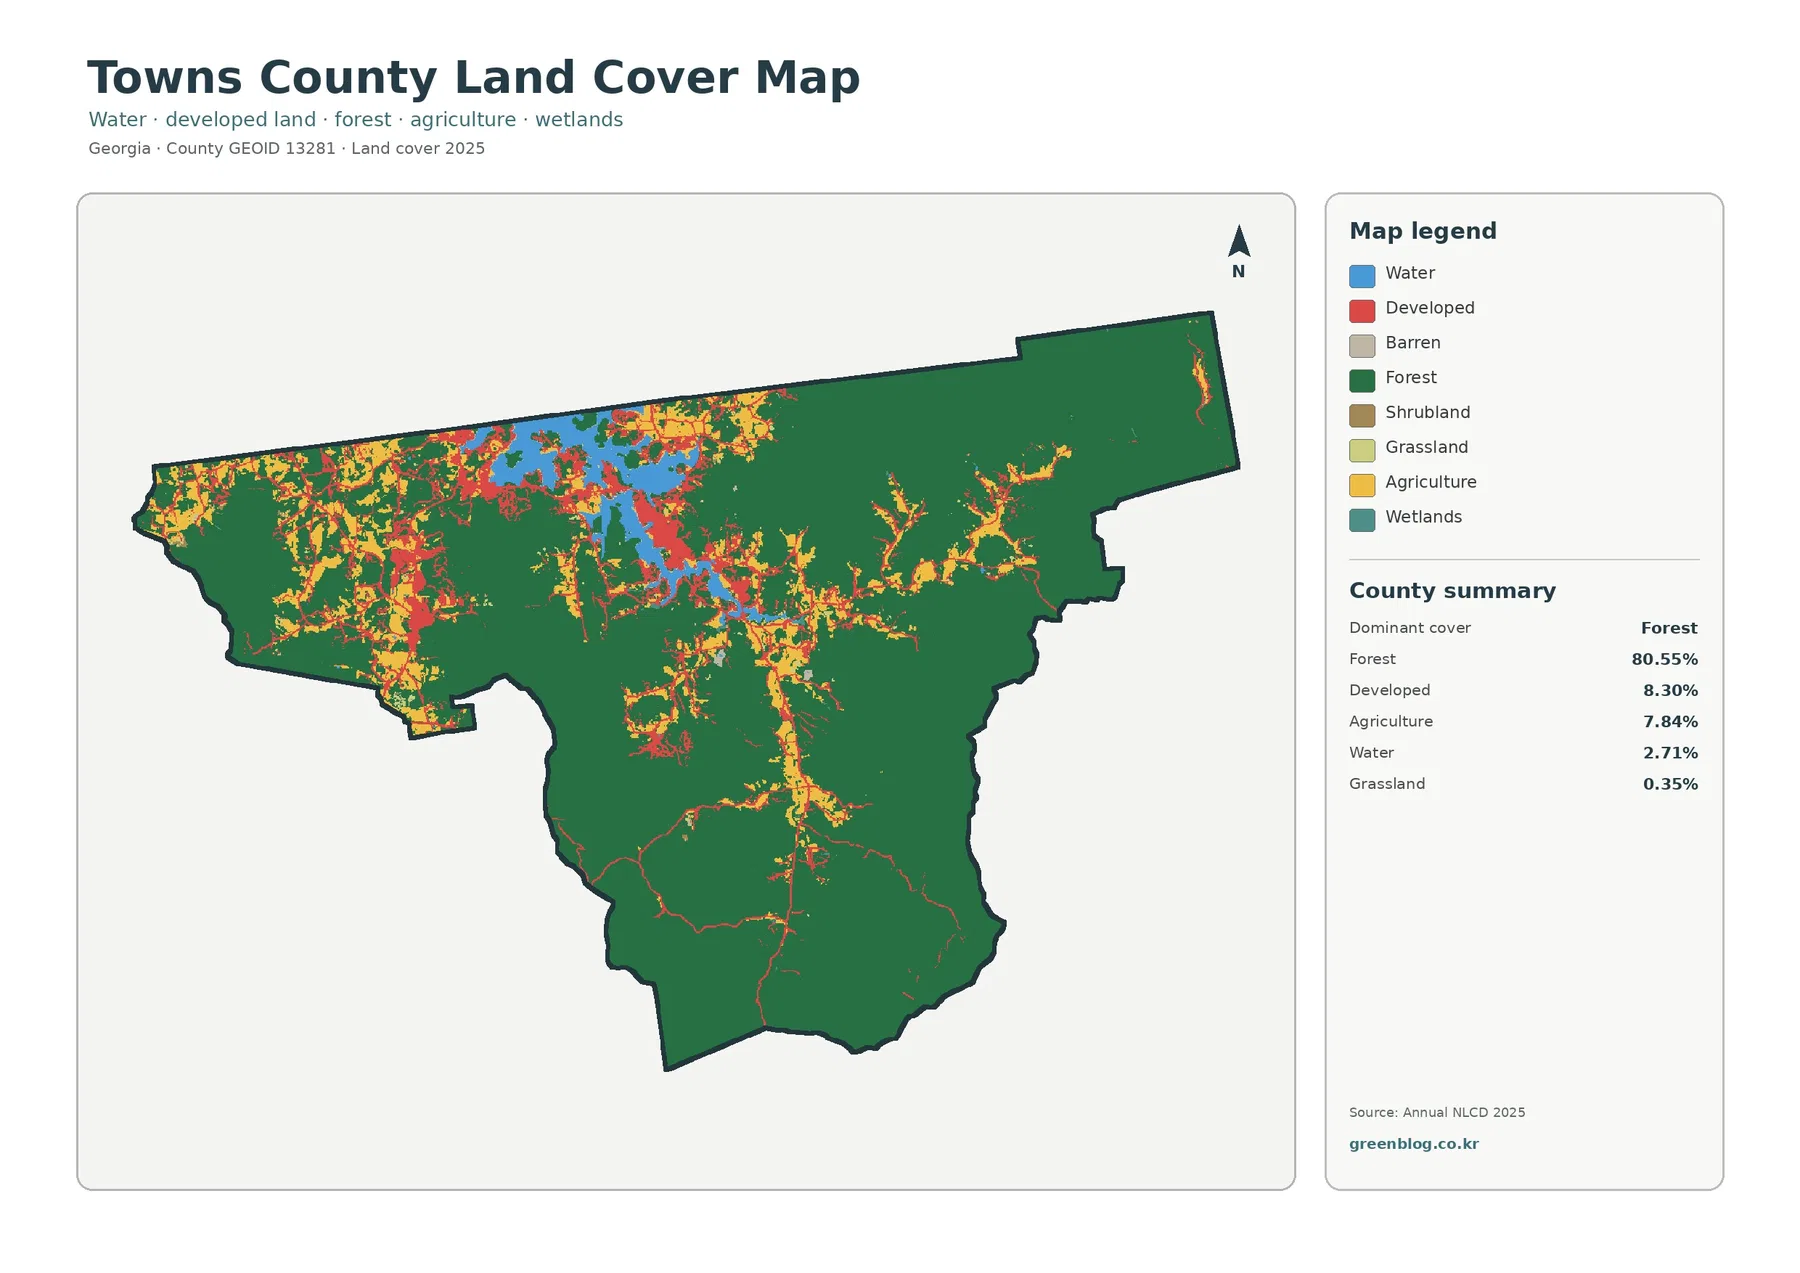
The forest is not uniformly uninterrupted, however. Yellow agricultural patches and red developed areas become much more common in the western portion of the county and around the large water body in the north-central area. A narrow north-south pattern of developed and open land also extends south from that area, while the eastern arm of the county stays almost entirely green. The map therefore shows two scales at once: forest clearly dominates the county as a whole, but the places where people live and use open land have a much more mixed cover pattern.
Official Towns County information identifies Hiawassee, Young Harris, Lake Chatuge, and Brasstown Bald as major local places. The county site describes Lake Chatuge as a reservoir in the Blue Ridge Mountains and lists Brasstown Bald, at 4,784 feet, as Georgia’s highest mountain. Those facts are useful geographic context for a map that otherwise contains no town labels or elevation contours. They help explain why a forest-heavy county can still have a conspicuous water body and compact clusters of developed land, but they do not turn the green cells into public-land or national-forest boundaries.
Land cover should also be kept separate from legal land use. A forest cell means trees are the dominant surface in the classification, not that the parcel is protected, publicly owned, or unavailable for development. A developed cell does not show a zoning district or a building permit, and an agricultural cell cannot identify a particular crop or farm. The map is best used to describe the visible surface of the county at a broad scale before consulting parcel, zoning, or ownership records for site-specific questions.
| 2025 land-cover summary | Share |
|---|---|
| Forest | 80.55% |
| Developed | 8.30% |
| Agriculture | 7.84% |
| Water | 2.71% |
| Grassland | 0.35% |
Lake Chatuge and the western-north-central built clusters
The strongest concentration of developed and agricultural colors lies west of the county center and around the large lake in the north-central portion of the map. Red developed areas follow several compact clusters and narrow connecting lines, while yellow agricultural cover fills smaller open spaces between forested slopes. At a broad geographic level, this is the part of the county associated with Hiawassee, Young Harris, and Lake Chatuge. The raster does not draw municipal limits or road names, so individual red patches should not be assigned to a specific town or highway without a separate boundary layer.
Lake Chatuge has an outsized visual role compared with its percentage. Water is only 2.71% of the county summary, yet the lake forms a large, recognizable shape surrounded by some of the most mixed land cover in Towns County. Development and agriculture appear close to portions of the shoreline, with forest returning quickly outside the more open areas. That makes the general land-cover map particularly useful for illustrating the difference between a water-centered settlement area and the forested mountain landscape around it.
South and east of those clusters, the map becomes much simpler. Broad green areas contain few developed cells and only limited agricultural or grass cover. Towns County’s official tourism and government information emphasizes the Blue Ridge setting and mountain landmarks, which is consistent with this visual pattern, but the land-cover map itself does not measure slope. It is safer to say that forest is concentrated across the southern and eastern sections than to claim that a specific elevation or steepness directly caused the pattern.
Why the forest and farmland view matters more in Towns County
The forest-and-farmland map removes much of the visual competition from developed land and makes the contrast between wooded and open areas easier to read. Forest remains 80.55%, agriculture is 7.84%, and water is 2.71%. Grassland is 0.35%, while shrubland and wetlands are each listed at 0.07%. With those minor classes separated and developed or other cover shown in a pale tone, the small agricultural spaces stand out as narrow patches within a much larger forest matrix.
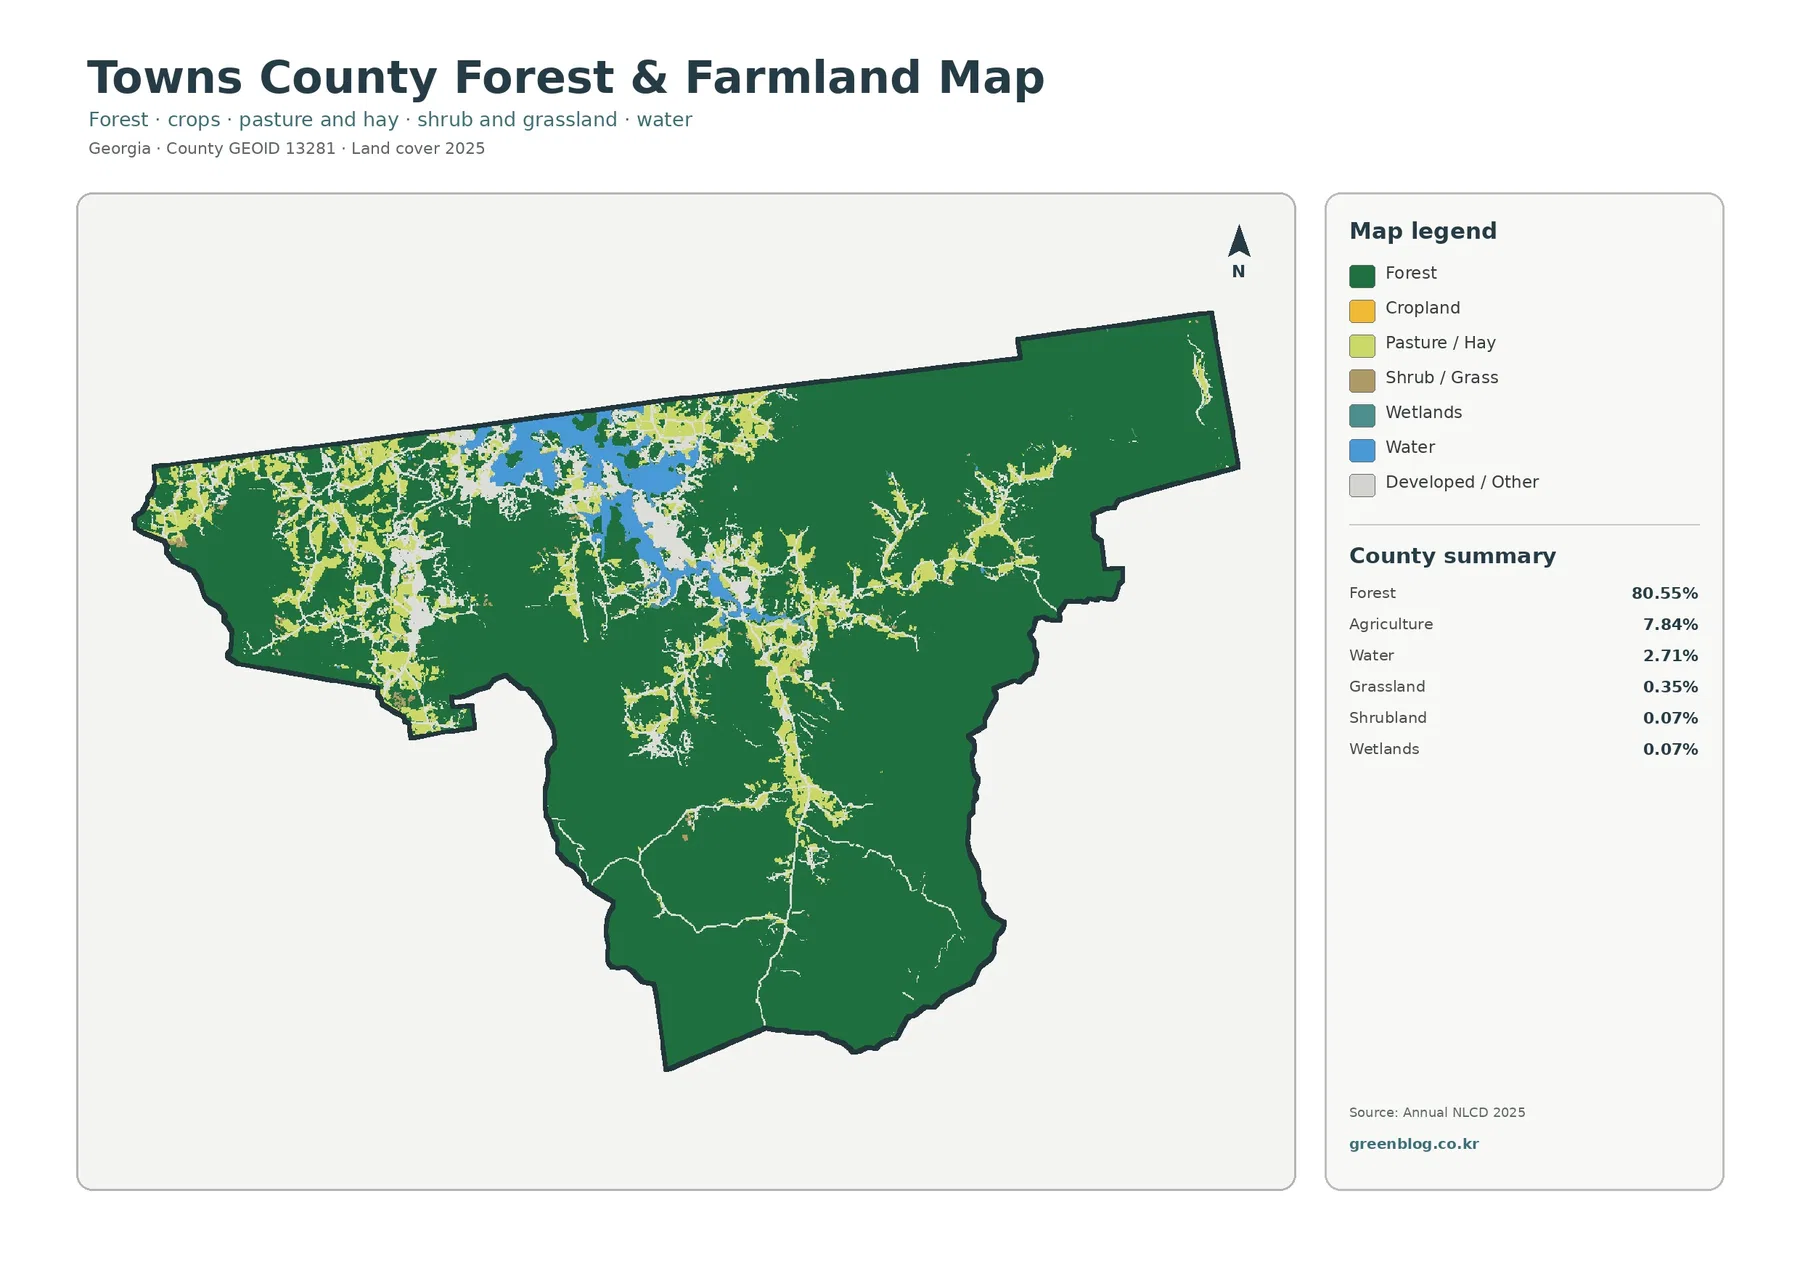
Agriculture here does not form the broad blocks seen in flatter farming counties. Instead, it appears in smaller pieces and narrow corridors near the western and north-central settled areas. The map cannot tell whether a yellow cell is row crop, orchard, pasture, or another agricultural use unless that distinction is included in the underlying class, and it cannot identify farm ownership. UGA Extension Towns County provides agriculture and natural-resource services, which confirms the local relevance of those topics, but the Extension page should not be used to assign a crop type to a specific NLCD cell.
Water also becomes easier to compare with forest in this simplified view. Lake Chatuge interrupts the otherwise continuous green pattern, while the smallest wetland class is barely visible at the county scale. A 0.07% wetland share does not mean wet environments are unimportant. UGA Extension’s local natural-resource programming includes watershed and mountain-bog topics, illustrating how small mapped classes can still matter environmentally. Area percentage and ecological significance answer different questions.
This map is useful when the purpose is to explain the county’s broad natural setting rather than its urban footprint. The general map is better for showing all cover types together, but the forest-and-farmland view makes the rarity of open agricultural land more obvious. It also helps readers avoid the impression that a county with several recognizable communities is broadly developed. Most of Towns County remains forested even when the settled western and lake-side areas are visually prominent.
Impervious surface stays low even where development is visible
Impervious surface means roofs, pavement, parking areas, and other hard surfaces that do not readily absorb water. Towns County has a mean impervious value of 1.33%, and only 0.52% of the county is mapped at 50% or greater imperviousness. Those figures are much lower than the 8.30% developed-cover share. The difference is expected because a developed land-cover cell may include lawns, trees, soil, and other permeable surfaces along with buildings and roads.
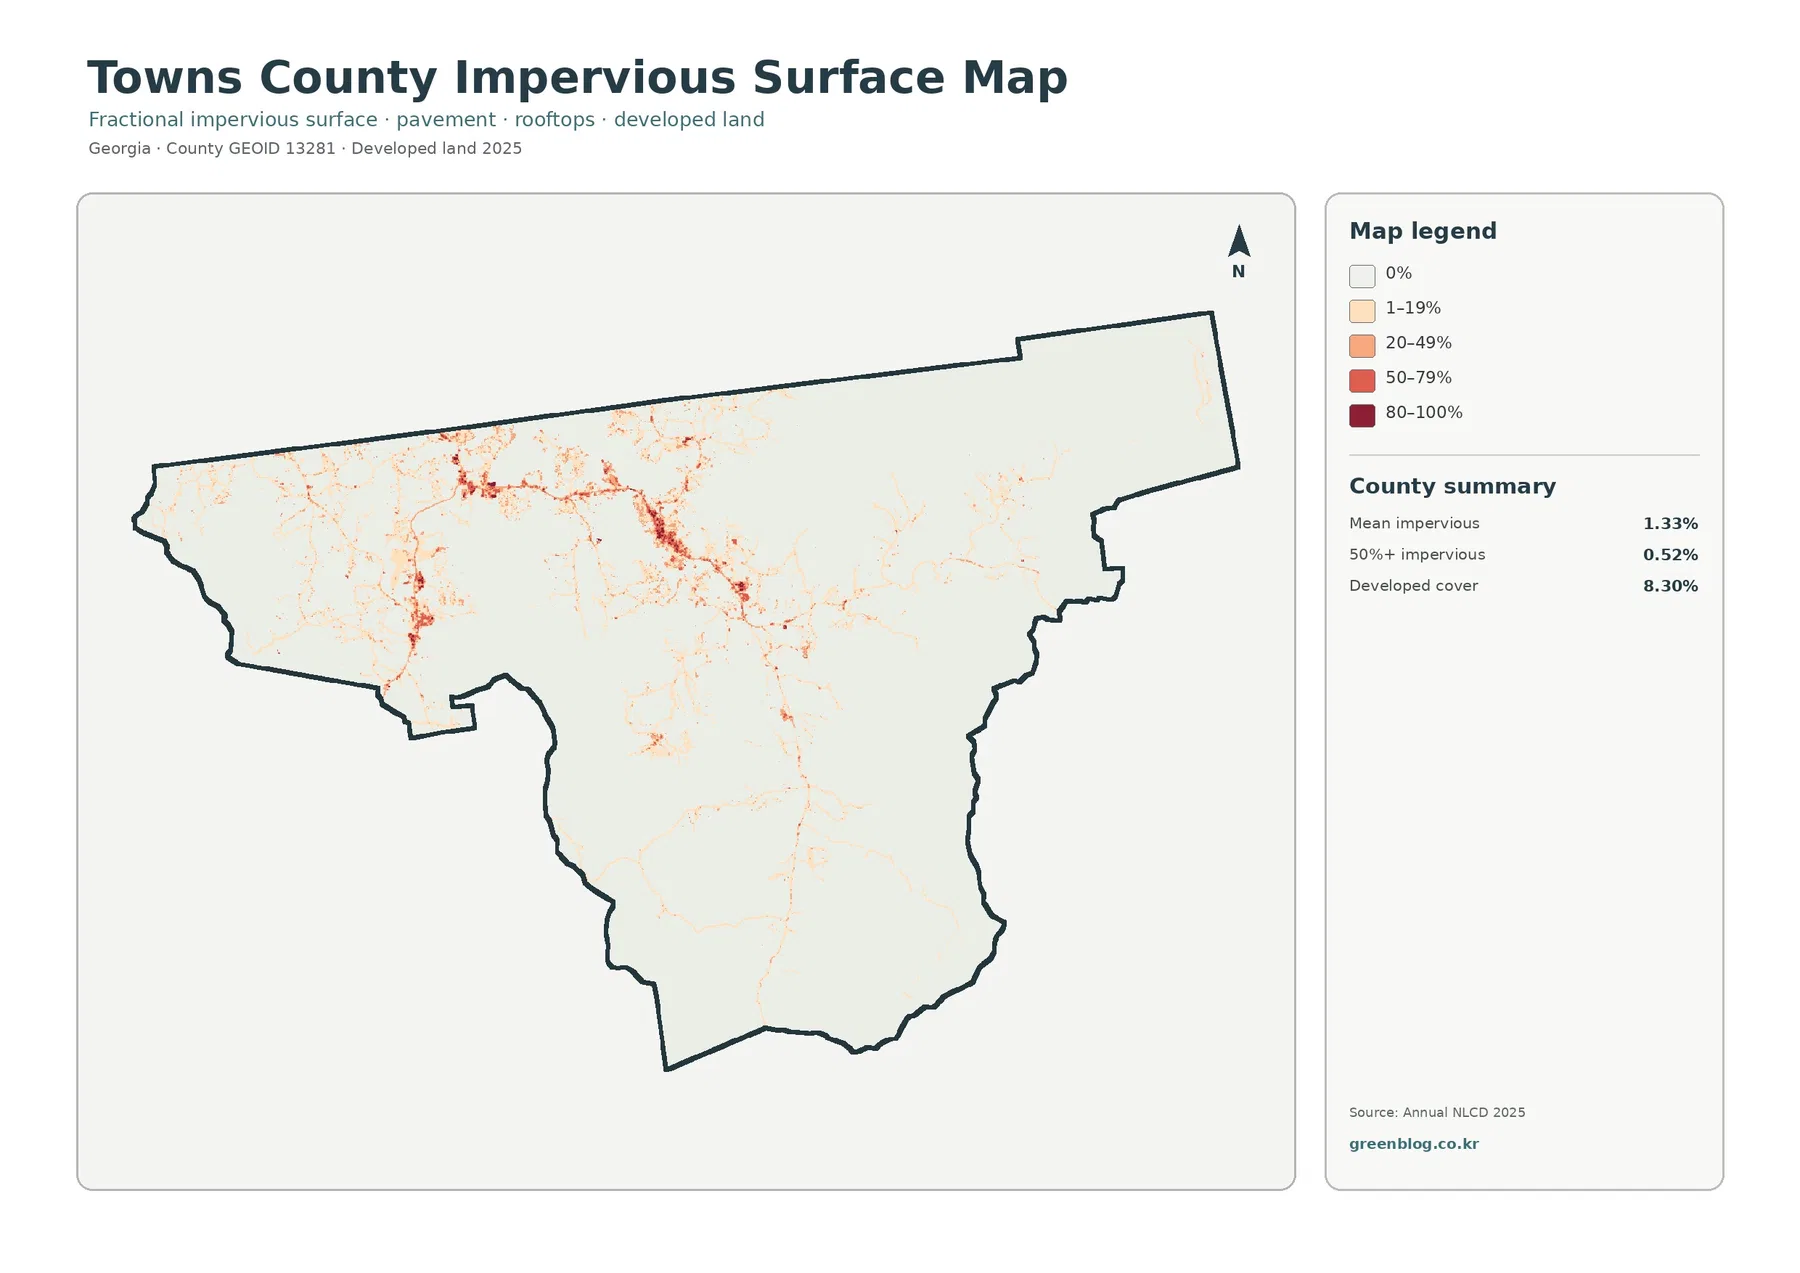
The darkest tones are concentrated in a few western clusters and around the lake-side developed area. Thin lines connect some of those clusters and extend toward the interior, but most of the southern and eastern county is nearly white. This pattern is more informative than the countywide mean by itself. A 1.33% average can sound uniformly low, yet the map shows that hard surface is highly concentrated where the local road and settlement network is denser.
The map should not be treated as a flood or drainage model. More pavement can affect how quickly rain runs off locally, but runoff also depends on rainfall, soil, slope, drainage infrastructure, vegetation, and the shape of valleys and streams. Those variables are especially important in a mountain county. The impervious map is appropriate for comparing relative hard-surface concentration, not for deciding whether a property will flood or whether a drainage design is adequate.
| Impervious/developed summary | Share |
|---|---|
| Mean impervious | 1.33% |
| 50%+ impervious | 0.52% |
| 2025 developed cover | 8.30% |
A relatively small 1985-2025 change footprint
The change map is unusually sparse compared with the strong colors on many county change maps. The total class difference between 1985 and 2025 is 8.33%. Within that total, 3.29% is classified as changed to developed, 1.45% as forest loss, 0.21% as agricultural loss, and 3.36% as other class difference. Wetland difference appears in the legend but is not given a separate percentage in the summary, so no residual value should be calculated and presented as a wetland-change rate.
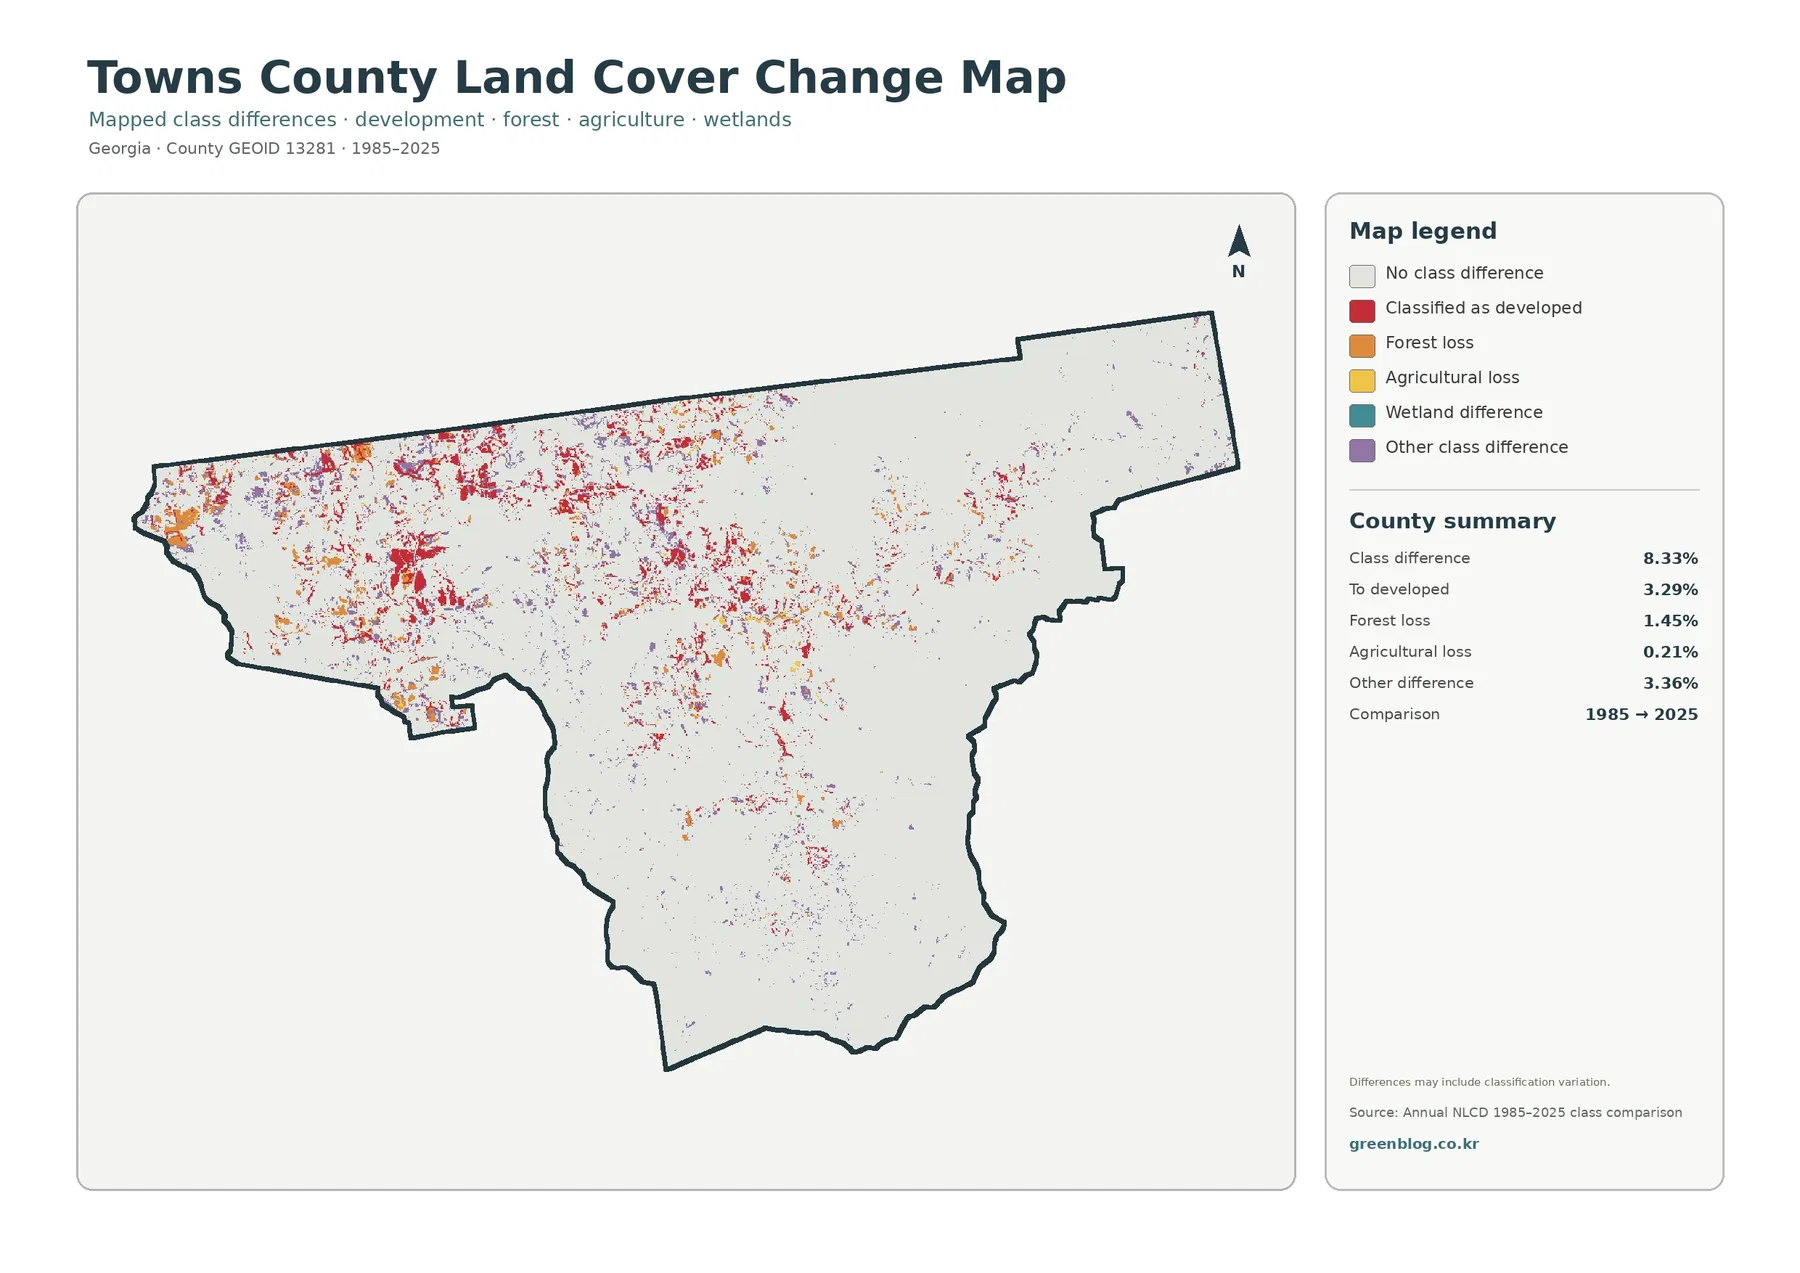
Change colors are most noticeable in the western and north-central parts of the county, broadly overlapping the areas where developed and agricultural cover are most visible today. Large southern and eastern forest blocks contain much more of the pale no-class-difference background. That does not prove every green area remained physically unchanged for four decades. The change product compares broad land-cover classes, so forest harvest and regrowth within the same general class may not appear as a lasting class change.
The 8.33% total is not an urbanization rate. It combines several categories of difference, while changed-to-developed cells are separately reported at 3.29%. The map also warns that differences may include classification variation. Mixed pixels, classification boundaries, and differences in observations between years can affect individual cells. For a specific site, the change map is best used to identify an area worth checking with historical aerial imagery or a more detailed time series rather than as proof of the exact cause of change.
| 1985-2025 class difference | Share |
|---|---|
| Total class difference | 8.33% |
| Changed to developed | 3.29% |
| Forest loss | 1.45% |
| Agricultural loss | 0.21% |
| Other difference | 3.36% |
Current cover and change answer different questions. The 8.30% developed share describes the 2025 surface, while the 3.29% changed-to-developed figure describes one category of difference between two years. Forest at 80.55% is a present-day share; forest loss at 1.45% is part of the two-date comparison. Keeping those roles separate is essential when the maps are used in a report or classroom, because the numbers can otherwise look as if they belong to one common percentage system.
Choosing the right Towns County map for a project
For a one-page overview, the general land-cover map is the strongest choice because it shows forest dominance, Lake Chatuge, developed clusters, agriculture, and water in the same frame. A lesson focused on mountain forest versus open land is clearer with the forest-and-farmland map. That version reduces the visual weight of developed land and makes the small agricultural areas easier to compare with the much larger forest coverage.
The impervious map is better when the question is where hard surface is concentrated. It makes the low 1.33% mean meaningful by showing that most of the county has little impervious cover while a few settlement areas contain much stronger values. The change map is appropriate for a historical comparison, but it should be paired with the current map so readers can see that present-day developed land and changed-to-developed cells are not the same measure.
Two maps are often easier to read than four small maps on one slide. The general map beside the forest-and-farmland map works well for a discussion of why Towns County is so heavily wooded. The general map beside the impervious map highlights the contrast between visible developed cover and actual hard-surface concentration. The general map beside the change map lets a reader compare today’s pattern with where classes differed between 1985 and 2025.
If you need municipal boundaries, road labels, or exact administrative lines, add a separate official layer such as Census TIGER/Line data. The supplied land-cover maps are designed around a county boundary and raster classes, not city limits. Hiawassee and Young Harris can be discussed as verified local context, but the map itself does not label their limits. Keeping those layers separate avoids turning a land-cover cell into an administrative claim it was never meant to make.
Download contents and practical image use
The body previews are 1800×1273 WebP images. The download ZIP contains four original JPG maps at 2480×1754 pixels each: general land cover, forest and farmland, impervious/developed land, and 1985-2025 land-cover change. All four use the same county outline, which makes side-by-side comparison straightforward. The asset manifest does not mark these JPGs as meeting an A3 high-resolution reference, so a test print is sensible before using them for a large poster.
Keep the title, year, and legend visible whenever possible. Red means developed land on the current land-cover map, but it means changed-to-developed cells on the change map. Darker tones on the impervious map represent a percentage of hard surface rather than a land-cover class. Removing the legend can turn the 8.30% developed share, 1.33% mean impervious value, and 3.29% changed-to-developed figure into numbers that look comparable even though they measure different things.
For a Lake Chatuge-centered explanation, the general map keeps water and the surrounding developed/open areas in the same view. For a forest-focused handout, the forest-and-farmland map is cleaner. A development presentation benefits from the impervious map, while a long-term comparison needs the change map and its caution about classification variation. Selecting the map that answers the question is usually more effective than treating all four as interchangeable illustrations.
Reading the 30 m classification without treating it as a parcel map
Annual NLCD uses raster cells of roughly 30 meters for land-cover classification. In a mountain county, one cell can include trees, a narrow road, a house, and an open slope, while cells along a lake edge can mix water and vegetation. The classification simplifies each cell into a category or percentage, so small roads, narrow streams, and property boundaries can be coarser than they appear on an aerial image. The maps are strong for county-scale pattern comparison but not for surveying a parcel.
The countywide impervious mean also needs scale awareness. An average of 1.33% does not describe the middle of Hiawassee, the edge of Young Harris, or a specific lake-side property. The map shows much stronger values in a few local clusters and almost none across broad forested sections. Whenever a county statistic is used, pairing it with the mapped distribution prevents a local concentration from being hidden by a low overall average.
The current land-cover product represents 2025, so development, forest harvest, regrowth, or agricultural changes after that observation year are not included. The change map compares 1985 with 2025 and does not show the year-by-year path between them. A changed cell cannot tell you by itself whether a forest loss was caused by logging, construction, storm damage, or another process. More detailed imagery and records are needed when the cause and timing matter.
Every percentage used in this article comes directly from the supplied maps. Values not listed on the maps, such as a separate wetland-change percentage or a derived barren-land share, have not been created from residual arithmetic. County and agency sources are used for geographic context such as Lake Chatuge, Brasstown Bald, Hiawassee, Young Harris, agriculture, and natural-resource programs. Keeping mapped statistics distinct from background information makes the interpretation easier to verify.
Frequently Asked Questions
What is the dominant 2025 land cover in Towns County?
Forest is dominant at 80.55%. Developed land is 8.30%, agriculture 7.84%, water 2.71%, and grassland 0.35%. The largest continuous forest areas appear across the southern and eastern parts of the county.
Does the developed color around Lake Chatuge show exact city limits?
No. The developed class represents land-cover classification, not municipal or parcel boundaries. The strongest developed clusters occur broadly around the western and north-central settlement area, but exact Hiawassee or Young Harris boundaries require a separate Census or county boundary layer.
Is the 8.33% 1985-2025 class difference the county’s urbanization rate?
No. Changed-to-developed cells are separately reported at 3.29%. The 8.33% total also includes 1.45% forest loss, 0.21% agricultural loss, 3.36% other difference, and additional mapped class differences, with possible classification variation noted on the map.
Map File Information
The ZIP contains four original JPG maps for Towns County: 2025 land cover, forest and farmland, impervious/developed land, and 1985-2025 land-cover change.
- Printable Size: 2480×1754 pixels each
- Intended Use: documents, lessons, screen comparison, presentations, and county-level reference
Related Maps
- Appling County Georgia Land Cover Map
- Atkinson County Georgia Land Cover Map
- Bacon County Georgia Land Cover Map
Sources and references
- MRLC Annual NLCD Data – official access to Annual NLCD land-cover and impervious-surface data.
- USGS Annual NLCD Land Cover Classification – documentation for land-cover classes and interpretation.
- U.S. Census Bureau TIGER/Line Shapefiles – official geographic boundary data for counties, places, roads, and other features.
- Towns County Government – official local information on Hiawassee, Young Harris, Lake Chatuge, Brasstown Bald, and county services.
- UGA Extension Towns County – Agriculture & Natural Resources – research-based local agriculture and natural-resource information.
- Chattahoochee-Oconee National Forests – USDA Forest Service background on north Georgia forest, stream, and recreation resources.
Green Map creates custom-edited map images using open geographic data sources such as geoBoundaries, Natural Earth, OpenStreetMap, and government open data.
These maps are edited visual materials, not raw data files, and are provided for education, documents, presentations, and graphic reference.